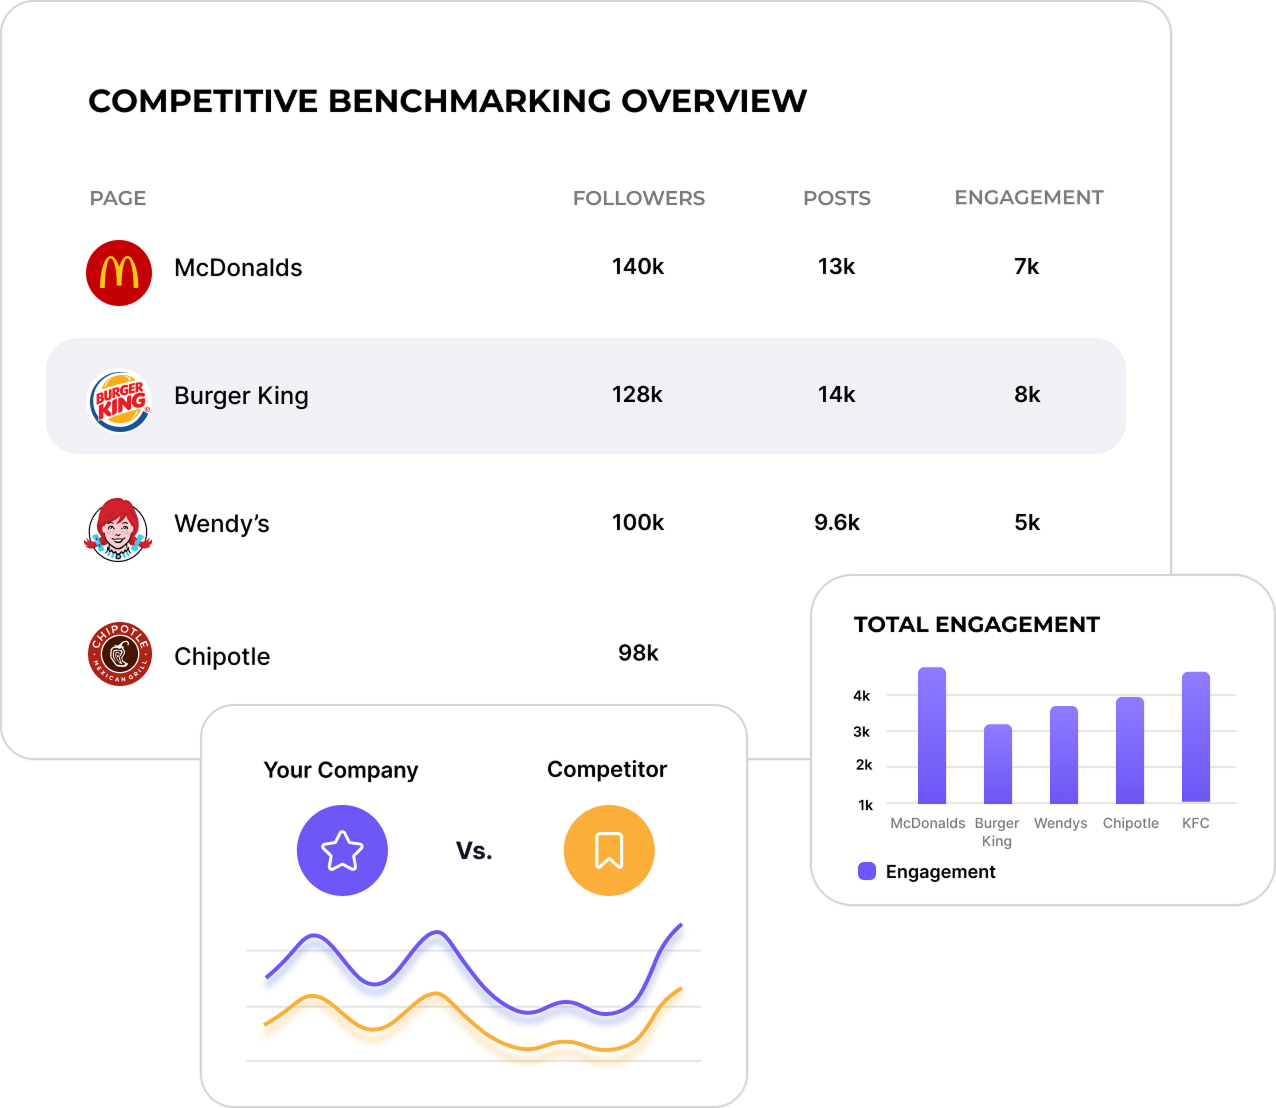
Show exactly
how you stack up
Lead with social media analytics, not assumptions. Prove your impact fast with the only
tool built for unbeatable competitor analysis across every major platform.


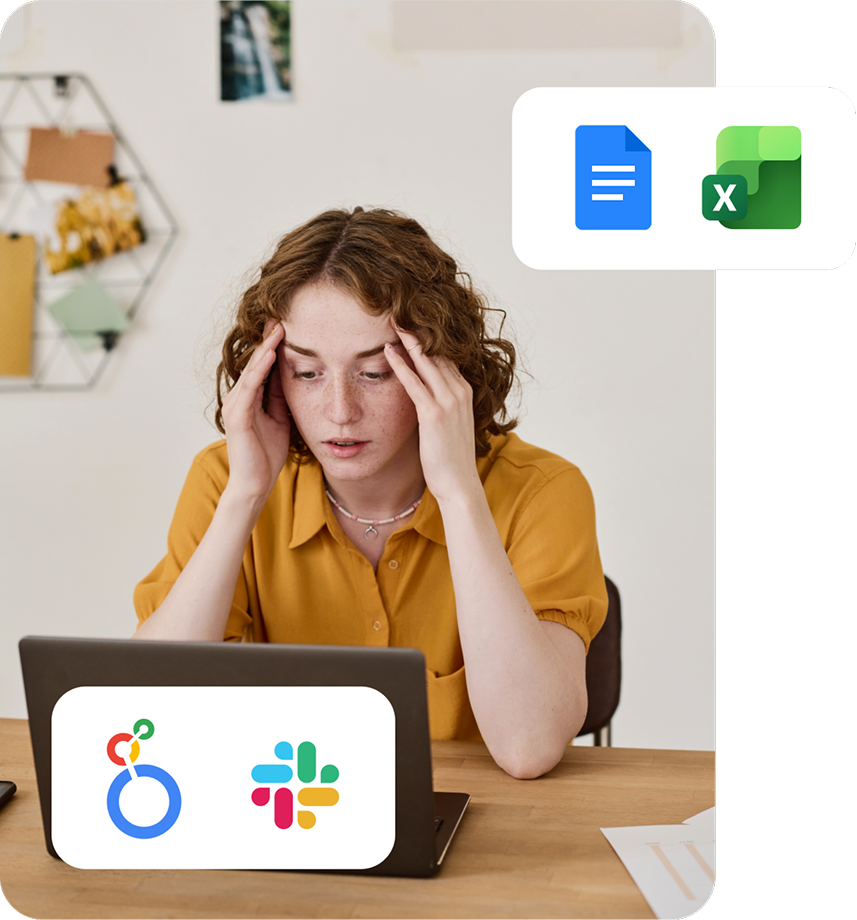
Without Socialinsider
You’re in the dark from day one.
Benchmarking is manual and messy,
making you second-guess your strategy.
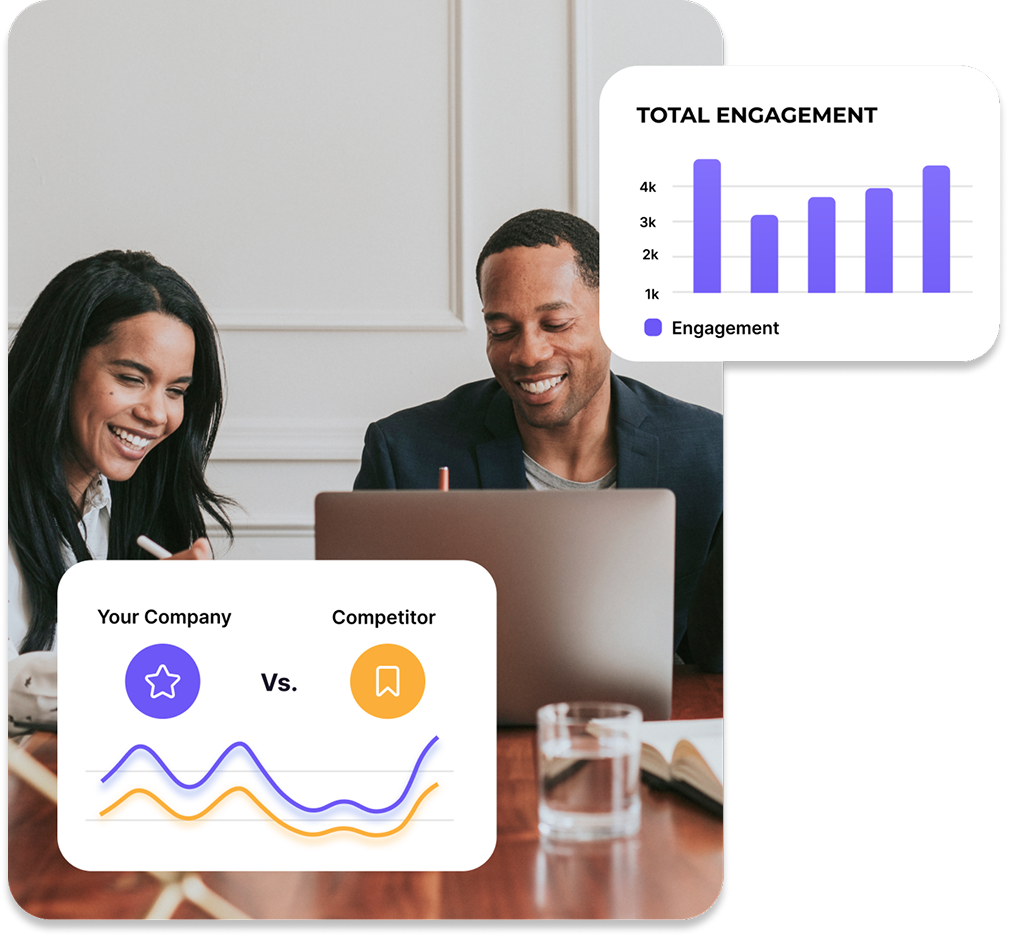
With Socialinsider
You know precisely how you perform.
Stay clear and credible with a plan you can
prove across platforms in just a few clicks.
Show up confident with
competitor insights that are..
 Reliable
 Clear
Clear Strategic
 Caitlin DuffyRoisin Consulting
 Customer service has been one of my favourite features as well. You guys are just phenomenal. Your team is so responsive and very friendly and helpful. Which is not the norm.
 Declan SeachoyTrades Union CongressSocialinsider helped us understand whether we're improving or decreasing especially compared to the other accounts that we follow.
 Victor MukubvuMitsubishi ElectricSocialinsider allows for a competitor analysis that gives an insight to performance relative to the market.
 Giuseppe VeturiHavas Media NetworkThe sentiment analysis is amazing for Instagram hashtags. This new social media listening dashboard helped me in long-term planning.
 Arnold VieriuTribal WorldwideWe are using this social media analytics dashboard for all our 40 social media clients. We can have all the performance data in one single place.
 Yana BushmelevaFashionbiWith Socialinsider, our team became more efficient. We do not need to spend time on social media data gathering. Instead, we can focus on insights and analysis.
 Nick RadclyffeCEO at Hype LabWe use Socialinsider for day-to-day social media insights if we need to outline any simple strategic changes or review the performance of certain social posts.
 Dorra LunetHanging Gardens AgencyOn average, a social media report for a brand requires 1 to 2 hours of work with Socialinsider, where it used to require a full day to gather the data.
 Mohamed El-DalyCreate MediaSocialinsider has saved us more than $16k per year. It has enabled us to save time on monthly reports and complex long-term analyses.
- Caitlin DuffyRoisin ConsultingCustomer service has been one of my favourite features as well. You guys are just phenomenal. Your team is so responsive and very friendly and helpful. Which is not the norm.
- Declan SeachoyTrades Union CongressSocialinsider helped us understand whether we're improving or decreasing especially compared to the other accounts that we follow.
- Victor MukubvuMitsubishi ElectricSocialinsider allows for a competitor analysis that gives an insight to performance relative to the market.
- Giuseppe VeturiHavas Media NetworkThe sentiment analysis is amazing for Instagram hashtags. This new social media listening dashboard helped me in long-term planning.
- Arnold VieriuTribal WorldwideWe are using this social media analytics dashboard for all our 40 social media clients. We can have all the performance data in one single place.
- Yana BushmelevaFashionbiWith Socialinsider, our team became more efficient. We do not need to spend time on social media data gathering. Instead, we can focus on insights and analysis.
- Nick RadclyffeCEO at Hype LabWe use Socialinsider for day-to-day social media insights if we need to outline any simple strategic changes or review the performance of certain social posts.
- Dorra LunetHanging Gardens AgencyOn average, a social media report for a brand requires 1 to 2 hours of work with Socialinsider, where it used to require a full day to gather the data.
- Mohamed El-DalyCreate MediaSocialinsider has saved us more than $16k per year. It has enabled us to save time on monthly reports and complex long-term analyses.


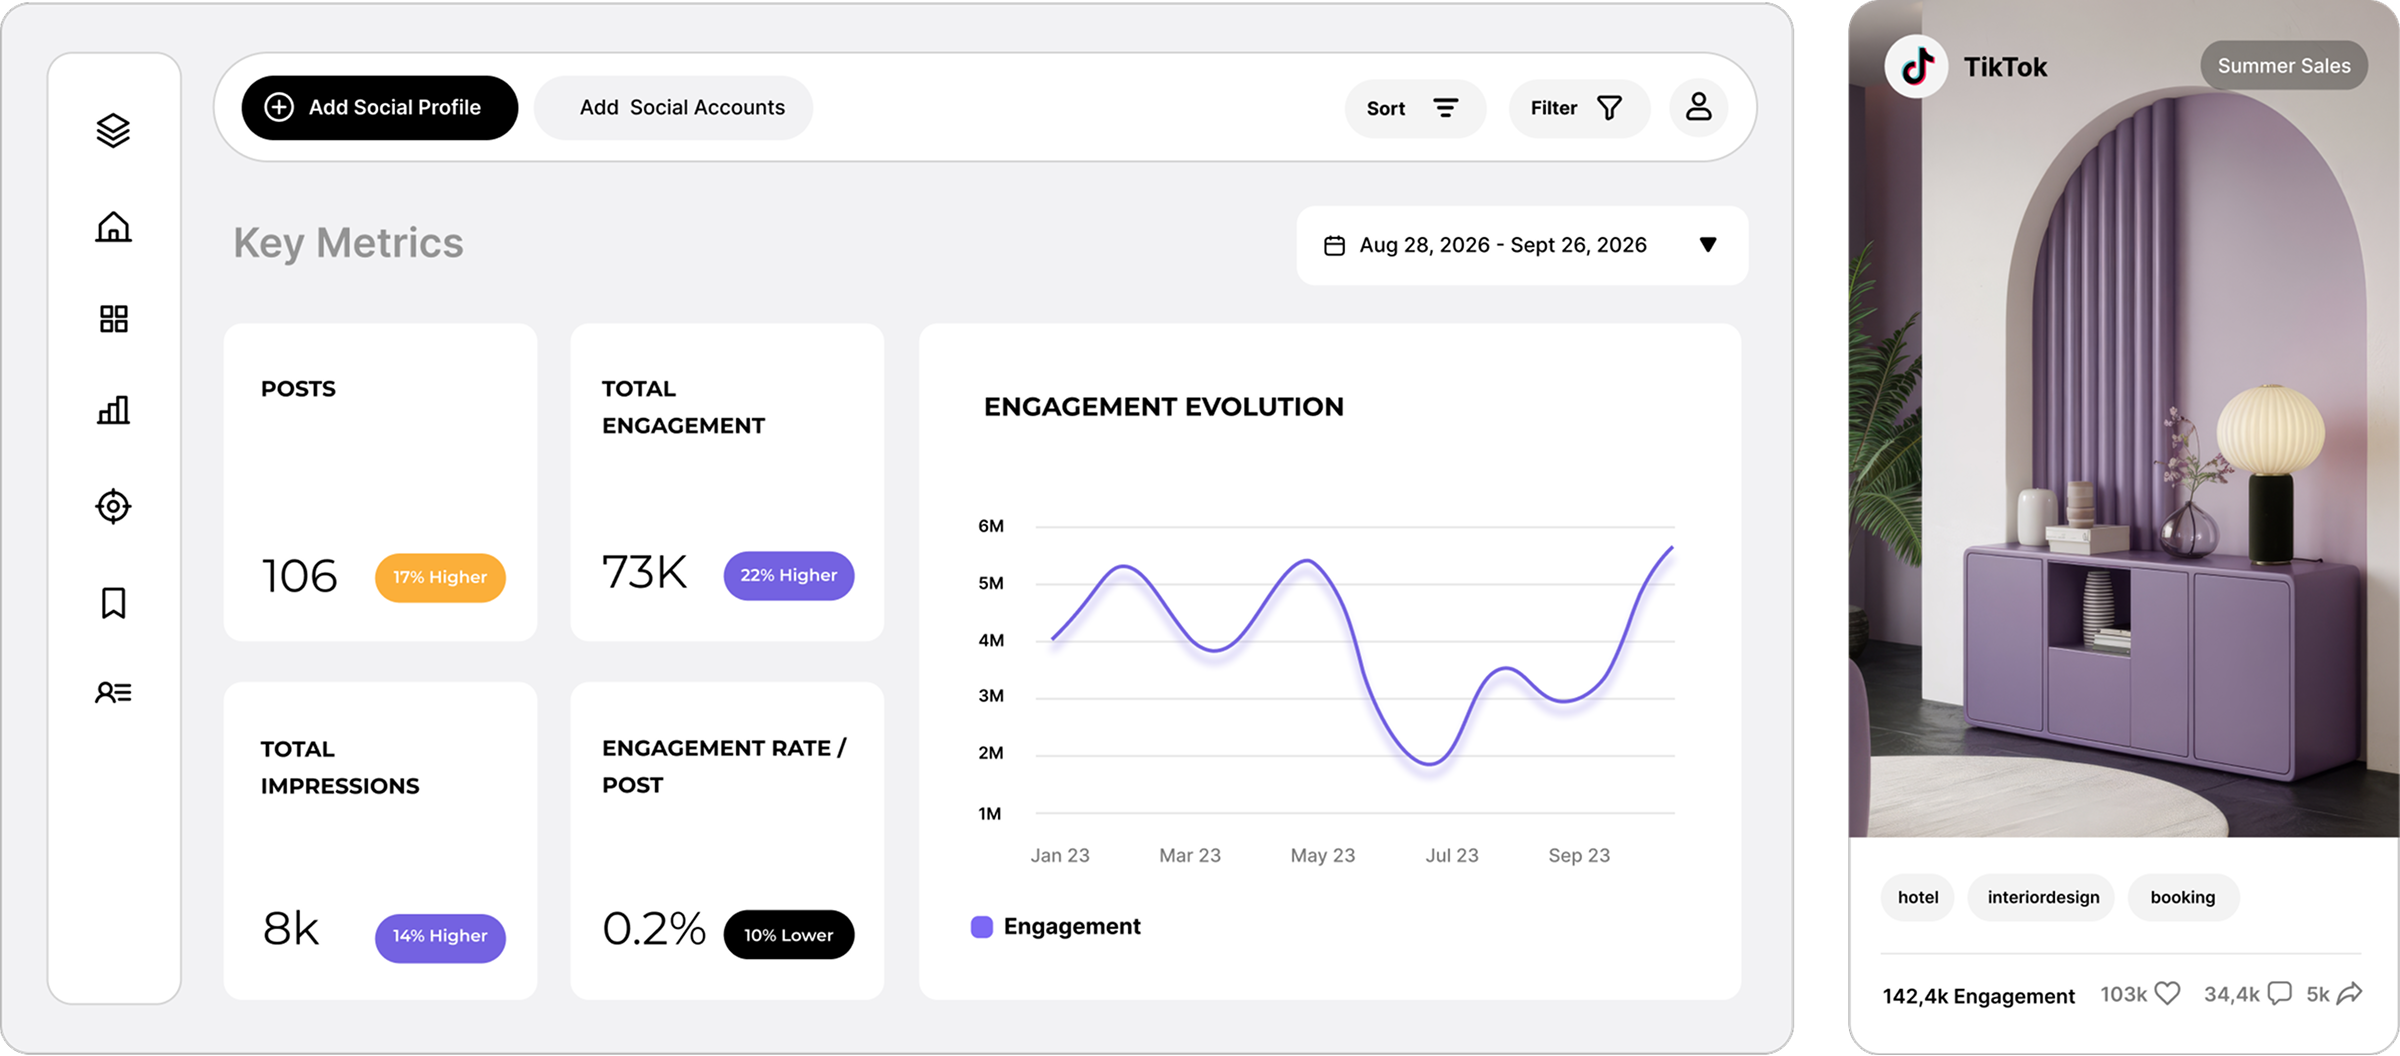
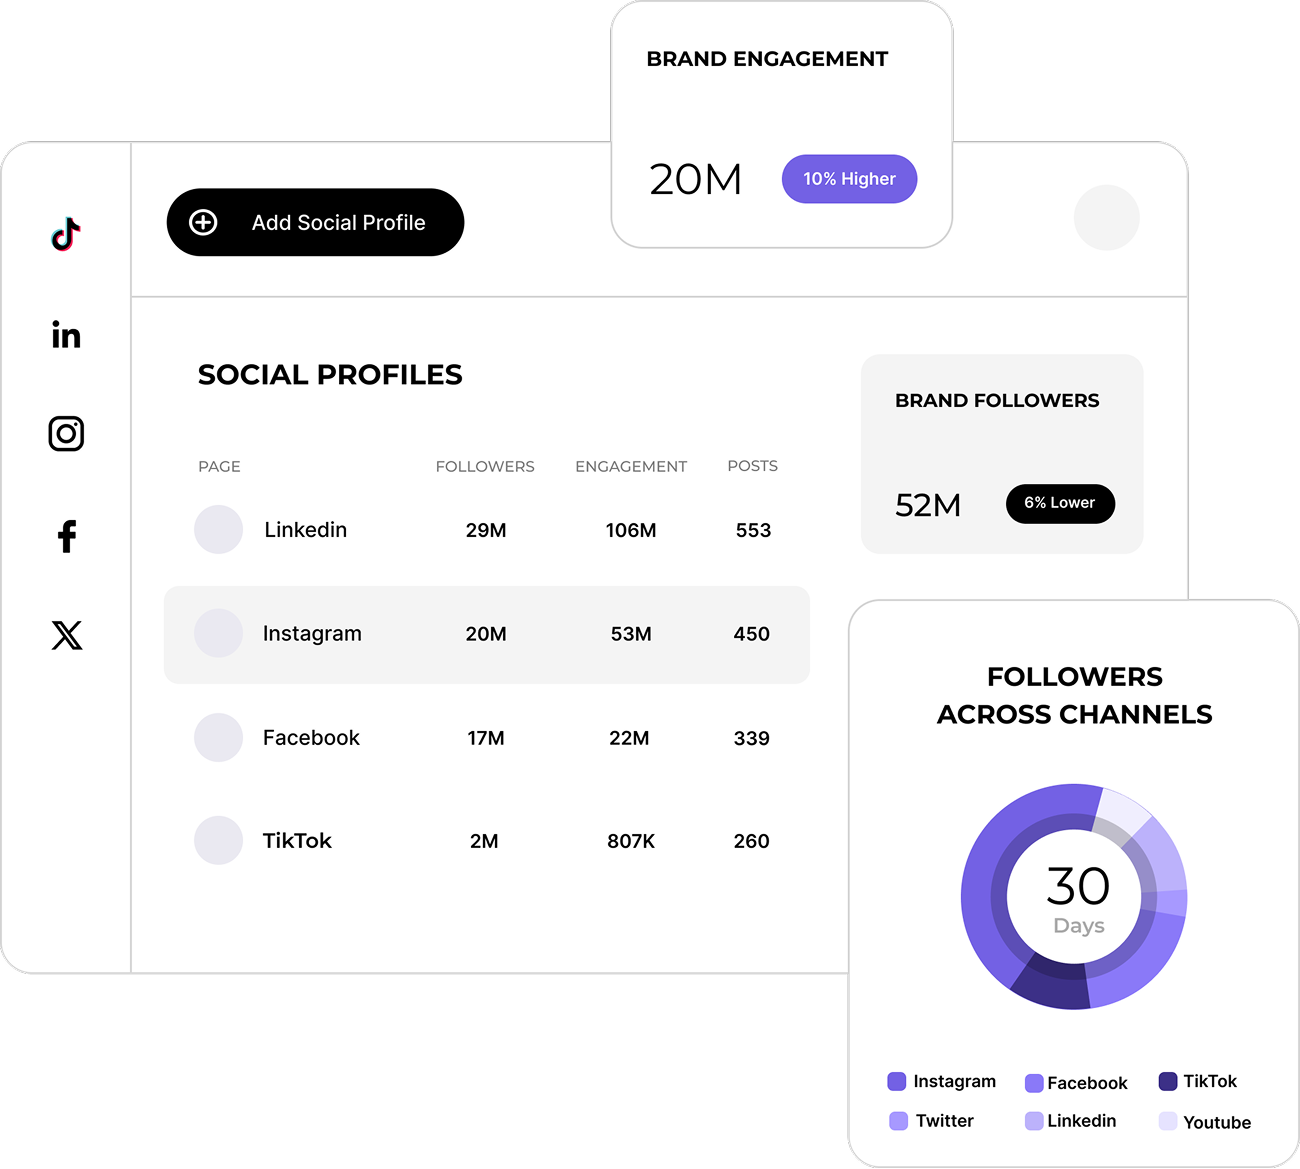
Make confident
decisions
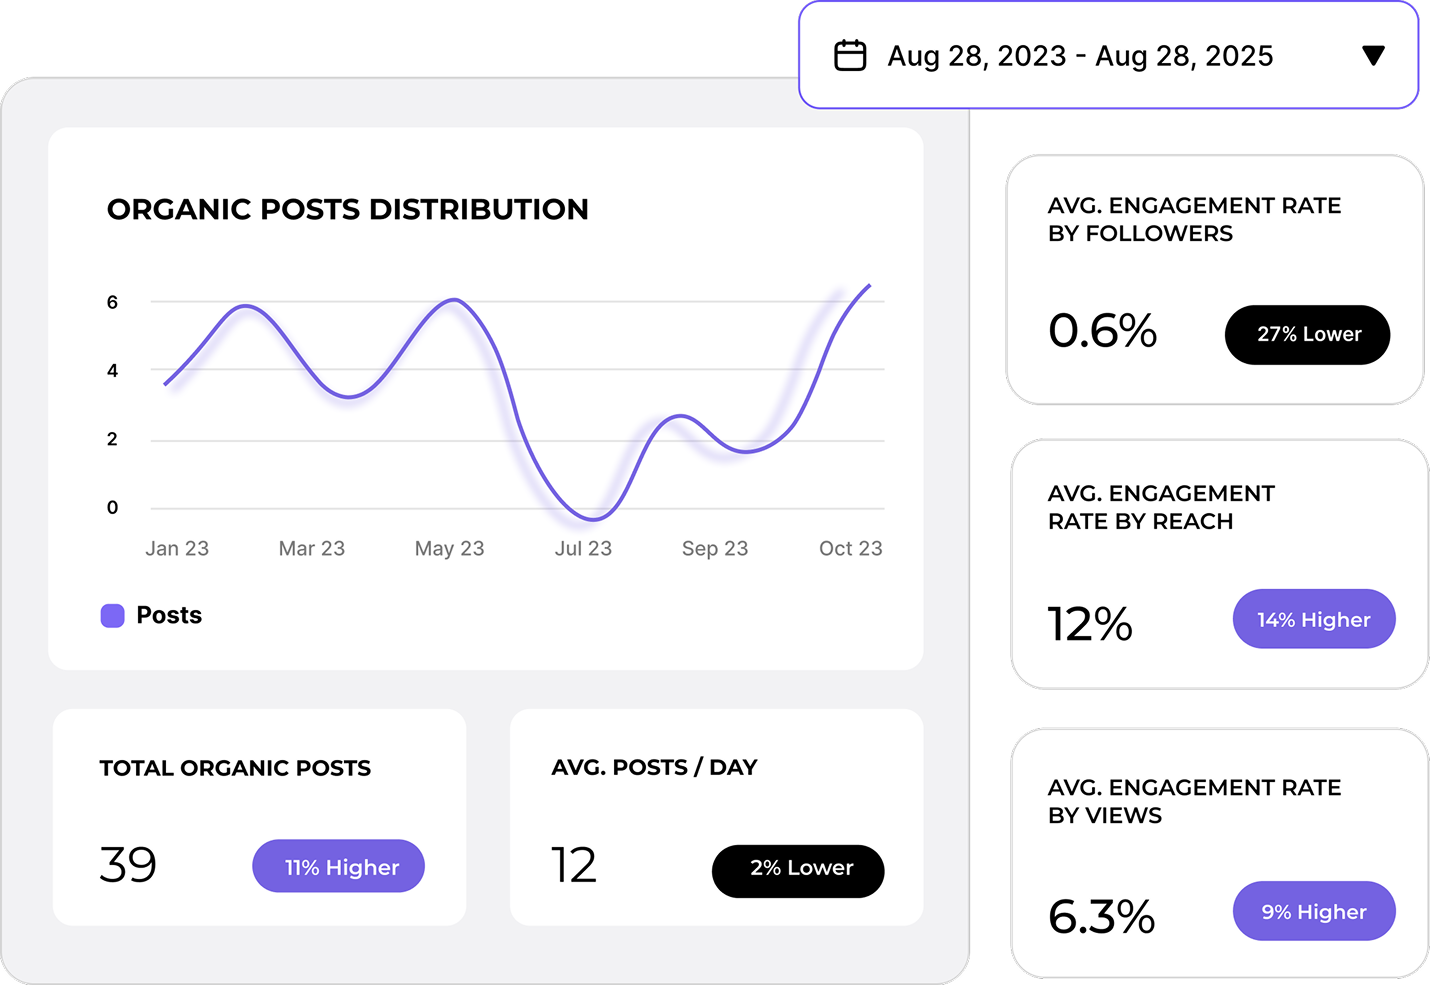
Socialinsider gives you trustworthy data, performance metrics, and content trends across every major platform in real time, so you can benchmark growth and track performance changes over time.
Add context
to your results
Historical social media data lets you compare performance over time, helping you understand trends rather than just snapshots.
Put your results in perspective and turn raw metrics into actionable insights.
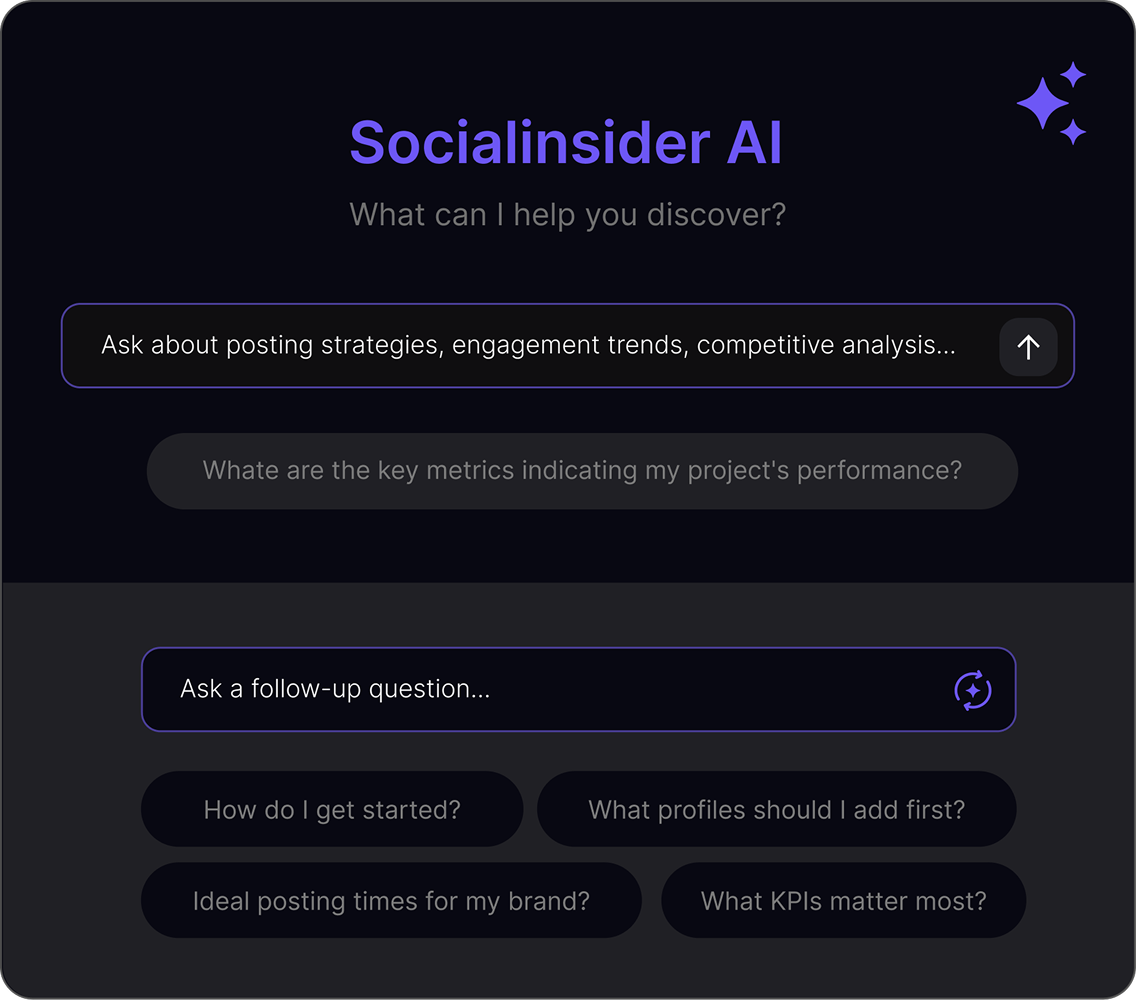
Get an AI companion
that helps you
dive deep
Complex analysis is as easy as asking a question.
Have a conversation with Socialinsider AI about exactly what you need, whether it’s specific benchmarks, insights, or reports.
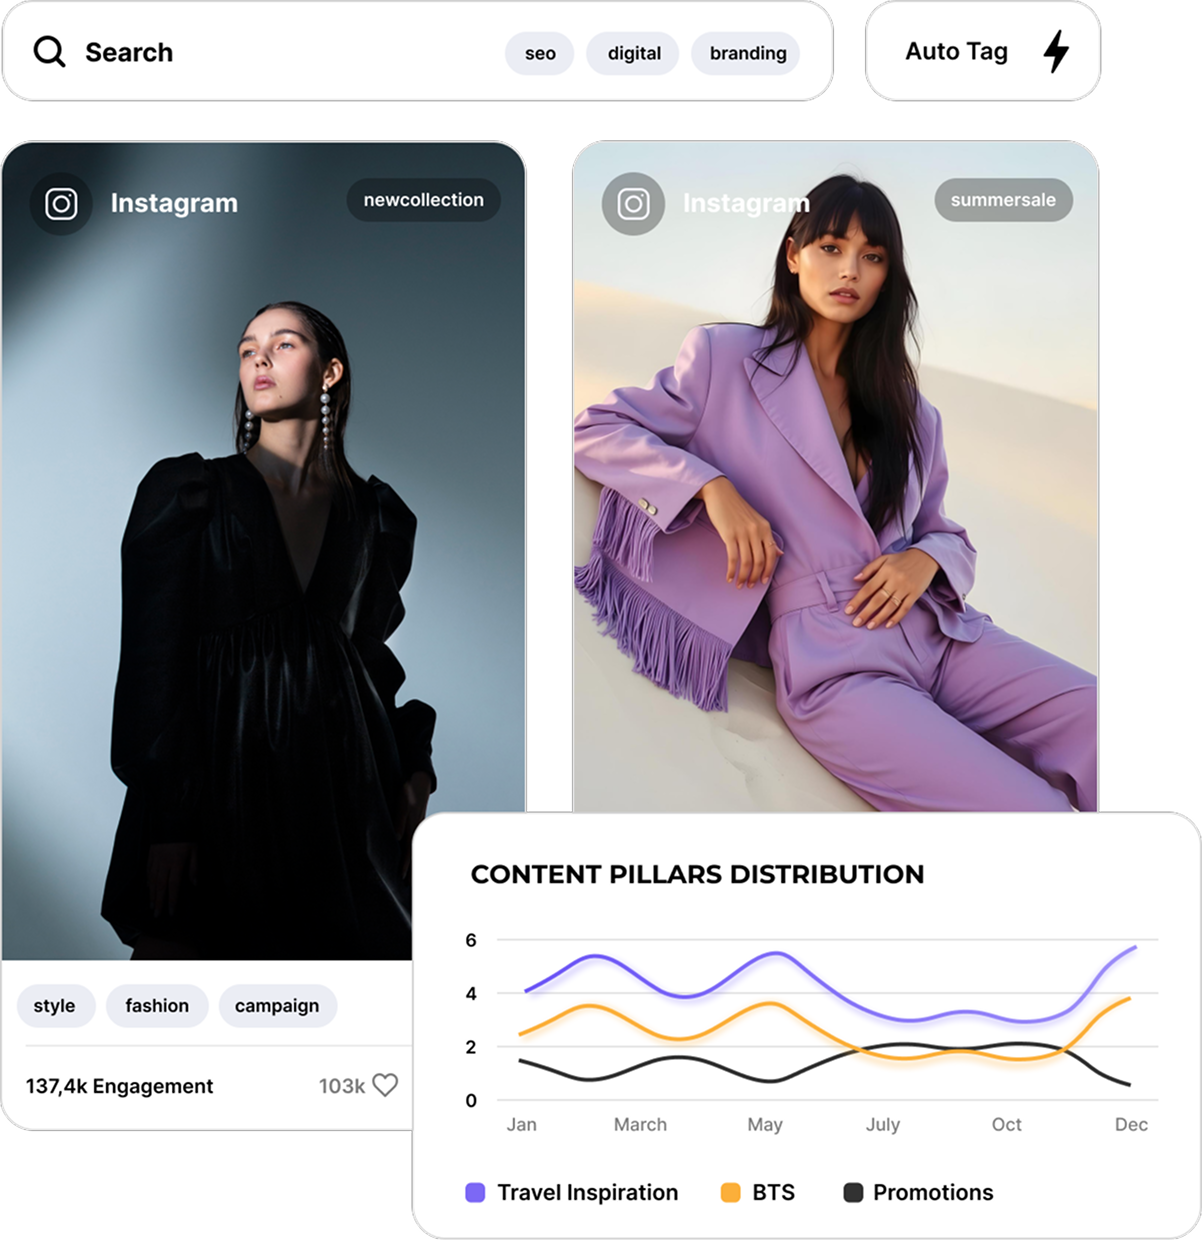
Spot winning content to fuel your strategy
AI-powered content pillars show you what’s working for competitors and across your industry.
See top-performing posts and rising patterns and develop a winning game plan.
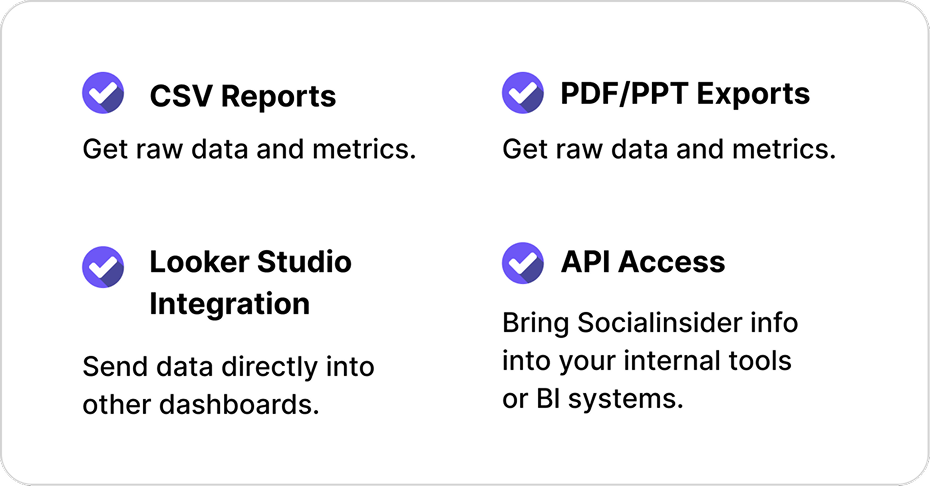
Report like a pro
Download any chart, comparison, or dataset in seconds.
Export full reports, raw data, or platform ready files for deeper analysis.
" The competitor analysis helped in creating visibility on how we are performing in the market. "
Victor Mukubvu, Digital Marketing Analyst at Mitsubishi Electric
Already have a tool stack?
Socialinsider fills in the gaps


