
The benchmark at a glance
- Media & Entertainment brands that posted
- 56Brands
- Followers per brand
- 27.8MAvg.Median 6.49M
- Engagements per brand
- 22.9MAvg.Median 3.5M
- Engagement rate per brand
- 0.36%Avg.Median 0.094%
Top 10 Media & Entertainment brands
Sort by any column. Q3 2026, across all platforms.
| Rank | Brand | ||||
|---|---|---|---|---|---|
| 01 |  Marvel EntertainmentPosted on Facebook, Instagram, TikTok, X and YouTube | 167M | 121M | 838 | 0.61% |
| 02 |  NetflixPosted on Instagram, TikTok, X and YouTube | 160M | 167M | 2,607 | 0.15% |
| 03 |  CNNPosted on Facebook, Instagram, TikTok and X | 146M | 224M | 11,627 | 0.10% |
| 04 |  DisneyPosted on Facebook, Instagram, TikTok, X and YouTube | 132M | 30.1M | 722 | 0.21% |
| 05 |  ESPNPosted on Facebook, Instagram and X | 113M | 148M | 1,591 | 0.32% |
| 06 |  BBC NewsPosted on Facebook, Instagram, TikTok, X and YouTube | 108M | 70.4M | 7,788 | 0.049% |
| 07 |  The New York TimesPosted on Facebook, Instagram, TikTok and X | 101M | 43.8M | 9,025 | 0.035% |
| 08 |  DiscoveryPosted on Facebook, Instagram, TikTok, X and YouTube | 86.9M | 11.1M | 1,162 | 0.087% |
| 09 |  MTVPosted on Facebook, Instagram, TikTok, X and YouTube | 65.7M | 53.5M | 2,580 | 0.28% |
| 10 |  Sony Pictures EntertainmentPosted on Facebook, Instagram, TikTok, X and YouTube | 52.9M | 8.02M | 135 | 1.22% |
Standout posts across the benchmark
The Media & Entertainment posts with the most engagements in Q3 2026, on any platform.
 Video on TikTok, Jul 20
 Marvel Entertainment
Doomsday arrives December 18th. Experience Avengers: Doomsday on bigger, brighter, & more immersive screens. Tickets are now on sale exclusively for Infinity Vision certified theat
12,445,720 engagements View post (opens in a new tab) Video on TikTok, Jul 1
 ABC News
JUST IN: After two people climbed to the top of the Empire State Building and unfurled a banner on top of its spire Wednesday afternoon, one of the climbers appeared to propose to
10,511,190 engagements View post (opens in a new tab)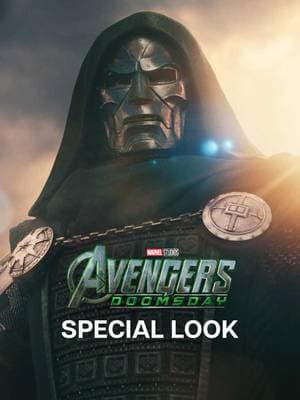 Video on TikTok, Aug 15Marvel Entertainment
He used to be different. Avengers: Doomsday arrives in theaters everywhere December 18. Get your tickets now: fandango.com/avengersdoomsday
10,286,374 engagements View post (opens in a new tab)
Platform breakdown
Averages per platform for Media & Entertainment brands in Q3 2026.
| Metric | TikTok | X | YouTube | ||
|---|---|---|---|---|---|
| Avg. engagement rate per post | 0.27% | 0.47% | 0.017% | 0.011% | 0.055% |
| Avg. posts per brand per week | 57.8 | 29.8 | 144.8 | 40.9 | 18.2 |
| Brands present on the platform | 25 | 27 | 40 | 22 | 14 |
Brands present on the platform: brands that posted at least once on the platform in Q3 2026 (July 1 – September 30, 2026).
See how your brand compares to the Media & Entertainment benchmark
Track your profiles and your competitors on every platform, measure them against your industry and download reports in seconds.
What worked on each platform
Where the Media & Entertainment engagements came from in Q3 2026, next to where brands posted.
| Platform | Engagements | Posts |
|---|---|---|
| 45.2% | 15.7% | |
| TikTok | 39.7% | 8.7% |
| 12.5% | 63% | |
| YouTube | 1.3% | 2.8% |
| X | 1.2% | 9.8% |
| Format | Engagements | Posts |
|---|---|---|
| Video | 77.6% | 34% |
| Carousel | 12.3% | 4.7% |
| Image | 8.3% | 26% |
| Link | 1.4% | 28.8% |
| Text | 0.4% | 6.4% |
| Other | 0% | 0% |
Observations
Written by AI from this report's data.
Instagram and TikTok generated most of the industry’s engagement, contributing 45.2% and 39.7% respectively from 24.4% of posts combined. Video stood out across formats, earning 77.6% of engagement from 34% of posts.
- Facebook accounted for the largest share of posts at 63%, but only 12.5% of engagement. Instagram and TikTok together made up 24.4% of posts and 84.9% of engagement.
- Video drew 77.6% of engagement from 34% of posts, while Link accounted for 28.8% of posts but just 1.4% of engagement. Carousel also over-indexed, contributing 12.3% of engagement from 4.7% of posts.
- On Facebook, Reels had a 0.05% average engagement rate compared with 0.005% for Link. NBCNews’ top Facebook post was a Reels post with 1,131,030 engagements.
How we calculate this
Every figure in this report comes from public social media data, collected by Socialinsider.
- Period
- The full calendar quarter July 1 – September 30, 2026 (Q3 2026). The data is refreshed every quarter.
- Brands
- The leading global Media & Entertainment brands and their official accounts on Instagram, TikTok, Facebook, X and YouTube. A brand counts as present on a platform if it posted there at least once in the period.
- Engagements
- Likes, comments and shares or reposts on a post, plus saves where the platform reports them.
- Engagement rate
- A post's engagements divided by the profile's followers at the time of the post, times 100. Averages are the mean across posts. Posts with an engagement rate above 100% are excluded as data errors.
- Per-brand figures
- Averages and medians are computed across the brands that posted in the period. A brand's engagement rate needs at least 10 posts.
- Platform figures
- Platform figures are shown only when at least 5 brands posted on that platform.
- Breakdowns
- The platform and format charts show each slice's share of all the industry's posts and engagements. Formats are grouped across platforms: Reels and videos count as Video, carousels and albums as Carousel.
- Observations
- The observations are written by AI from this report's numbers.