
The benchmark at a glance
- Food brands that posted
- 84Brands
- Followers per brand
- 1.33MAvg.Median 387k
- Engagements per brand
- 31.2kAvg.Median 4.16k
- Engagement rate per brand
- 0.49%Avg.Median 0.15%
Top 10 Food brands
Sort by any column. Q3 2026, across all platforms.
| Rank | Brand | ||||
|---|---|---|---|---|---|
| 01 |  NestléPosted on Facebook, Instagram and YouTube | 12.4M | 63.3k | 65 | 0.17% |
| 02 |  M&M'S USAPosted on Facebook | 12.3M | 5.66k | 14 | 0.003% |
| 03 |  KinderPosted on Facebook and Instagram | 12M | 2.01k | 10 | 0.065% |
| 04 |  SNICKERSPosted on Facebook | 8.72M | 3.08k | 24 | 0.001% |
| 05 |  GerberPosted on Facebook, Instagram and TikTok | 6.26M | 92.8k | 113 | 0.24% |
| 06 |  Sour Patch KidsPosted on Facebook and Instagram | 4.21M | 309k | 42 | 0.68% |
| 07 |  UnileverPosted on Facebook, Instagram, X and YouTube | 3.74M | 12.8k | 116 | 0.047% |
| 08 |  IndomiePosted on Facebook | 3.67M | 1.65k | 92 | 0.000% |
| 09 |  Cheez-ItPosted on Facebook and Instagram | 3.18M | 21.9k | 38 | 0.35% |
| 10 | DoritosPosted on TikTok and X | 2.74M | 62k | 120 | 0.034% |
Standout posts across the benchmark
The Food posts with the most engagements in Q3 2026, on any platform.
 Reels on Instagram, Aug 7
 benandjerrys
Together, we are UNSTOPPABLE. ✊🏿 And we won’t give up our power or our voice. Join us in TAKING ACTION to rise up against authoritarianism at the link in our bio, and at the polls
235,539 engagements View post (opens in a new tab)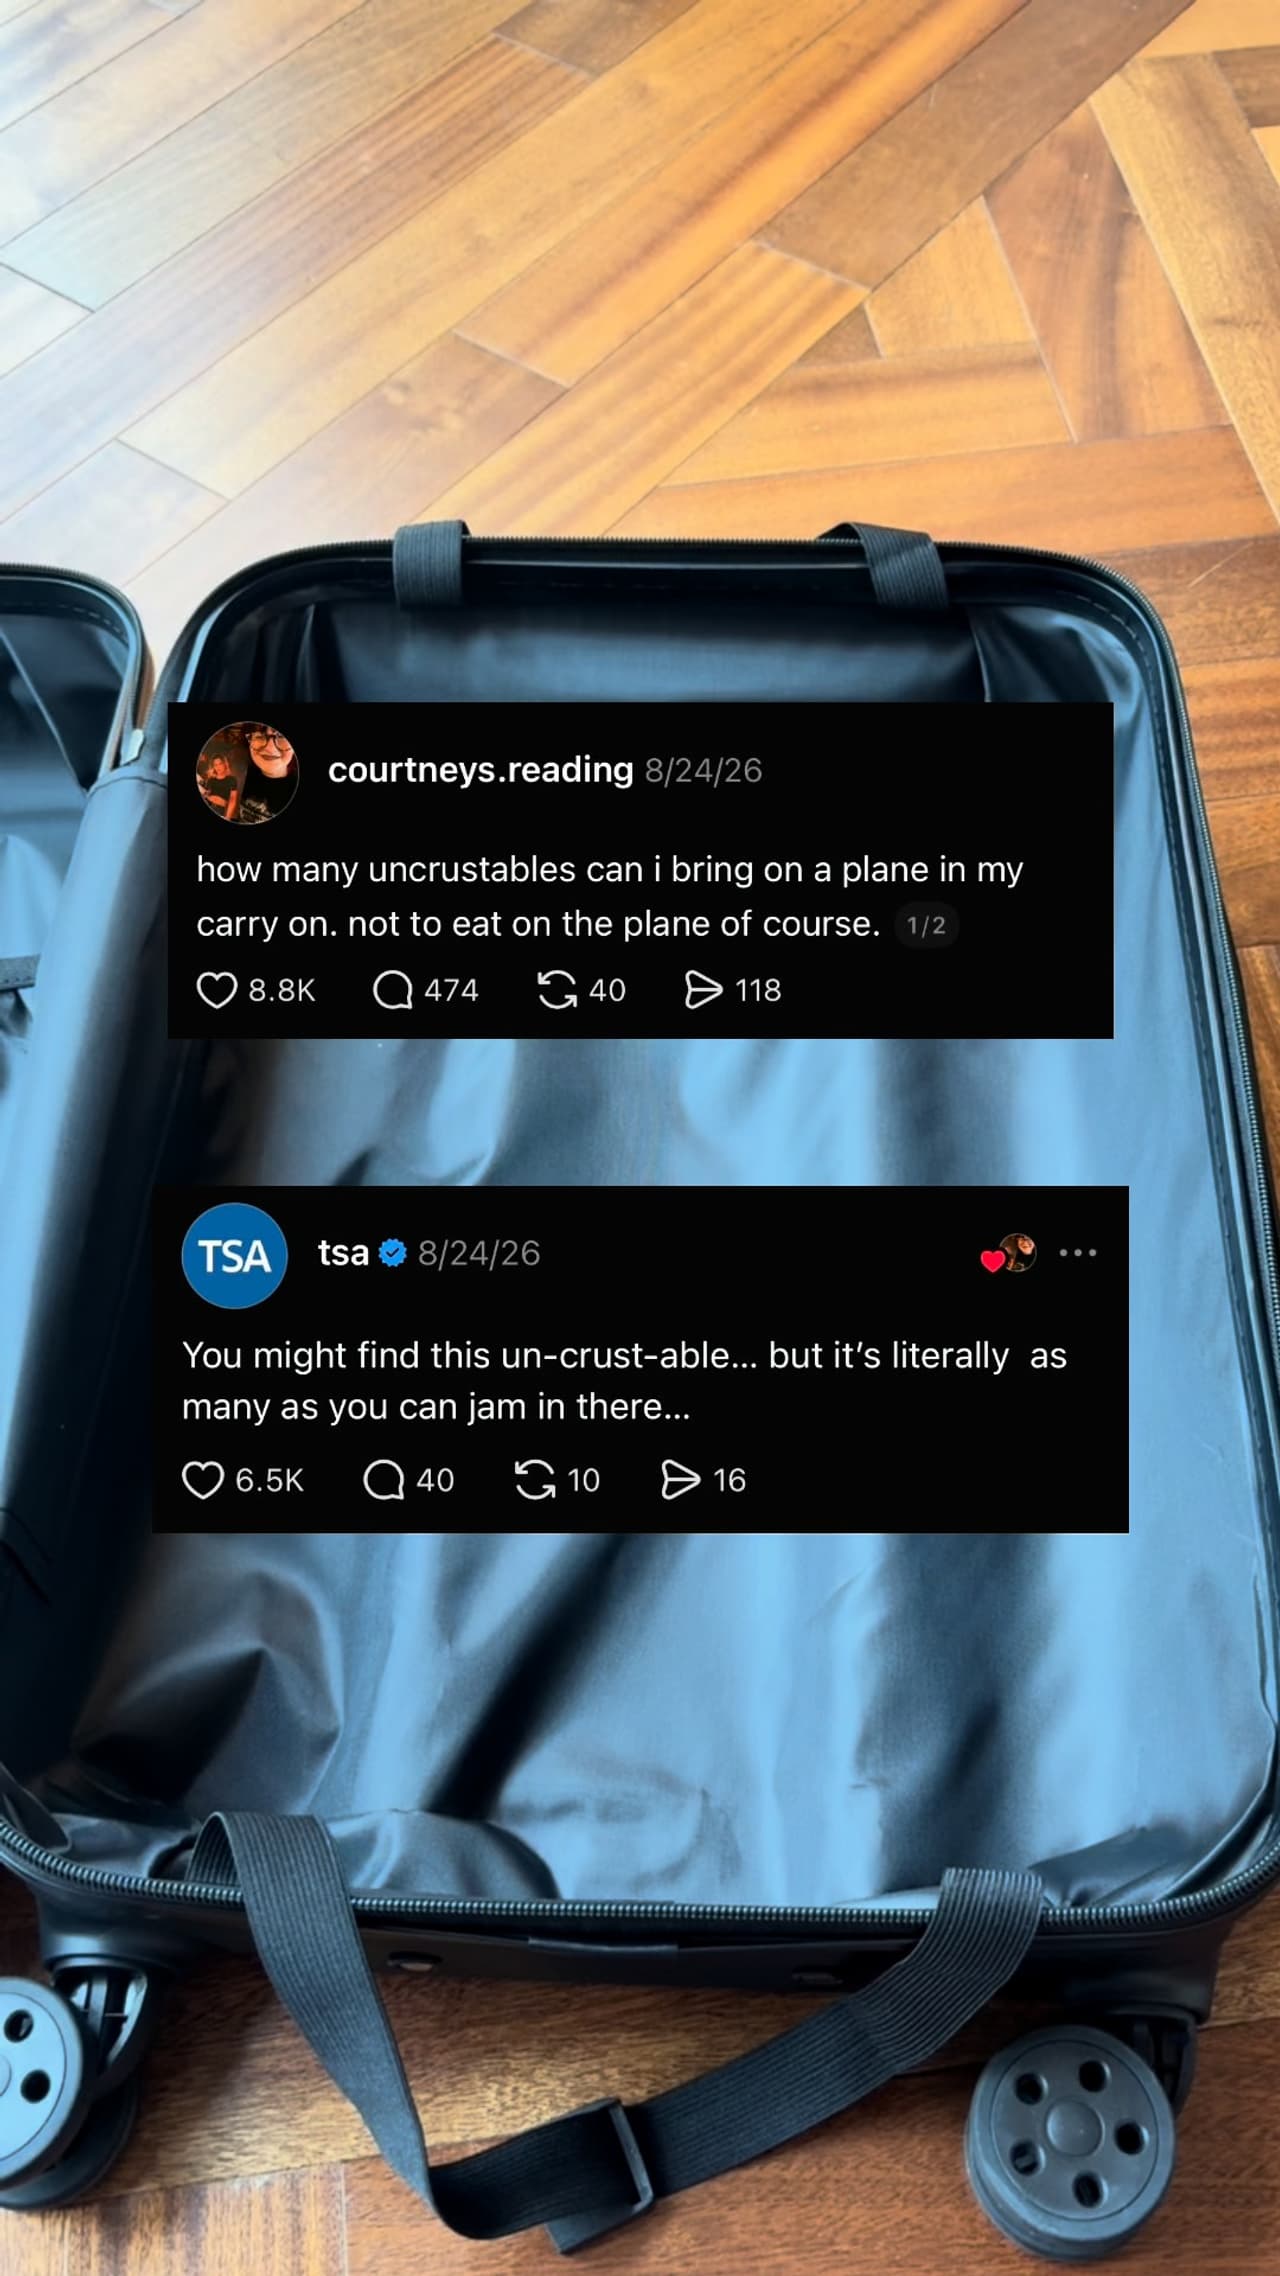 Reels on Instagram, Sep 4
 uncrustables
TSA challenge accepted
134,504 engagements View post (opens in a new tab) Video on YouTube, Aug 18
 Chupa Chups
Bộ đôi Kẹo dẻo Chupa Chups Hươu Cao Cổ hương trái cây vani và hương dâu vani mềm dai dài xoắn, chua chua ngọt ngọt mở ra hành trình vui bất tận trong từng thanh kẹo. Sẵn sàng thưởn
98,694 engagements View post (opens in a new tab)
Platform breakdown
Averages per platform for Food brands in Q3 2026.
| Metric | TikTok | X | YouTube | ||
|---|---|---|---|---|---|
| Avg. engagement rate per post | 0.30% | 0.91% | 0.13% | 0.023% | 0.67% |
| Avg. posts per brand per week | 2.7 | 1.7 | 1.7 | 1 | 1.8 |
| Brands present on the platform | 31 | 14 | 57 | 10 | 17 |
Brands present on the platform: brands that posted at least once on the platform in Q3 2026 (July 1 – September 30, 2026).
See how your brand compares to the Food benchmark
Track your profiles and your competitors on every platform, measure them against your industry and download reports in seconds.
What worked on each platform
Where the Food engagements came from in Q3 2026, next to where brands posted.
| Platform | Engagements | Posts |
|---|---|---|
| 54.4% | 33.7% | |
| TikTok | 17.4% | 9.8% |
| 15.6% | 39.8% | |
| YouTube | 12% | 12.5% |
| X | 0.6% | 4.2% |
| Format | Engagements | Posts |
|---|---|---|
| Video | 73.3% | 63.2% |
| Image | 13.5% | 19.2% |
| Carousel | 12.8% | 13.3% |
| Text | 0.3% | 2.3% |
| Link | 0.1% | 2% |
Observations
Written by AI from this report's data.
Food brands’ engagement came primarily from Instagram, which generated 54.4% of engagement from 33.7% of posts. Video stood out across formats, accounting for 73.3% of engagement on 63.2% of posts.
- Facebook had the largest share of posts at 39.8%, but contributed 15.6% of engagement. Instagram posted 33.7% of the content and generated 54.4% of engagement.
- Video contributed 73.3% of engagement from 63.2% of posts across formats. Image was less engagement-heavy, with 13.5% of engagement from 19.2% of posts.
- On Instagram, Reels made up 55.9% of posts and had an average engagement rate of 0.309%. The top Instagram post was a Reels post from benandjerrys, with 235539 engagements.
How we calculate this
Every figure in this report comes from public social media data, collected by Socialinsider.
- Period
- The full calendar quarter July 1 – September 30, 2026 (Q3 2026). The data is refreshed every quarter.
- Brands
- The leading global Food brands and their official accounts on Instagram, TikTok, Facebook, X and YouTube. A brand counts as present on a platform if it posted there at least once in the period.
- Engagements
- Likes, comments and shares or reposts on a post, plus saves where the platform reports them.
- Engagement rate
- A post's engagements divided by the profile's followers at the time of the post, times 100. Averages are the mean across posts. Posts with an engagement rate above 100% are excluded as data errors.
- Per-brand figures
- Averages and medians are computed across the brands that posted in the period. A brand's engagement rate needs at least 10 posts.
- Platform figures
- Platform figures are shown only when at least 5 brands posted on that platform.
- Breakdowns
- The platform and format charts show each slice's share of all the industry's posts and engagements. Formats are grouped across platforms: Reels and videos count as Video, carousels and albums as Carousel.
- Observations
- The observations are written by AI from this report's numbers.