Barceló Hotel Group Brand Overview
See social media performance data for Barceló Hotel Group
Barceló Hotel Group
0.07%
Brand Avg Engagement RateLink
Top Content (By Eng. Rate)8598
Avg. Brand Video ViewsBrand Posts Across Channels
Cross-channels analysis of the post
Brand Posts Across Channels
| Channels | Posts | Avg. Posts/Day |
|---|---|---|
 Twitter Twitter | 121 | 0.67 |
 Facebook Facebook | 37 | 0.21 |
 Instagram Instagram | 58 | 0.32 |
| Total | 216 | 1.2 |
Top Posts
Barceló Hotel Gr... Facebook
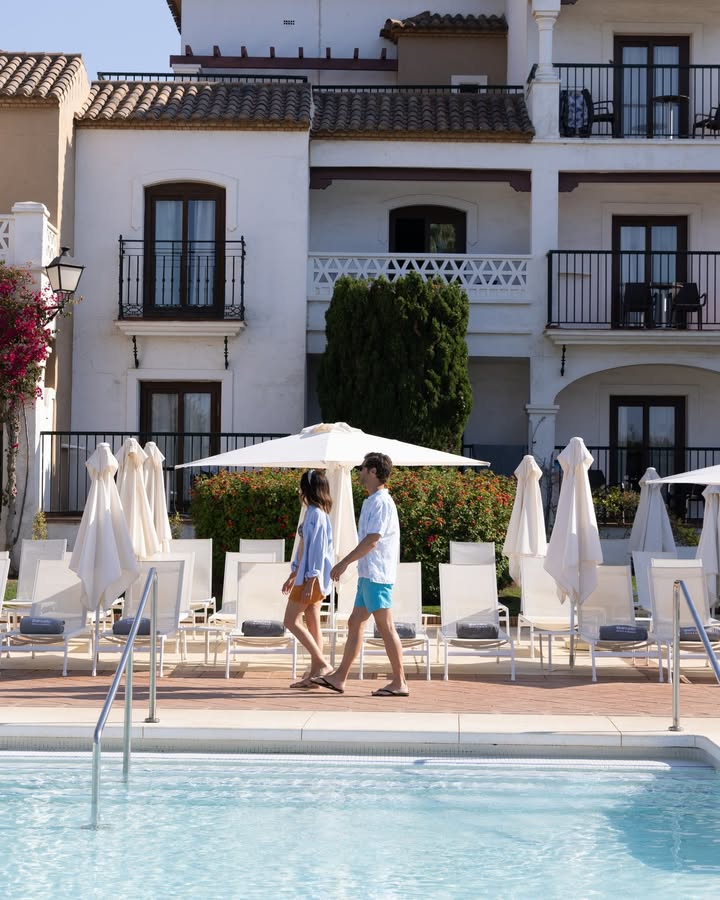
Jun 10, 2025
590K followers
Engagement Rate
1.405%
 Barceló Hotel Gr...
 Instagram
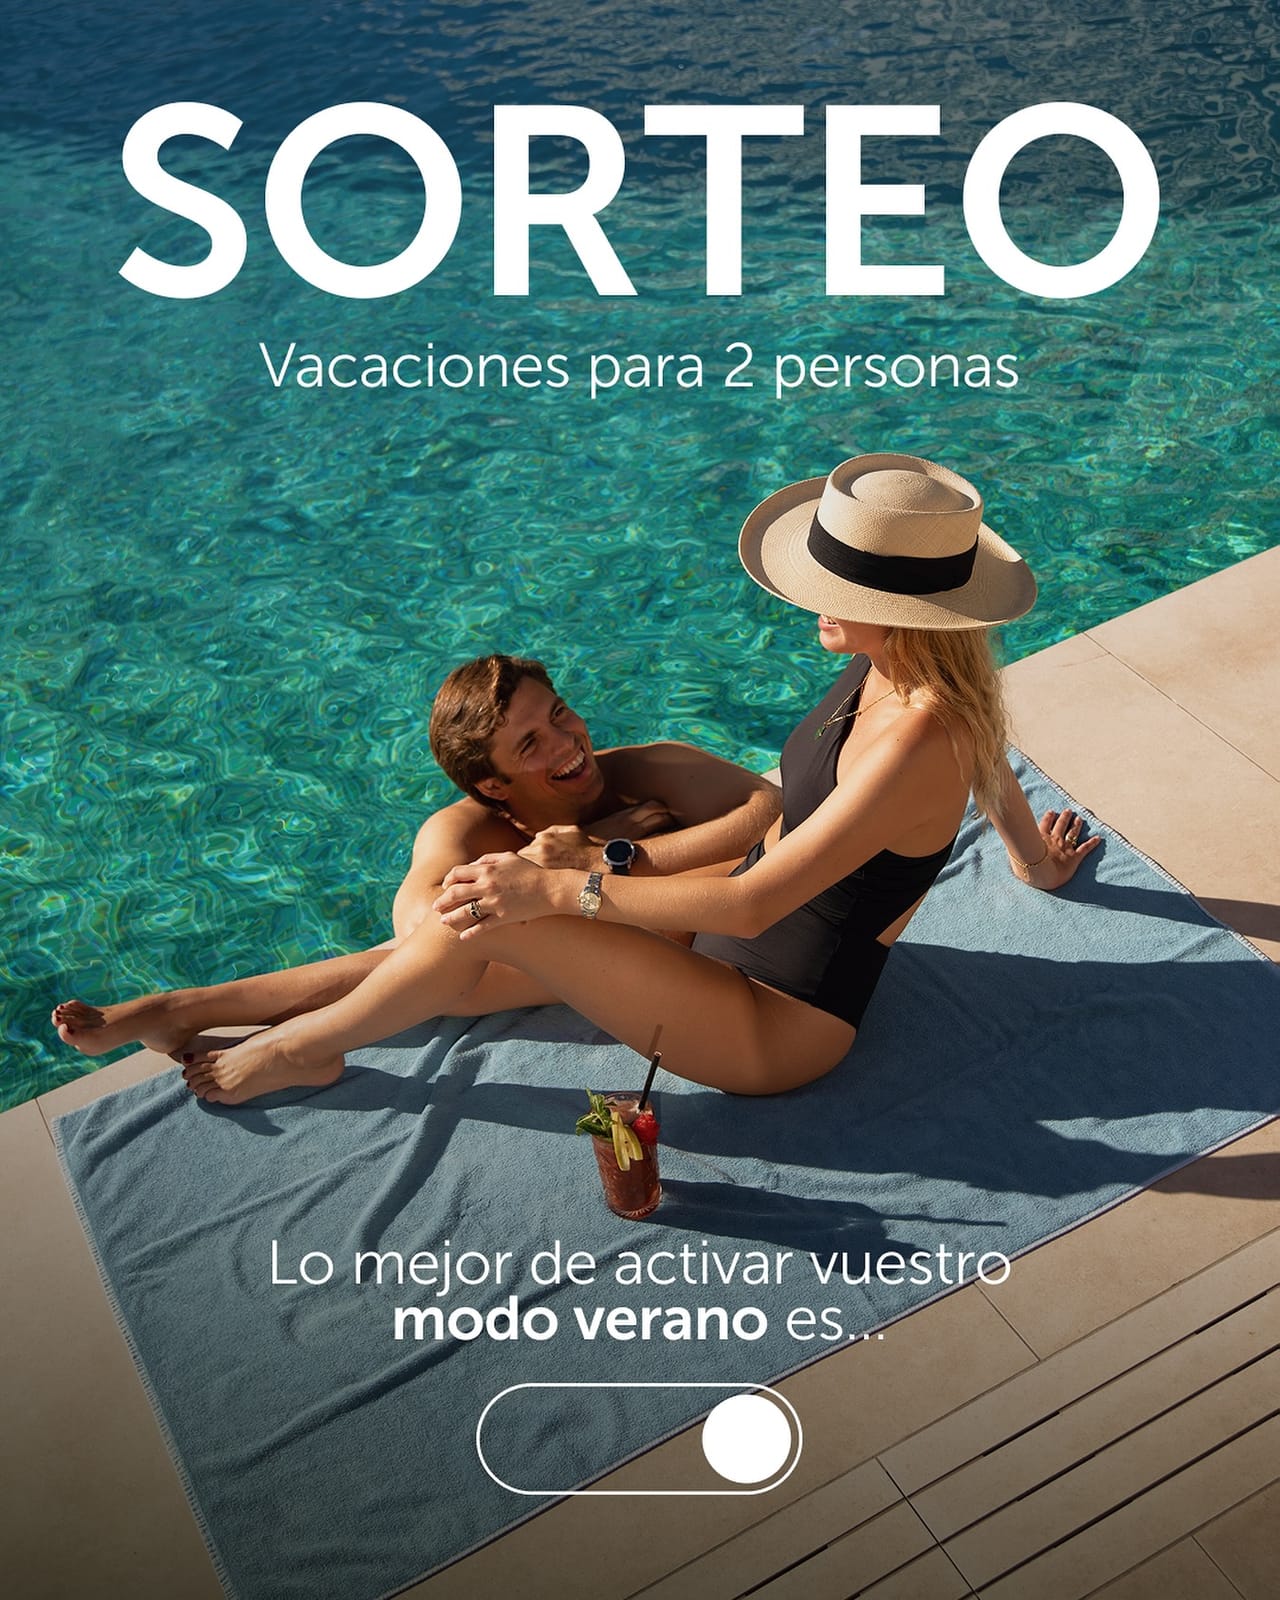
Jun 20, 2025
242K followers
Engagement Rate
1.204%
Barceló Hotel Gr... Facebook

Jun 11, 2025
590K followers
Engagement Rate
0.904%
Brand Engagement Across Channels
Cross-channels analysis of the engagement
Brand Engagement Across Channels
| Channels | Engagement | Avg. Engagement |
|---|---|---|
| Twitter | 464 | 3.83 |
| Facebook | 26K | 694.03 |
| Instagram | 11K | 185.16 |
| Average | 12K | 294.34 |
Brand Video Views Across Channels
Cross-channels analysis of the engagement
Brand Video Views Across Channels
| Channels | Video Views | Avg. Video Views |
|---|---|---|
| Twitter | 12K | 669.22 |
| Facebook | 425K | 24K |
| Instagram | 37K | 1539 |
| Average | 158K | 8598 |
Similar Brands
Explore top-performing brands from the Hospitality & Hotels Industry


Ready to improve your social media strategy with real-time insights
Get strategic insights, analyze the social performance across all channels, compare metrics from different periods and download reports in seconds.