Logona Brand Overview
See social media performance data for Logona

Logona
0.16%
Brand Avg Engagement RatePhoto
Top Content (By Eng. Rate)1132
Avg. Brand Video ViewsBrand Posts Across Channels
Cross-channels analysis of the post
Brand Posts Across Channels
| Channels | Posts | Avg. Posts/Day |
|---|---|---|
 YouTube YouTube | 0 | 0 |
 Facebook Facebook | 5 | 0.03 |
 Instagram Instagram | 45 | 0.25 |
| Total | 50 | 0.28 |
Top Posts
Logona Instagram
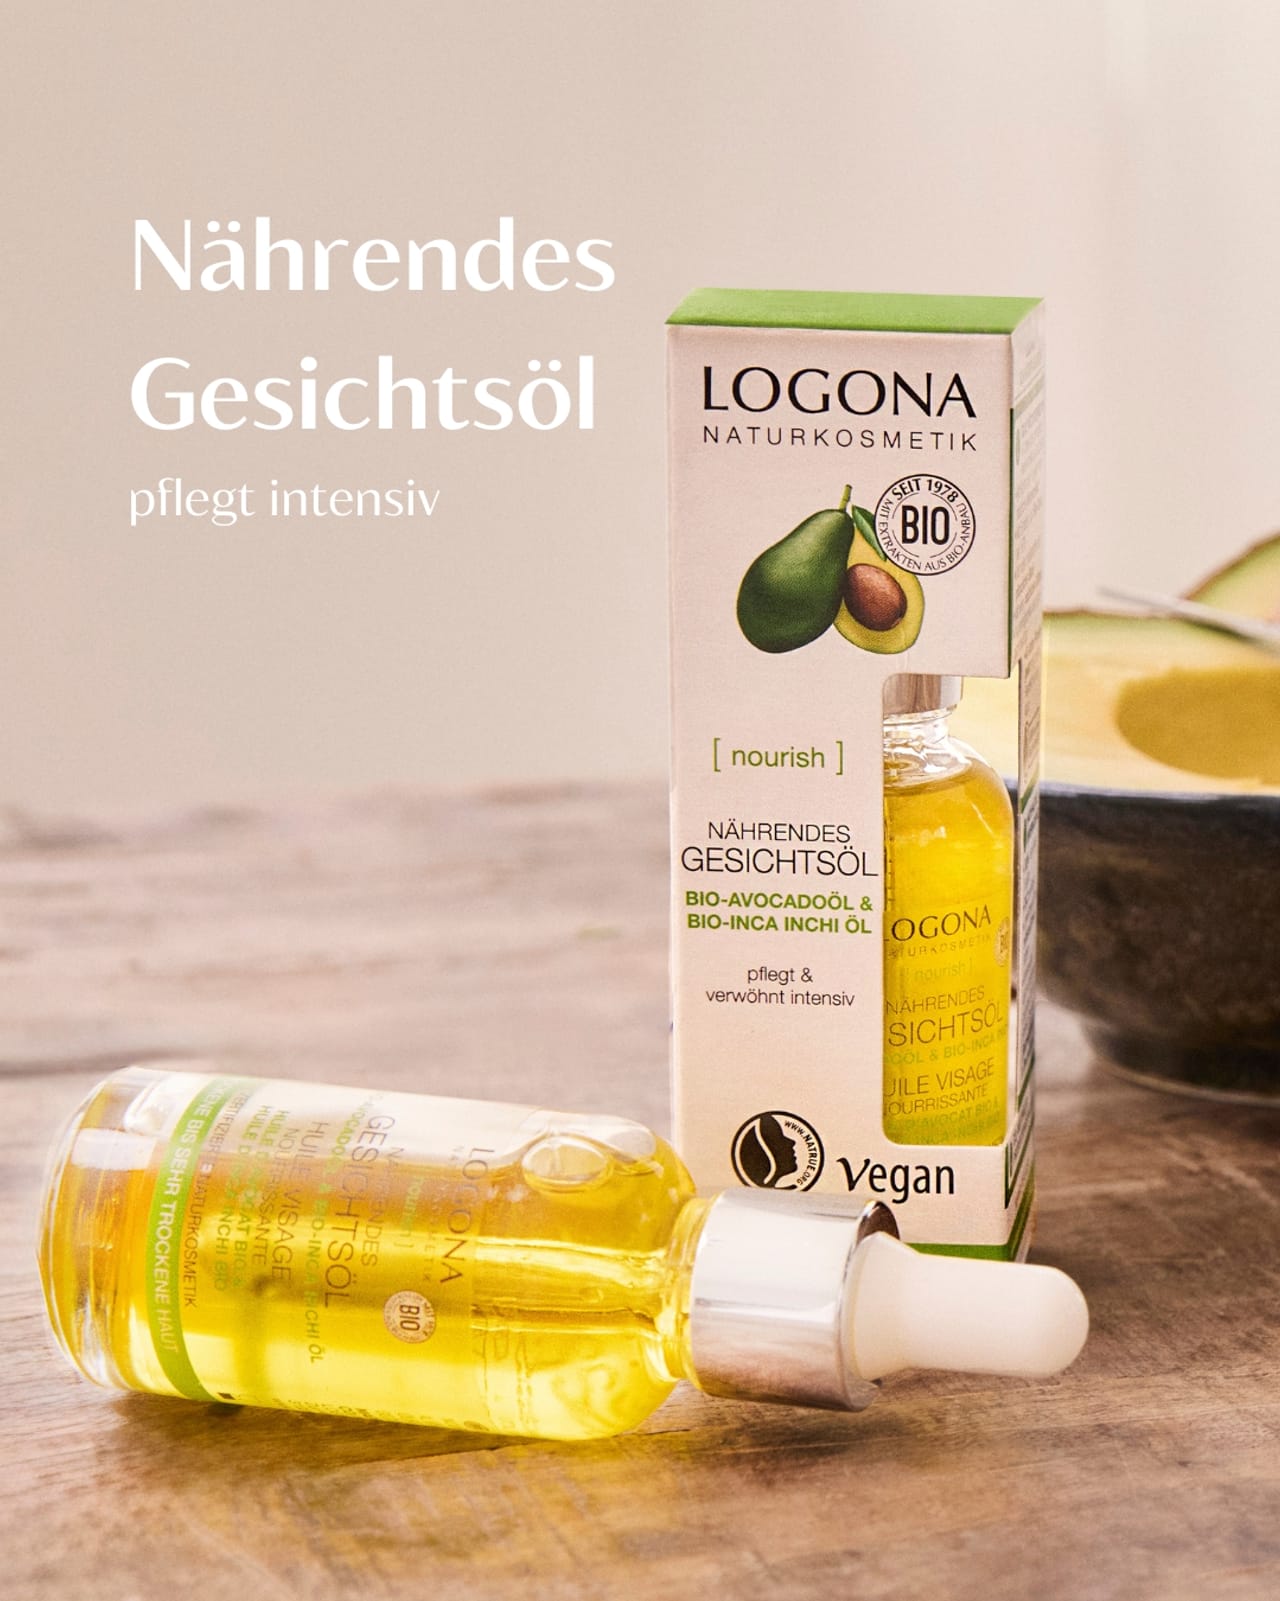
Mar 28, 2025
15K followers
Engagement Rate
1.234%
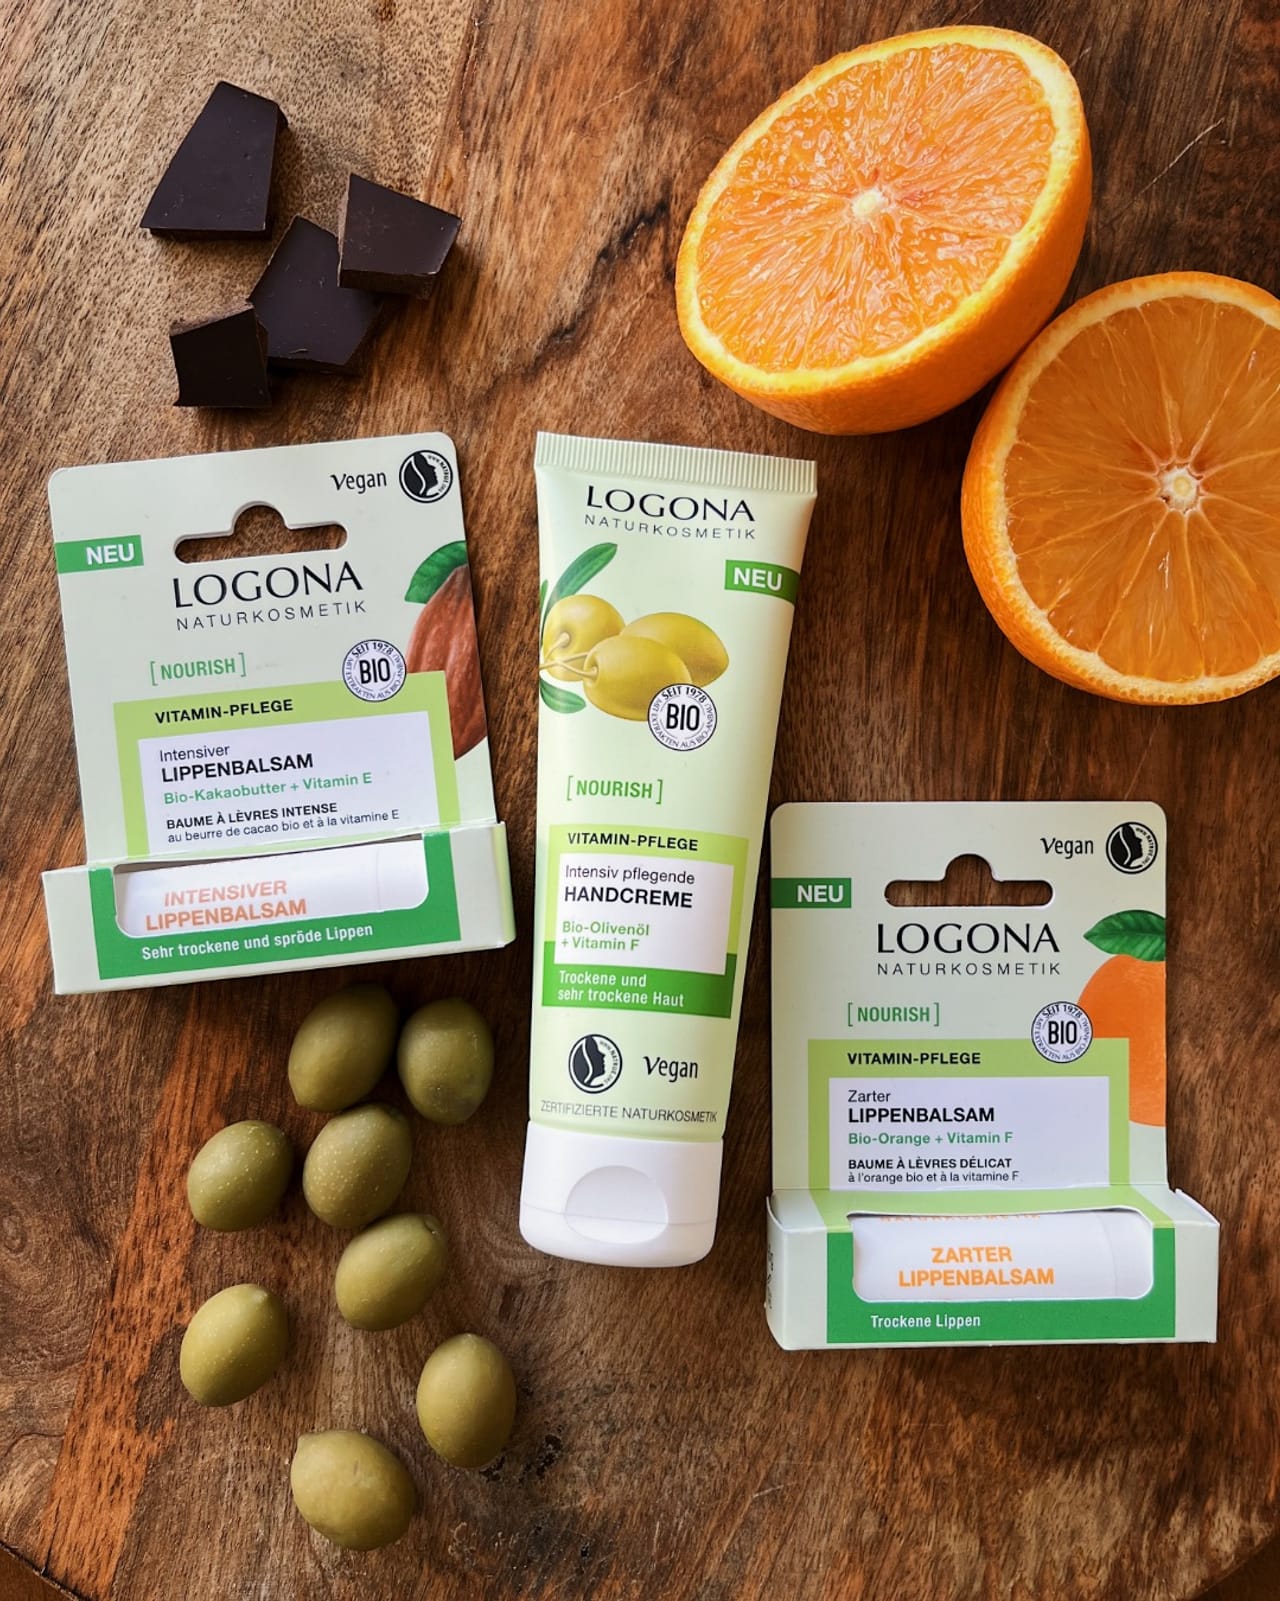
Logona Instagram

Apr 1, 2025
15K followers
Engagement Rate
1.195%
Logona Instagram
Mar 18, 2025
15K followers
Engagement Rate
1.123%
Brand Engagement Across Channels
Cross-channels analysis of the engagement
Brand Engagement Across Channels
| Channels | Engagement | Avg. Engagement |
|---|---|---|
| YouTube | 0 | 0 |
| Facebook | 38 | 7.6 |
| Instagram | 3011 | 66.91 |
| Average | 1016 | 24.84 |
Brand Video Views Across Channels
Cross-channels analysis of the engagement
Brand Video Views Across Channels
| Channels | Video Views | Avg. Video Views |
|---|---|---|
| YouTube | 0 | 0 |
| Facebook | 0 | 0 |
| Instagram | 48K | 3396 |
| Average | 16K | 1132 |
Similar Brands
Explore top-performing brands from the Beauty & Cosmetics Industry


Ready to improve your social media strategy with real-time insights
Get strategic insights, analyze the social performance across all channels, compare metrics from different periods and download reports in seconds.