TikTok analytics
with competitor
data built in
Compare your TikTok performance against any business profile. See historical data, content patterns, and posting behavior side by side so you know exactly where you stand.


Track any TikTok business profile from one dashboard
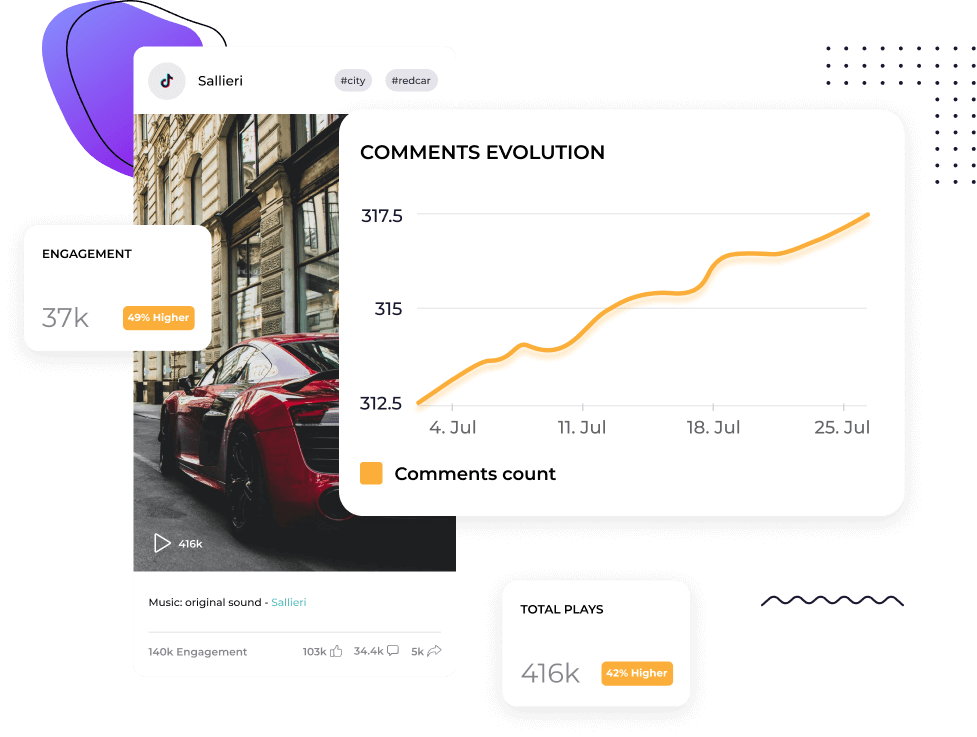
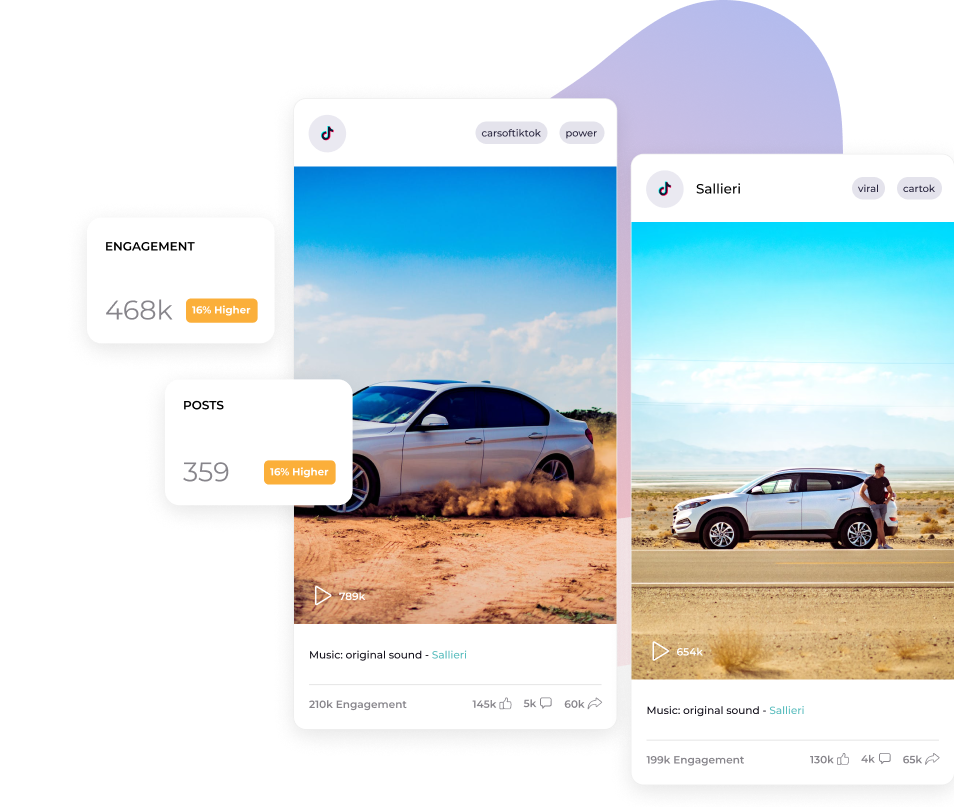
Socialinsider pulls engagement, follower growth, posting cadence, and top-performing content for every TikTok profile you add — yours and your competitors'. No need to manually export or check profiles one by one. Set it up once and the data stays current.
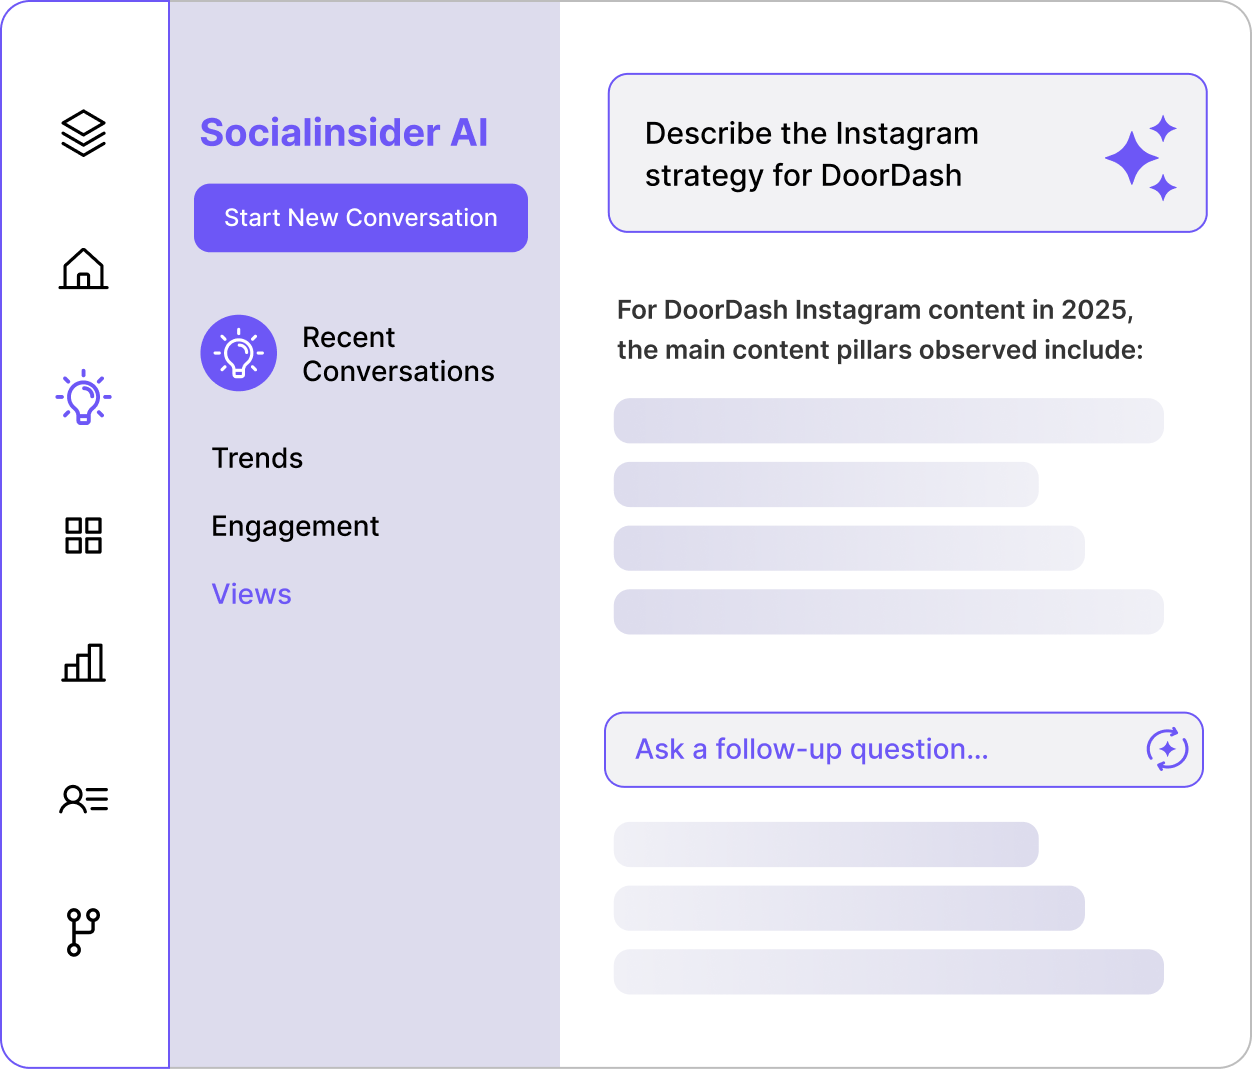
Ask your TikTok data a question and get a real answer
Socialinsider AI can answer any question about TikTok analytics data instantly. Ask something like: How do our recent TikToks compare to [competitor]'s top-performing content? and get back a written analysis of what happened, why it matters, and what to do next. It has all the context already.
See TikTok historical data and analytics
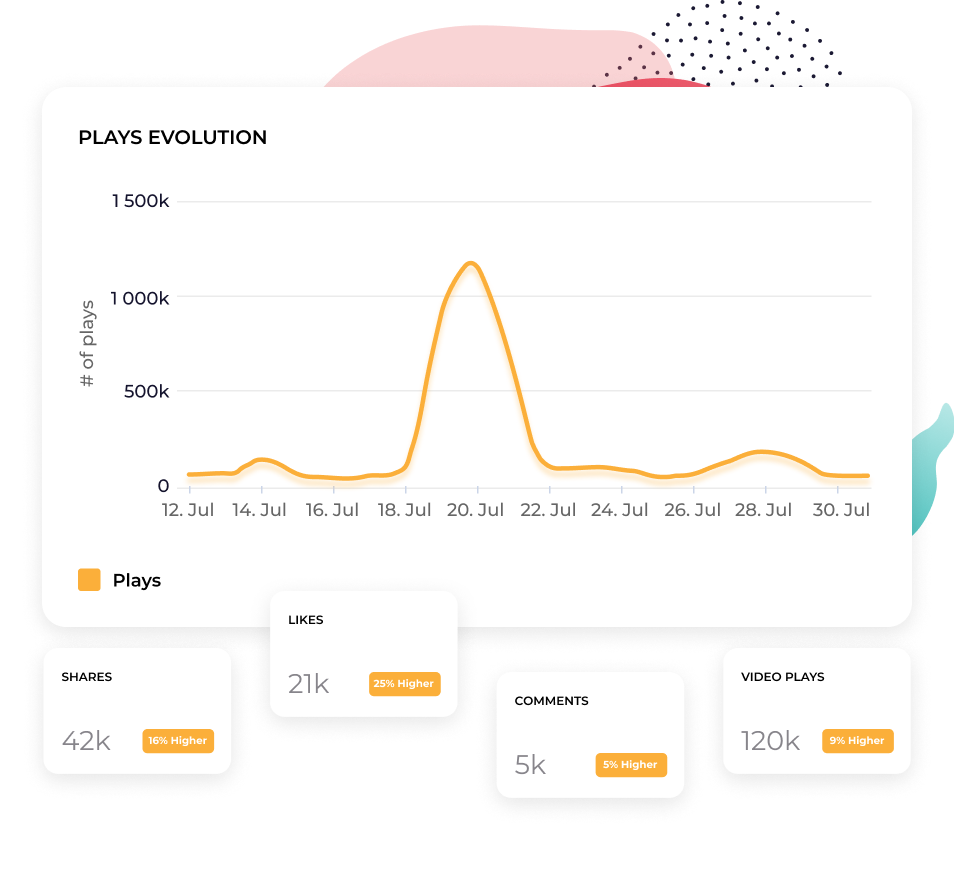
Track how TikTok metrics and content performance have shifted over weeks, months, or quarters. Spot drops before they become problems. Build a case for leadership with data that goes deeper than just last week.

"The competitor analysis helped in creating visibility on how we are performing in the market."

See what types of posts drive engagement in your space
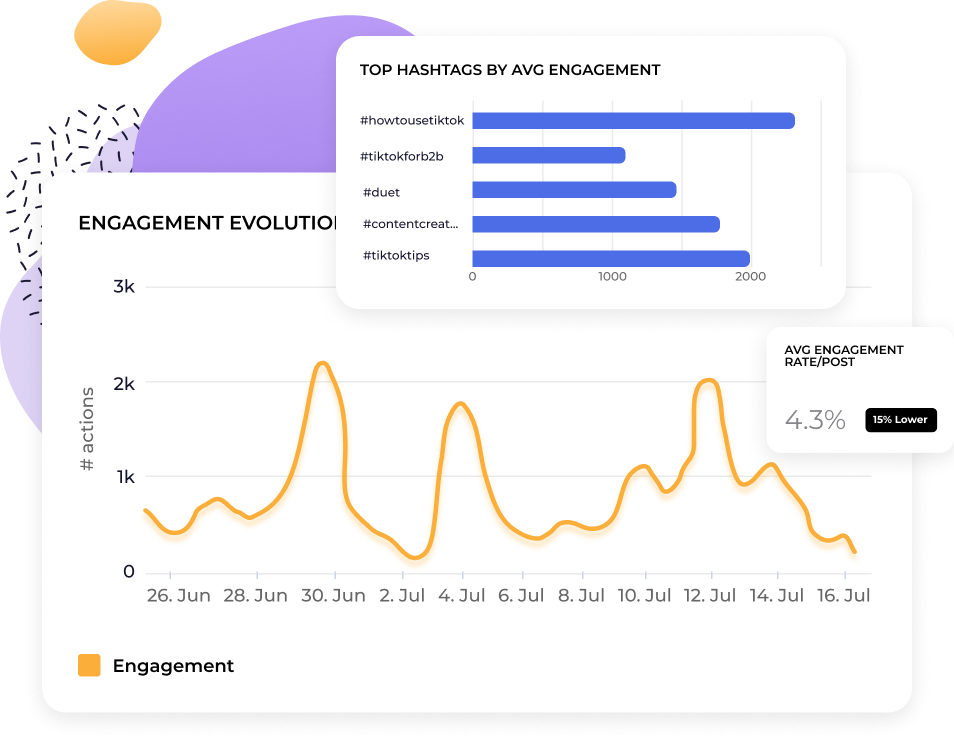
Socialinsider groups TikTok content into themes automatically using AI, or you can create your own categories and tag posts by keyword or topic. Either way, you see which content pillars are actually driving engagement for your competitors and across your industry, not just on your own profile.
What they say about us
"Customer service has been one of my favourite features as well. You guys are just phenomenal. Your team is so responsive and very friendly and helpful. Which is not the norm."

"Socialinsider helped us understand whether we're improving or decreasing especially compared to the other accounts that we follow."

"Socialinsider allows for a competitor analysis that gives an insight to performance relative to the market."

"The sentiment analysis is amazing for Instagram hashtags. This new social media listening dashboard helped me in long-term planning."

"We are using this social media analytics dashboard for all our 40 social media clients. We can have all the performance data in one single place."

"With Socialinsider, our team became more efficient. We do not need to spend time on social media data gathering. Instead, we can focus on insights and analysis."

"We use Socialinsider for day-to-day social media insights if we need to outline any simple strategic changes or review the performance of certain social posts."

"On average, a social media report for a brand requires 1 to 2 hours of work with Socialinsider, where it used to require a full day to gather the data."

"Socialinsider has saved us more than $16k per year. It has enabled us to save time on monthly reports and complex long-term analyses."

How to track TikTok engagement rate in Socialinsider
Sociainsider’s social media analytics, competitors analysis tools allow you to measure social media performance, run audits, and compare performance.
Start by creating a trial account to Socialinsider
Add your competitors and connect the profiles you manage
Get all the engagement metrics for any TikTok business account
Compare your performance against your top competitors
Perform a cross-channel analysis to evaluate your TikTok performance.

Get competitive insights and explore
social media analytics metrics
Frequently Asked Questions
Got a question? We've got answers.
What metrics should I track to measure the performance of my TikTok videos?
For conversions and brand growth, pay attention to profile visits, click-throughs on links, follower increases tied to specific videos, and any actions that align with your business objectives, such as site visits or product inquiries. To begin benchmarking your performance, start tracking these metrics over time to establish your own historical averages and identify trends. As you build your own baseline, expand your analysis by comparing your metrics with direct competitors and industry peers. Social media analytics tools like Socialinsider can help you benchmark your performance against other brands in your sector and region. This comprehensive approach allows you to identify which content strategies and formats drive the most impact and provides a clear path for continuous improvement.
How does TikTok count video views and engagement?
Engagement on TikTok includes actions like likes, comments, shares, and favorites, as well as profile visits and link clicks stemming from the video. These interactions are all tracked and summed to reflect total engagement. The engagement rate is typically calculated by dividing the total number of engagements by either total views or followers, then multiplying by 100 to get a percentage—giving you a sense of how actively your audience is responding relative to your reach.
What is a good engagement rate for TikTok videos?
Why are my TikTok analytics different from third-party analytics tools?
Differences in metric definitions are also common. For example, the way views, engagement rates, or particular types of interactions are counted and reported may vary between platforms. Privacy restrictions, account type limitations, and data access permissions can further impact what third-party tools are able to collect and display. If you’re seeing discrepancies in specific metrics or between certain videos, understanding the time frame, filters, and definitions each platform uses is helpful.
See how your TikTok engagement stacks up
Start a free trial and benchmark your TikTok performance against competitors in minutes.