What Are the Most Powerful Social Media Metrics to Track?
Discover 23 essential social media metrics, grouped into 7 categories, with how to analyze each one and combine them for real insights.

A report lands on your desk. Reach is up, engagement looks healthy, the summary reads like a win. Then you ask one follow-up question — how many of those people actually saved or shared it, or came back a second time — and the story gets a lot less clear.
That gap is exactly why social media metrics can't be judged one at a time, and why it's worth knowing not just what each number means, but which ones actually deserve a place in front of you versus which ones your team should be watching on your behalf. A high-performing post isn't always impactful. A post with fewer likes can quietly drive stronger intent and better results — and the difference only shows up once you know what you're looking at.
In this guide, I’ll break down 23 essential social media metrics, how to connect and analyze them, backed by insights from Melani De Guzman, social media manager at FreshDirect.
Key takeaways
-
In 2026, reading social media metrics well means tracking momentum and engagement depth over static totals, and always judging a number against a comparison point rather than in isolation.
-
The 23 key social media metrics fall into 7 categories — awareness, audience, engagement, content performance, video, competitor, and conversion — and the right ones to track depend on your specific goal, not on which are easiest to pull.
-
Socialinsider covers cross-channel analytics and benchmarking, Google Analytics connects social activity to on-site behavior, and Looker Studio turns scattered data into stakeholder-ready dashboards — most teams need at least two of the three, not just one.
How to look at social media metrics in 2026?
Social media metrics have changed. In 2026, it's no longer enough to report on likes, reach, and impressions as standalone numbers.
Don't get me wrong. Those metrics still matter. But only when viewed in context. What marketers really need to measure now is momentum and engagement depth.
Start measuring momentum
Static metrics are just snapshots. Momentum tells you whether content is actually gaining traction.
Instead of asking "How many likes did this post get?", marketers are now asking:
- How fast did engagement happen after publishing?
- Did reach accelerate within the first few hours or plateau immediately?
- Are saves and shares continuing to grow days later?
- Is the post creating compounding engagement over time?
Depth of engagement matters more than volume
Not all social engagement metrics carry the same weight anymore.
What matters most now:
- Saves
- Shares
- Comments with actual intent
- Profile visits
- DMs and conversation triggers
A post with 200 saves and meaningful discussion may be far more impactful than one with thousands of quick likes.
This is something Melani noticed while building the brand's social presence. Instead of relying on industry assumptions, her team focused on identifying patterns within their own performance data.
We noticed very early on that video, especially stories focused on New York-centric, local creator content, consistently outperform everything else. Videos always do well, so we truly prioritize videos.
Over time, their team refined the strategy by reviewing performance monthly, identifying recurring engagement patterns, and doubling down on formats that sustained audience interaction.
Metrics need a comparison point to mean anything
A 3% engagement rate could be excellent in one industry and average in another. Whether a specific number is good against your competitors or your industry is a benchmarking question rather than a definitional one — our competitive benchmarking guide covers exactly how to set that comparison point. What matters here is simply knowing that a raw number, on its own, tells you less than the same number placed next to your own history or a relevant benchmark.
Top social media metrics you need to track
According to our recent Socialinsider survey, which included over 140 social media marketers, the top three metrics measured came out to be engagement, reach, and follower growth.
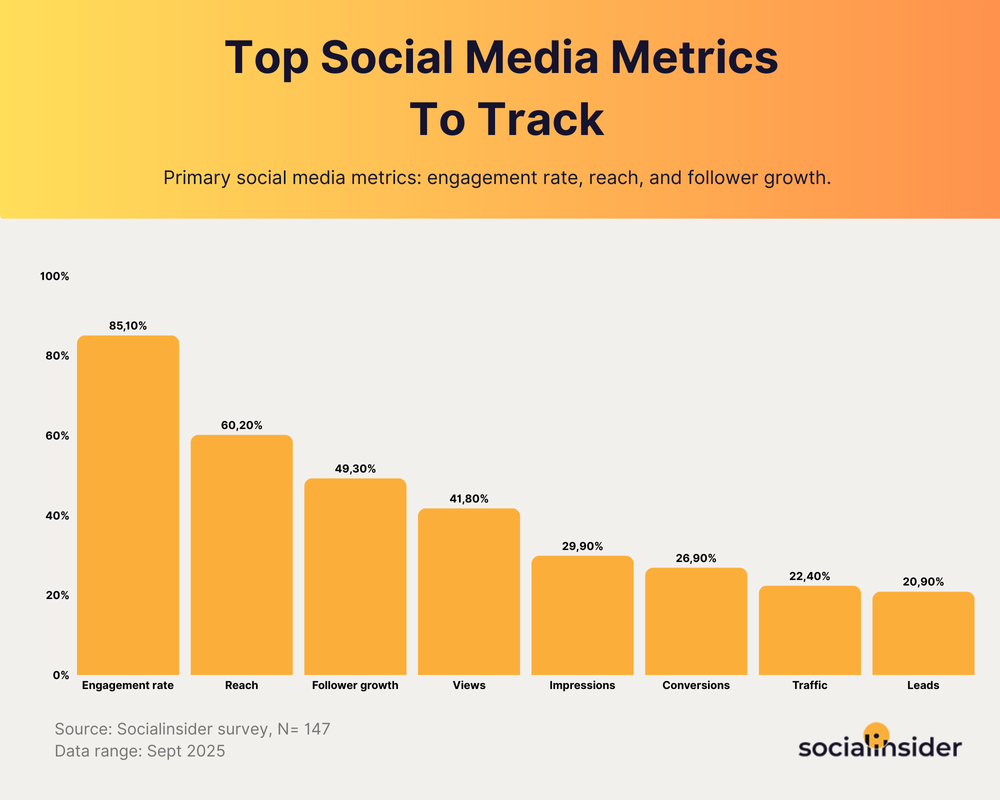
While these three are the top social media marketing metrics every marketer measures, you also need to include those that align specifically with your business goals.
To make this easier, I've grouped the key metrics for social media into seven categories, allowing you to select the ones that matter most to your business.
Not all 23 need your personal attention every week. As a rough split: awareness and conversion metrics (reach, follower growth, conversion rate, revenue-adjacent numbers) are the ones worth seeing yourself on a recurring basis, since they map most directly to business outcomes you're accountable for.
Engagement, video, and content-format metrics — the post-by-post detail like watch time, completion rate, or individual content pillar performance — are usually better delegated to whoever owns content, with you reviewing the pattern they surface rather than the raw numbers themselves.
Competitor metrics sit in between: worth a personal glance quarterly, but not something that needs daily monitoring unless you're mid-campaign against a specific rival.
Awareness metrics
Awareness metrics show how many people are discovering your brand and how visible your content really is.
They help you understand your overall reach, how far your message is spreading, and whether you're consistently getting in front of the right audience.
Melani uses it to see how far her posts are reaching people beyond their followers. In her words:
If you're experimenting with different content pillars or different topics, then I think you will be prioritizing reach to see if it is landing well with a wider audience. We'll see if it's landing well. Is it reaching outside of our followers and that creator's followers? Is it getting people interested in learning more? Is it getting them to follow the brand, message us? Those are important.
1. Reach
Reach shows how many unique people saw your content. It is your visibility meter. Higher reach means more eyes on your posts and a greater chance for your message to land.
One of our customers put it perfectly: "When I'm new and need visible wins fast, reach helps me show our brand's growing footprint."
How to analyze reach:
- Watch for steady, upward movement over time since that signals healthy visibility.
- Consistent reach usually means the algorithm is backing your content and your topics are landing well.
- Notice any sudden dips, as they often indicate weak timing, low relevance, or content that needs refreshing. I use Socialinsider's anomaly analysis for this. I just click on the dips on the graph, and I can see the content that led to it.
2. Impressions
Impressions show how many times your content was viewed in total. Every view counts, even if the same person sees your post multiple times.
This metric helps you understand how often your content is being surfaced and how present your brand is in someone's feed.
How to analyze impressions:
- Good impressions come from strong relevance, high posting consistency, and content that stays visible longer. Look for patterns where impressions rise steadily across posts. That usually means the algorithm keeps pushing your content forward.
- Very low impressions can signal weak hooks, poor timing, or content that gets skipped too quickly.
Audience metrics
Audience metrics show who your viewers and followers actually are and how their behavior shifts over time.
These social media marketing metrics help you understand whether you're attracting the right people and whether your audience is growing, staying engaged, or quietly slipping away.
3. Follower growth rate
Follower growth rate shows how quickly your audience is expanding.
It measures the percentage increase in followers over a specific time period, giving you a clearer view of momentum than raw follower counts.
How to analyze follower growth rate:
- Start by tracking growth week over week or month over month to spot clear trends. I use Socialinsider to see this trend.

- A good rate depends on your industry and platform, but steady upward movement signals healthy audience interest.
- Look for growth spikes right after high-performing content or campaigns. Those usually confirm that you posted something that resonated.
- Watch for plateaus or dips. These can suggest content fatigue, irregular posting, or targeting that misses the mark.
- You can even analyze your historical follower growth over a period of 2 or 3 years, depending on your plan in Socialinsider.
4. Demographics
Demographics show the makeup of your audience. You get insights into age groups, gender distribution, locations, and sometimes languages.
I use this metric to help understand who I am actually reaching and whether my audience matches the people I want to attract.
How to analyze audience demographics:
- Start by comparing your demographic breakdown with your ideal customer profile. Alignment signals you are reaching the right people.
- Look for shifts over time. A sudden change in age group or location may hint at new content themes pulling in fresh segments.
- Check whether your top demographic is the one engaging most often. If they match, your messaging is landing well.
- Watch for large gaps. If certain age groups or locations underperform, you may need targeted posts to reach them.
5. Audience sentiment
Audience sentiment shows how people feel when they talk about your brand. It classifies conversations and reactions into positive, neutral, or negative tones.
This metric helps you understand emotional response and brand perception.
How to analyze audience sentiment:
- Start by tracking the ratio of positive, neutral, and negative mentions over time. A healthy sentiment trend leans positive with minimal volatility.
- Look at context, not just volume. A few strong negative comments can outweigh dozens of neutral mentions.
- Watch for sudden shifts in tone. Sharp rises in negative sentiment often signal product issues, confusing messaging, or misaligned content.
- Analyze sentiment after major posts or launches. Strong positive sentiment confirms that your messaging is landing well.
Engagement metrics
Social media engagement metrics show how actively people interact with your content. They reveal whether your posts spark interest, conversation, or action.
In many of our customer interviews, engagement metrics consistently surfaced as the fastest path to credibility as they combine emotional proof ('people care') with functional proof ('it's working').
6. Engagement rate by followers
Engagement rate by followers measures how many of your followers actively interact with your content.
It tells you how involved your existing audience is and how well your posts hit the mark for the people who already chose to follow you.
I also like how this metric provides a fair basis for comparing engagement with competitors, regardless of the difference in followers.
For Melani at FreshDirect, this metric matters most when evaluating content created internally by the brand.
When we post in-house, there's no creator, no partner, no collab involved. It's just our content. I'm looking at the engagement rate by followers because we're seeing which ones of our followers resonated with this.
How to analyze engagement rate by followers:
- Start by comparing your engagement rate against your industry average. Stronger performance shows your content is resonating.
- Track how your rate moves over time. I take consistent growth to be a signal of a healthy, connected audience.
- Watch how different content types perform. Some formats naturally get higher engagement, which helps you refine your mix.
- A good engagement rate by followers is one that stays stable even as your follower count grows. When followers rise and engagement stays high, your content strategy is working.
7. Engagement rate by reach
Engagement rate by reach shows what percentage of people who actually saw your post decided to interact with it.
This metric helps you understand how compelling your content is for viewers, not just followers.
Melani uses this metric primarily for collaboration posts and creator partnerships, where the goal is to maximize visibility beyond FreshDirect's existing audience.
When it's a collab post, when it involves other people, I switch to reach-based engagement because the reach is always going to be higher. We're potentially reaching people who've never heard of us.
How to analyze engagement rate by reach:
- Look for stability as reach increases. A good engagement rate by reach stays steady even when new, unfamiliar viewers enter the mix.
- A good engagement rate by reach varies by platform, but anything consistently above your account baseline signals solid social media performance.

8. Likes and reactions
Likes and reactions measure how many people tapped a quick signal of approval on your post. They show instant interest and are often the first indicator that your content resonates at a basic level.
How to analyze likes and reactions:
- Start by comparing likes and reactions to your average performance. Higher numbers signal strong initial resonance.
- Track which types of posts consistently gather more reactions. These patterns point to topics and formats your audience prefers.
- Pay attention to low-performing posts. Drops may indicate weak visuals, unclear messaging, or topics that did not connect.
9. Comments, shares, and saves
Comments, shares, and saves represent deeper layers of engagement. Comments show conversation. Shares show your content has enough value to be distributed. Saves show long-term usefulness.
Melani talked about how she looked at and analyzed comments after hosting an in-person event for creators, media, and food tastemakers in New York City. While the recap Reel didn't necessarily become a massive viral hit, the comment section became the strongest success signal.
As she explains:
The comments were extremely positive. People were sharing that they had a great time, that the tour was a hit, learning about other brands. Even if the video didn't hit huge likes or reach, the comments were so strong that it told us what we're doing works. This is how people grow respect for the brand — by feeling welcome and included. And it shows in the comments and the stories people posted about us.
How to analyze comments, shares, and saves:
- Look at the quality of interactions. Thoughtful comments, repeat shares, and consistent saves signal real content value.
- Track patterns. I have generally seen educational posts earn saves, relatable posts drive shares, and bold or opinion-based posts bring comments.
- Watch for drops. Low activity across all three usually means the post lacked depth, clarity, or emotional pull.
10. UGC mentions
UGC mentions track how often people create content that includes your brand. This can be tags, mentions, captions, or posts that feature your product.
It shows that people love your brand or product so much that they are willing to create content around it.
How to analyze UGC mentions:
- Start by monitoring how frequently your brand gets mentioned across platforms. Steady growth signals rising brand love.
- Look at who is mentioning you. Mentions from loyal customers or niche communities often carry stronger influence.
- Evaluate the relevance and authenticity of each piece. Honest experiences and real use cases perform better than staged content.
- Spot spikes and dips. Spikes usually come from campaigns, good news, or product excitement. Dips may hint at reduced momentum.
Content performance metrics
How did my last posts perform on Instagram? Did my audience accept the new content pillar I introduced last week?
These social media content performance metrics help answer these questions and more, and a quick engagement metrics analysis usually surfaces the answer faster than scrolling through the feed manually.
11. Content pillar engagement
Content pillars engagement measures how well each of your core themes performs.
This is especially helpful if you work on different pillars or are experimenting with new ones, such as humour and employee-featured content.
Melani talks about how she finalizes content pillars for FreshDirect:
When we do our monthly strategy, we look at which content pillars are working really well organically. Showcasing our plant and different departments like seafood or produce does really well because people want to see stories internal to the company — that's not always on Instagram. We also see really fun man-on-the-street formats perform really well, where we ask people about food opinions or preferences. Anything that creates fun dialogue around food is really important for us.
How to analyze content pillar engagement:
- Begin by comparing engagement across each content pillar to see which themes naturally pull more interest. To get this data instead of manual sorting, which takes hours of time, I rely on Socialinsider's AI-based industry content pillars.

I can even manually create pillars for special campaigns with the Query Builder feature of Socialinsider to measure social media campaign performance.

- Look at the depth of engagement. Saves, shares, and comments reveal pillars that drive real value, not just quick reactions.
- Watch for pillars that underperform repeatedly. This typically indicates weak relevance or a content approach that requires reevaluation. Make plans to optimize or revamp how you approach that pillar.
12. Content format performance
Working on Reels, carousels, and static images? Which is landing better with your audience?
Content format performance measures how well different creative formats perform across your social channels.
How to analyze content format performance:
- Start by comparing engagement across all formats to identify clear winners and weak performers.
- Track consistency. A high-performing format should deliver strong results across multiple posts, not just one viral outlier.
- Look at the intent behind each format. While educational formats may not bring in a lot of likes, they may drive saves.
- Watch for patterns tied to platform behaviour. Some formats naturally perform better on specific platforms, which can guide distribution.
Video performance metrics
Video performance metrics show how effectively your videos capture attention and keep viewers watching.
They help you understand whether your hooks work, your pacing holds interest, and your content delivers enough value for viewers to stay or take action.
Melani talked about how she prioritizes different social media metrics to track for different platforms. Let's look at them below.
13. Video views
Video views show how many times your video was watched.
It shows how well your content captures attention in the first few seconds and whether your hook is strong enough to stop the scroll.
How to analyze video views:
- Start by comparing view counts across your videos to identify which hooks and formats attract the most watchers.
- Track how quickly views accumulate. Fast early growth signals a strong opening, good timing, or high relevance.
- Look for consistency. Videos that repeatedly earn solid view counts show a working formula.
- Watch for sharp drops. Low views often point to weak thumbnails, poor hooks, or misaligned topics.
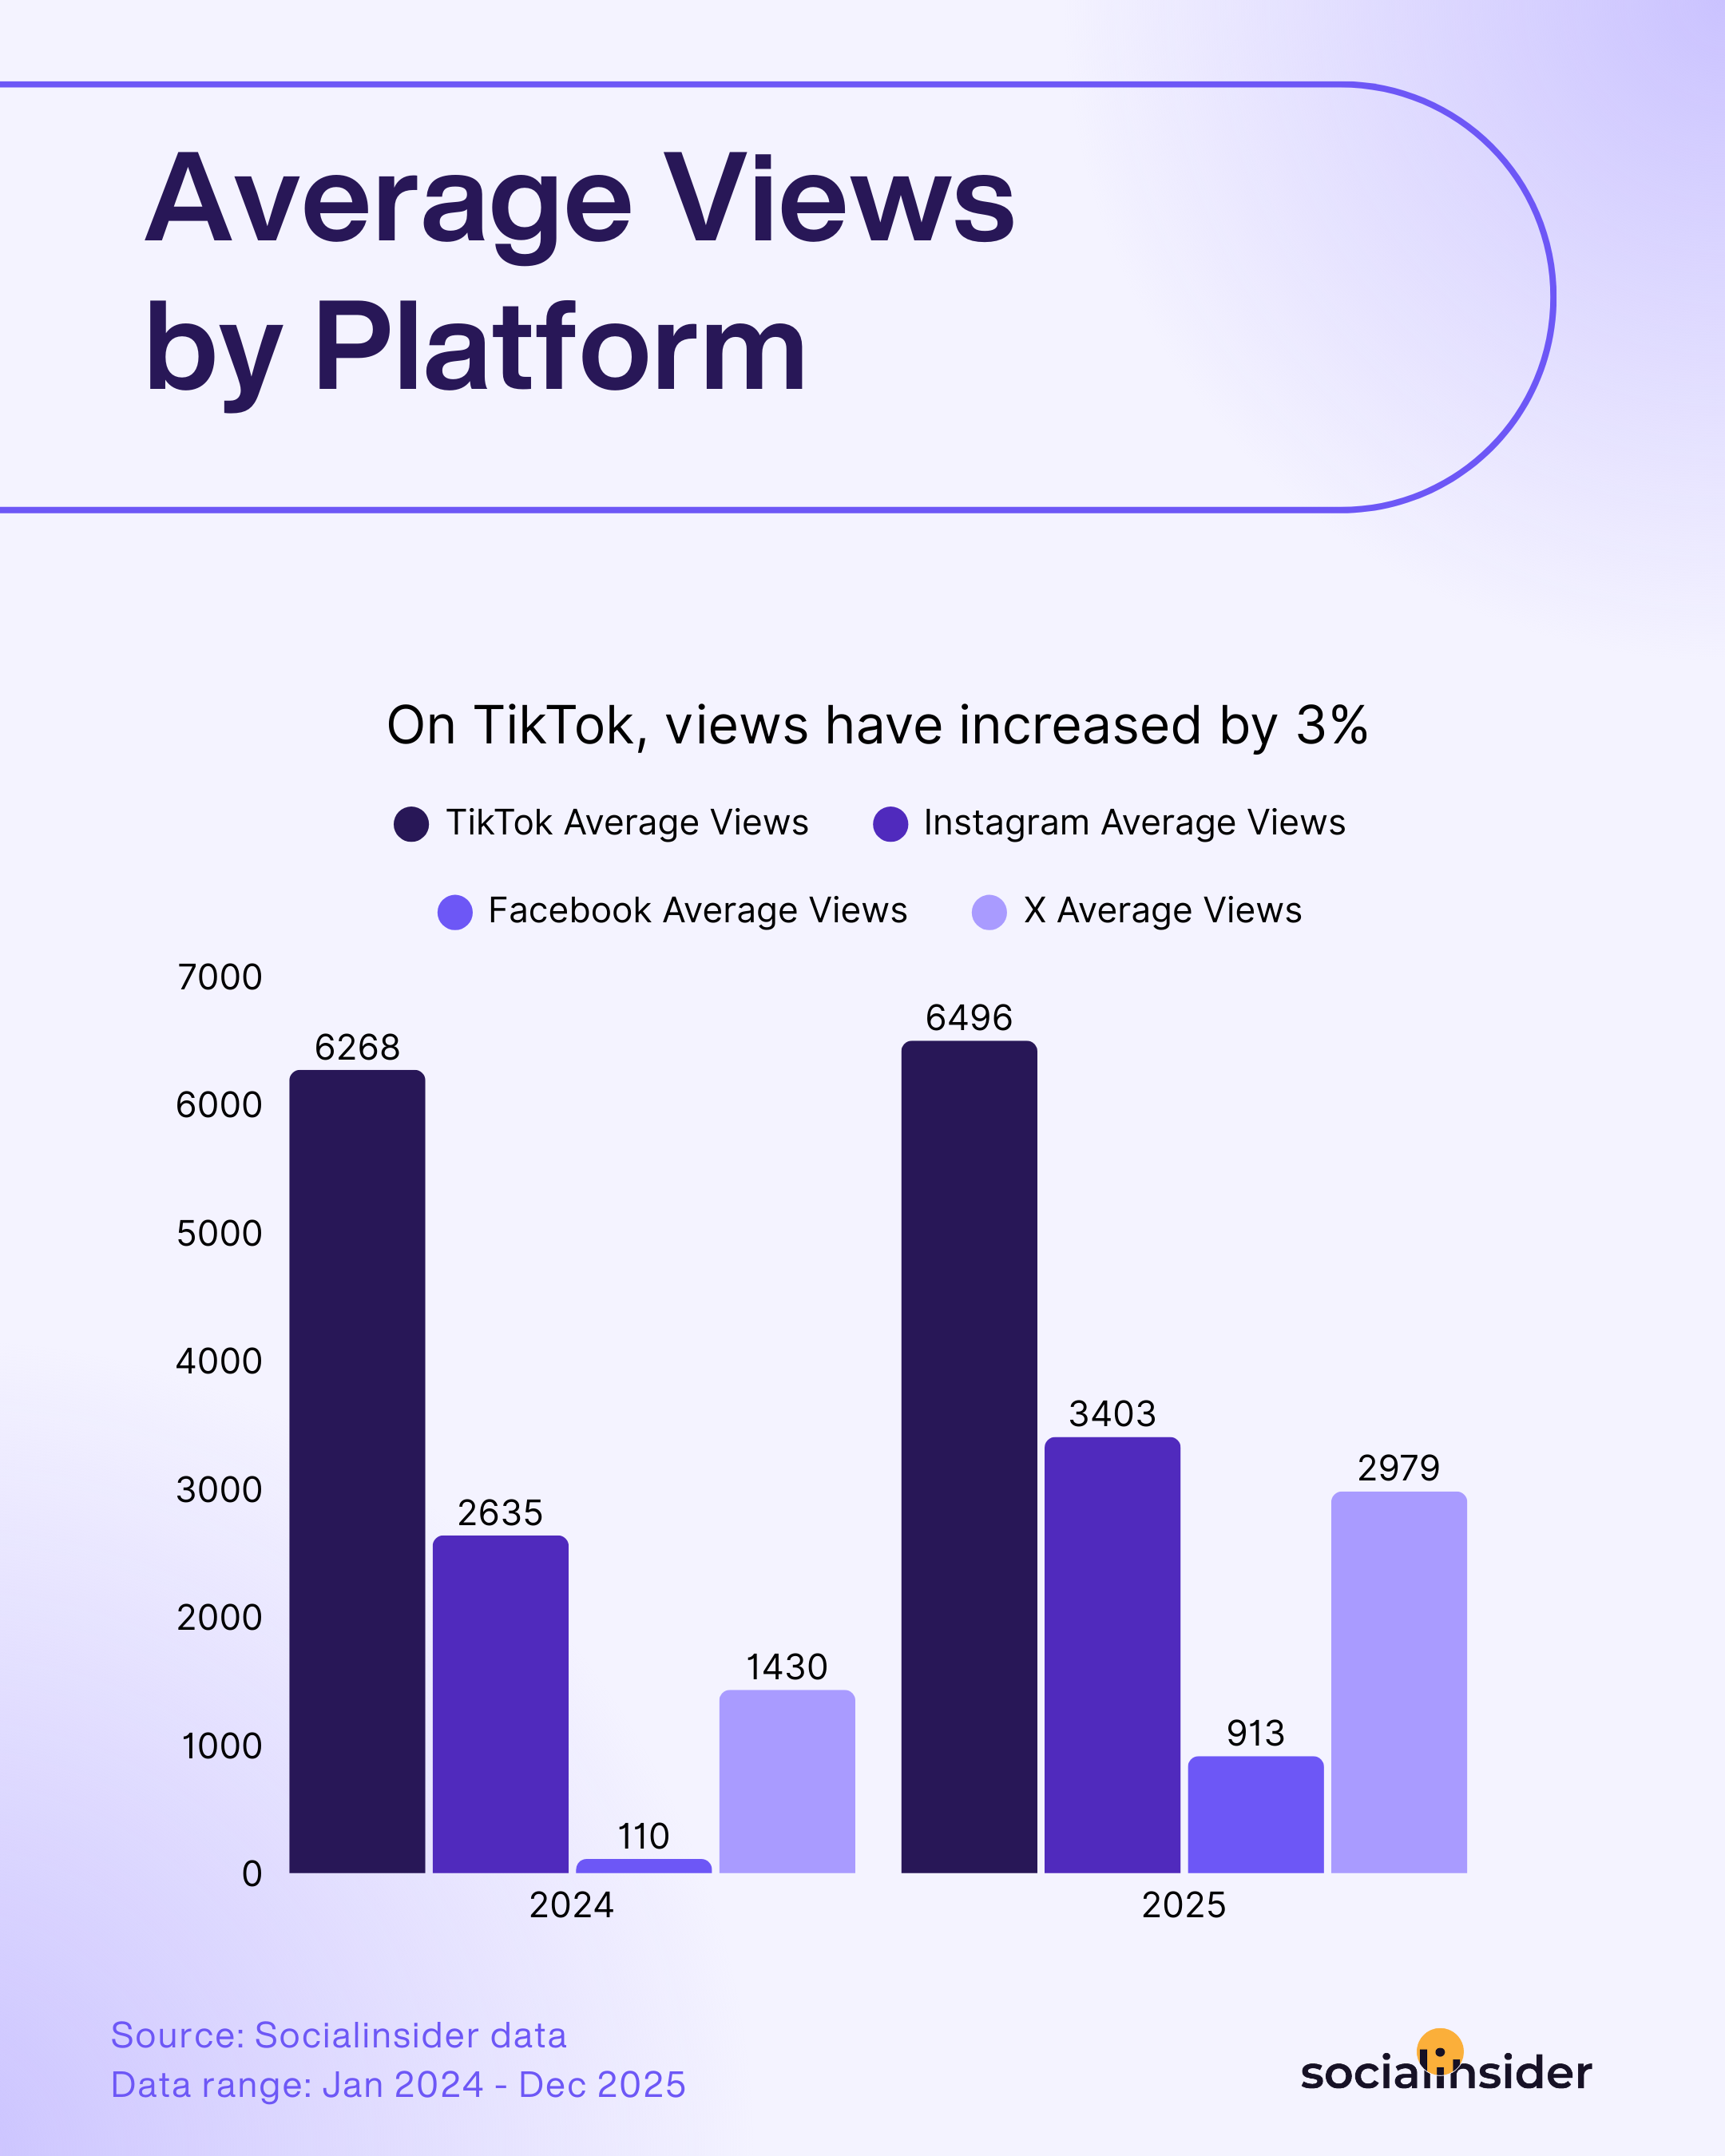
To make sure you're on the right track, comparing your performance to industry standards is helpful, because it puts your own data into context. Socialinsider's social media benchmarks reports break down view counts and other core metrics by platform and industry, giving you that reference point.
14. Video completion rate
Video completion rate shows the percentage of viewers who watched your video from start to finish.
It's one of my favorite video metrics as it shows me how well my pacing, structure, and message hold attention.
Melani prioritizes this metric especially for YouTube:
Prioritizing completion rate on YouTube is very, very important because majority of the people on the platform are really excited about long form, right? They're there to really watch something long. So when it comes to them watching a short and finishing it, that means they find it fascinating. That means they're really engaging with it and learning from it.
How to analyze video completion rate:
- Begin by comparing completion rates across your videos to see which formats and story flows keep people watching.
- I also look at where viewers tend to drop off. Early drop-offs usually point to weak hooks, unclear openings, or slow intros.
- Track stability over time. A strong video theme or style often delivers consistently high completion rates.
15. Watch time
Watch time measures the total amount of time viewers spend watching your video.
It shows how effectively your content holds attention beyond the first few seconds.
On TikTok, Melani focuses heavily on watch time because it reveals where audience attention starts fading.
For TikTok, it's the watch time — figuring out where people drop off. In this one-minute or two-minute video, where did people get bored? How can you as a storyteller improve your art?

For TikTok especially, drop-off points become creative feedback.
How to analyze watch time:
- Start by comparing watch time across videos to see which topics and formats keep people watching longer. For example, you may notice that videos featuring people tend to be watched more.
- Look at how watch time aligns with video length. Longer videos should deliver proportionally higher watch time to be considered successful.
- If you want to check if your watch time is good, see if it's climbing steadily and remains above your baseline relative to video length and platform norms.
16. Average percentage viewed
Average percentage viewed shows how much of your video people actually watch on average.
While watch time measures total minutes consumed, this metric tells you how far viewers make it through your video. It gives cleaner insight into retention because it removes the influence of video length and focuses purely on viewing progress.
How to analyze average percentage viewed:
- Compare average percentage viewed across your videos to see which ones keep viewers watching the longest.
- Track recurring patterns. Videos that consistently retain a high percentage show strong pacing and relevance.
17. Retention rate
Retention rate measures how effectively your content holds attention throughout the video.
Unlike views or reach, retention reveals whether people stayed engaged or quickly lost interest after clicking. It's one of the strongest indicators of content quality because it reflects pacing, storytelling strength, and how valuable viewers found the content overall.
For Instagram, Melani prioritizes retention because the platform has become heavily discovery-driven and visually competitive.
Instagram is such a high discovery tool now. There's so many aesthetic things on the app, people want to keep scrolling. So when someone stays on one video and watches it all the way through, that means they found value in it.
How to analyze retention rate:
- Compare retention rates across different content formats, hooks, and video lengths to identify what keeps viewers engaged longest.
- Look for consistent drop-off points to understand where audience attention starts declining.
- Analyze which topics or storytelling styles maintain stronger retention over time.
- Use retention trends to improve pacing, editing, and content structure in future videos.
Competitor metrics
Ever wondered how your social performance stacks up against others in your industry?
Competitor metrics show where you lead, where you lag, and what strategies competitors use to capture attention. This category is defined here at the metric level only — for the full workflow of setting up competitor tracking and benchmarking, see how to do a competitive analysis on social media and competitive benchmarking.
18. Share of Voice
Share of Voice (SOV) shows how much of the overall industry conversation your brand owns compared to competitors.
It highlights how visible you are in your niche and where you stand in the competitive ranking.
How to analyze Share of Voice:
- Track how your SOV moves over time. Rising SOV signals growing influence or improved content performance.
- Examine the platforms on which you win and those on which your competitors dominate. This helps you decide where to focus your effort.
- Watch for dips. A sudden drop in SOV often means competitors have launched campaigns or increased content output.
19. Competitor growth
Competitor growth tracks how quickly your competitors gain followers, engagement, or visibility over time.
It highlights their momentum and helps you understand whether they are expanding faster than you.
How to analyze competitor growth:
- Compare competitor growth rates with your own to see who is accelerating.
- Look at spikes in their growth. These often link to campaigns, viral posts, or new content formats.
- Track the consistency of their growth. Steady increases usually signal a strong social media strategy rather than luck.
- Watch for slowdowns or plateaus. These can hint at content fatigue or shifting audience interest.
I also like to check qualitative competitor insights — the tone and style competitors use for their Reels, for instance — to guide my own content strategy.
Conversion metrics
Social media conversion metrics show how effectively your social content turns viewers into action takers.
They help you understand whether your posts or even paid media drive meaningful outcomes like clicks, sign-ups, or purchases. For the full ROI and business-case methodology built on top of these numbers — attribution, CLV, whether social marketing is genuinely cost-effective — see how effective is social media marketing.
20. Conversion rate
Conversion rate measures the percentage of people who took a desired action after viewing your content.
This could be clicking a link, signing up, downloading something, or making a purchase.
How to analyze conversion rate:
- Begin by comparing conversion rates across posts and ads to see which messages, visuals, or CTAs drive action.
- Look at where conversions come from. Certain platforms or formats often convert better than others.
21. Click-through rate
Click-through rate (CTR) measures the percentage of people who clicked on your link after seeing your post or ad.
A strong CTR signals that your message and CTA work together smoothly.
How to analyze CTR:
- Compare CTR across posts to identify which hooks, captions, and visuals drive the most interest.
- Track how CTR shifts with different CTAs. I also like to test different styles of CTAs to figure out what my audience likes the best.
- Look at CTR by platform. Some platforms naturally generate more clicks based on user behavior.
22. Wbsite traffic form social
Website traffic from social measures how many visitors arrive on your site from social media.
I track this often when I am running a campaign or content series to bring people to my website or online store.
How to analyze an increase in website traffic:
- Compare traffic spikes with the posts you published to see which ones drive the most visits.
- Look at traffic quality. Time on site and pages per session reveal whether visitors found value after clicking.
- Track platform differences. Some channels send high volumes, while others send fewer but more qualified visitors.
23. Return on ad spend
Return on Ad Spend (ROAS) shows how much revenue you generate for every dollar spent on ads, at the individual metric level.
How to read ROAS at a glance:
- Look at ROAS by platform. Some channels drive cheaper clicks but weaker conversions, which lowers overall return.
- A good ROAS is one that remains above break-even and outperforms your past campaigns.
For the deeper question of whether that return actually makes social media marketing worth the investment — including attribution models and Customer Lifetime Value — that's covered in full in our effectiveness guide.
Which tools to use to track social media metrics?
Native analytics can provide information on certain metrics. To get more detailed, automated social media metrics and analytics, I use these three tools — useful to know whether you're the one pulling this data daily or deciding what the team should have access to. Between the three, they cover most of what people mean when they ask about the best social media metrics software: cross-platform analytics, on-site behavior, and visual reporting.
Socialinsider
A core strength of Socialinsider is its cross-channel analysis capability — instead of checking Instagram Insights, then TikTok's dashboard, then LinkedIn Analytics separately, you get engagement trends, follower growth, and more.

And beyond that, I like how the cross-channel view extends into benchmarking and content analysis. Instead of looking at isolated metrics per platform, you can compare performance against competitors and identify patterns across post types, formats, and campaigns, all in the same place. The AI-powered insights also help surface trends faster.
Google Analytics
I use Google Analytics to understand what happens after someone clicks from social media to a website. Social platforms can tell you about engagement and reach, but Google Analytics helps connect those metrics to actual business outcomes like conversions, purchases, sign-ups, and revenue.
The most useful part is being able to track traffic sources and user behavior. You can see which platforms drive the highest-quality traffic, which campaigns convert best, and where users drop off in the funnel.
If social media is tied to lead generation, ecommerce, or website growth, Google Analytics becomes essential for measuring ROI instead of just visibility.
Looker Studio
I use Google Looker Studio when I need to turn scattered data into clear, visual reports. Instead of manually updating spreadsheets every week, you can build dashboards that automatically pull data from platforms like Google Analytics, YouTube, Meta, and other marketing tools.
What makes it especially powerful is customization. You can create executive-level reports, campaign dashboards, competitor tracking views, or platform-specific performance summaries tailored to different stakeholders.
It's particularly useful for combining metrics into one place — like pairing social engagement data with website conversions or revenue metrics — so you can analyze the full customer journey instead of isolated numbers.
If you're evaluating whether this stack actually covers what your team needs rather than using it day to day yourself, the test is simple: can these three tools answer a specific question about any of the 23 metrics above without someone manually exporting and stitching data together first? If the answer is no—or dashboards frequently fail with errors like 'Looker Studio cannot connect to your data set' because of broken data connections—that's a tooling problem worth fixing, not something to solve by asking the team to work around it.
Final thoughts
Understanding what each number is trying to say is what turns a dashboard from noise into a clear next step — don't optimize for vanity metrics, and don't judge any single number without a comparison point. For turning these definitions into an actual measurement habit, our evaluation, success, and KPIs guides cover that step by step.
If you want all of this without wrestling with spreadsheets, Socialinsider brings every metric and insight together for you. Opt for a free trial to make metric monitoring and calculation easier.
FAQs on social media metrics
What are the most important social media metrics to track?
It depends on your goal, but engagement rate, reach, and follower growth consistently come up as the top three across marketers we've surveyed. Beyond those, the most important metrics are the ones tied directly to whatever outcome you're accountable for — awareness, engagement, or conversion.
What's the difference between a metric and a KPI?
A metric is any measurable data point — there are dozens across platforms. A KPI is the small handful of metrics tied directly to a specific goal, used to judge whether your strategy is actually working. Every KPI is a metric, but not every metric deserves to be a KPI.
How often should I check my social media metrics?
Weekly for a quick pulse check, monthly for spotting real trends, and quarterly for anything benchmark-related, like comparing against competitors or industry averages. Checking daily rarely reveals anything a weekly review wouldn't.

Nidhi Parikh
Having worked with several brands in the social media space, Nidhi writes about all things social. With 13K followers on LinkedIn, she's always up for a chat about books or her next travel plan

Know what your competitors do — before your manager asks
Get instant social benchmarks & reports without manual work.