2026 Instagram Organic Benchmarks
Discover the latest Instagram engagement benchmarks to add context to your data when reporting. Get effective insights and expert tips.

No two social media strategies look exactly alike, but every marketer faces the same questions: Are we posting enough?
Are our results actually in line with what’s happening across the industry—or are we falling behind?
That’s why we put together this fresh look at Instagram’s benchmarks across metrics such as engagement rate, comments, saves, views, follower growth rate, and posting frequency.
With insights coming from the analysis of 35M Instagram posts and data coming from worldwide brands from different sizes, you can consider this research your personal Instagram optimization guide.
2025 marks a reset for Instagram organic performance — success now depends on strategic format choices and content quality, not volume or scale.
Executive summary
- Instagram performance tightened in 2025, with engagement down ~24% YoY and follower growth slowing across all brand sizes.
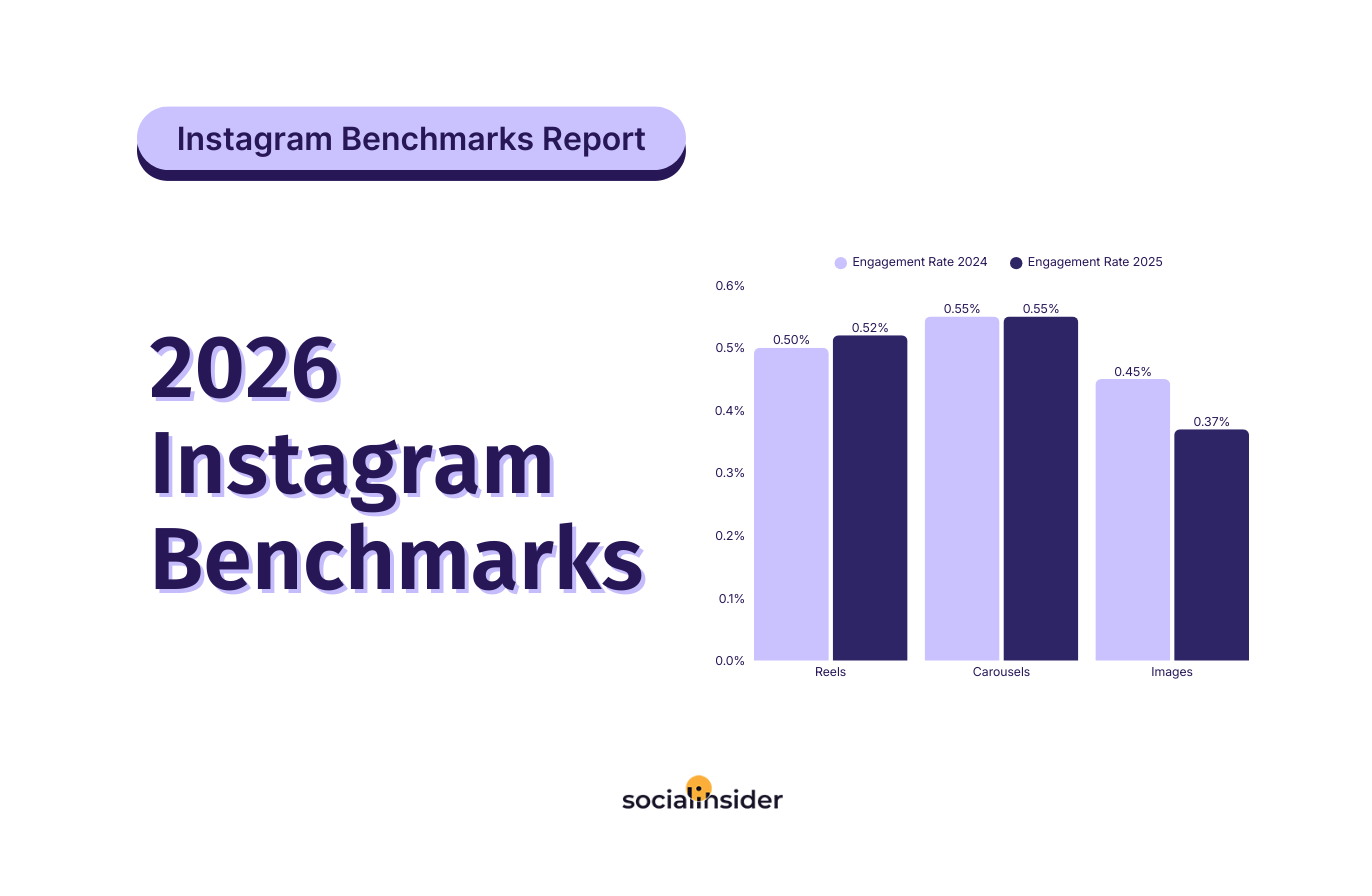
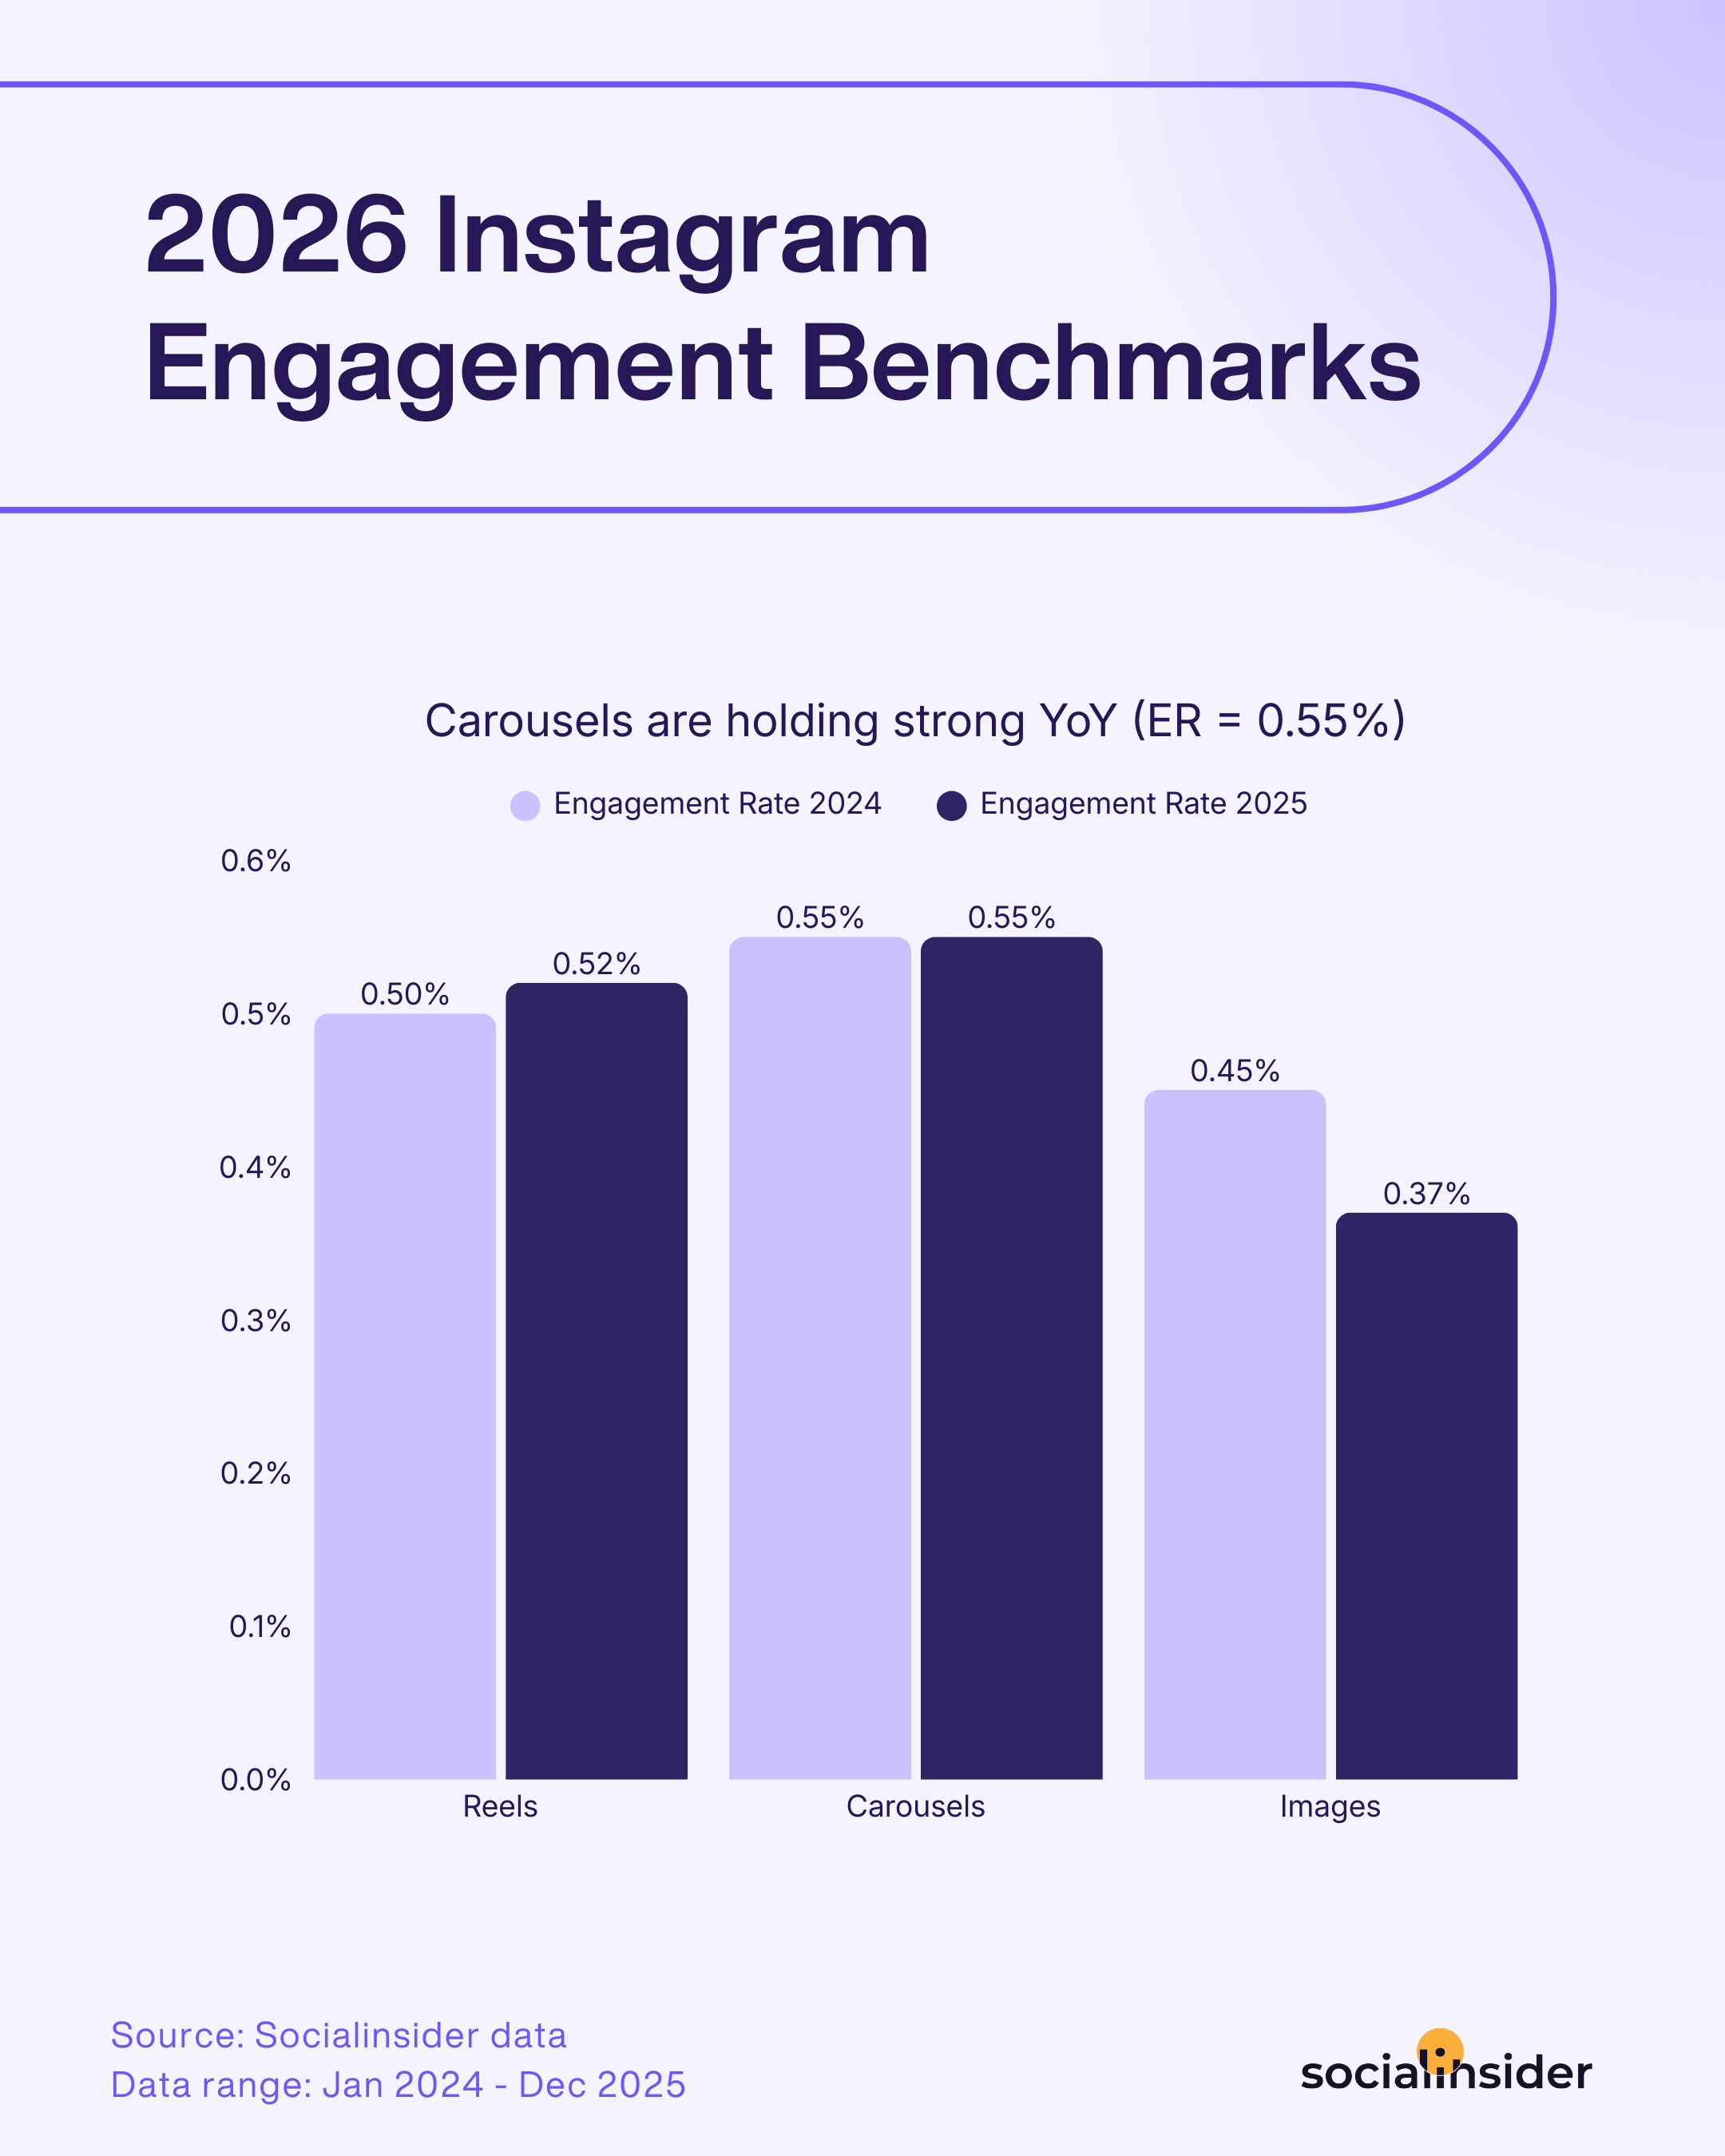
- Carousels remain the most effective format, showing the strongest engagement resilience year over year. Engagement rate on Carousels remains steady at 0.55%.
- Reels have become table stakes, offering stable performance but no longer guaranteeing incremental gains.
- Static images continue to decline, both in engagement (17% YoY decrease) and posting volume, reflecting reduced impact and prioritization.
- Carousels are driving the most saves and views across all brand sizes.
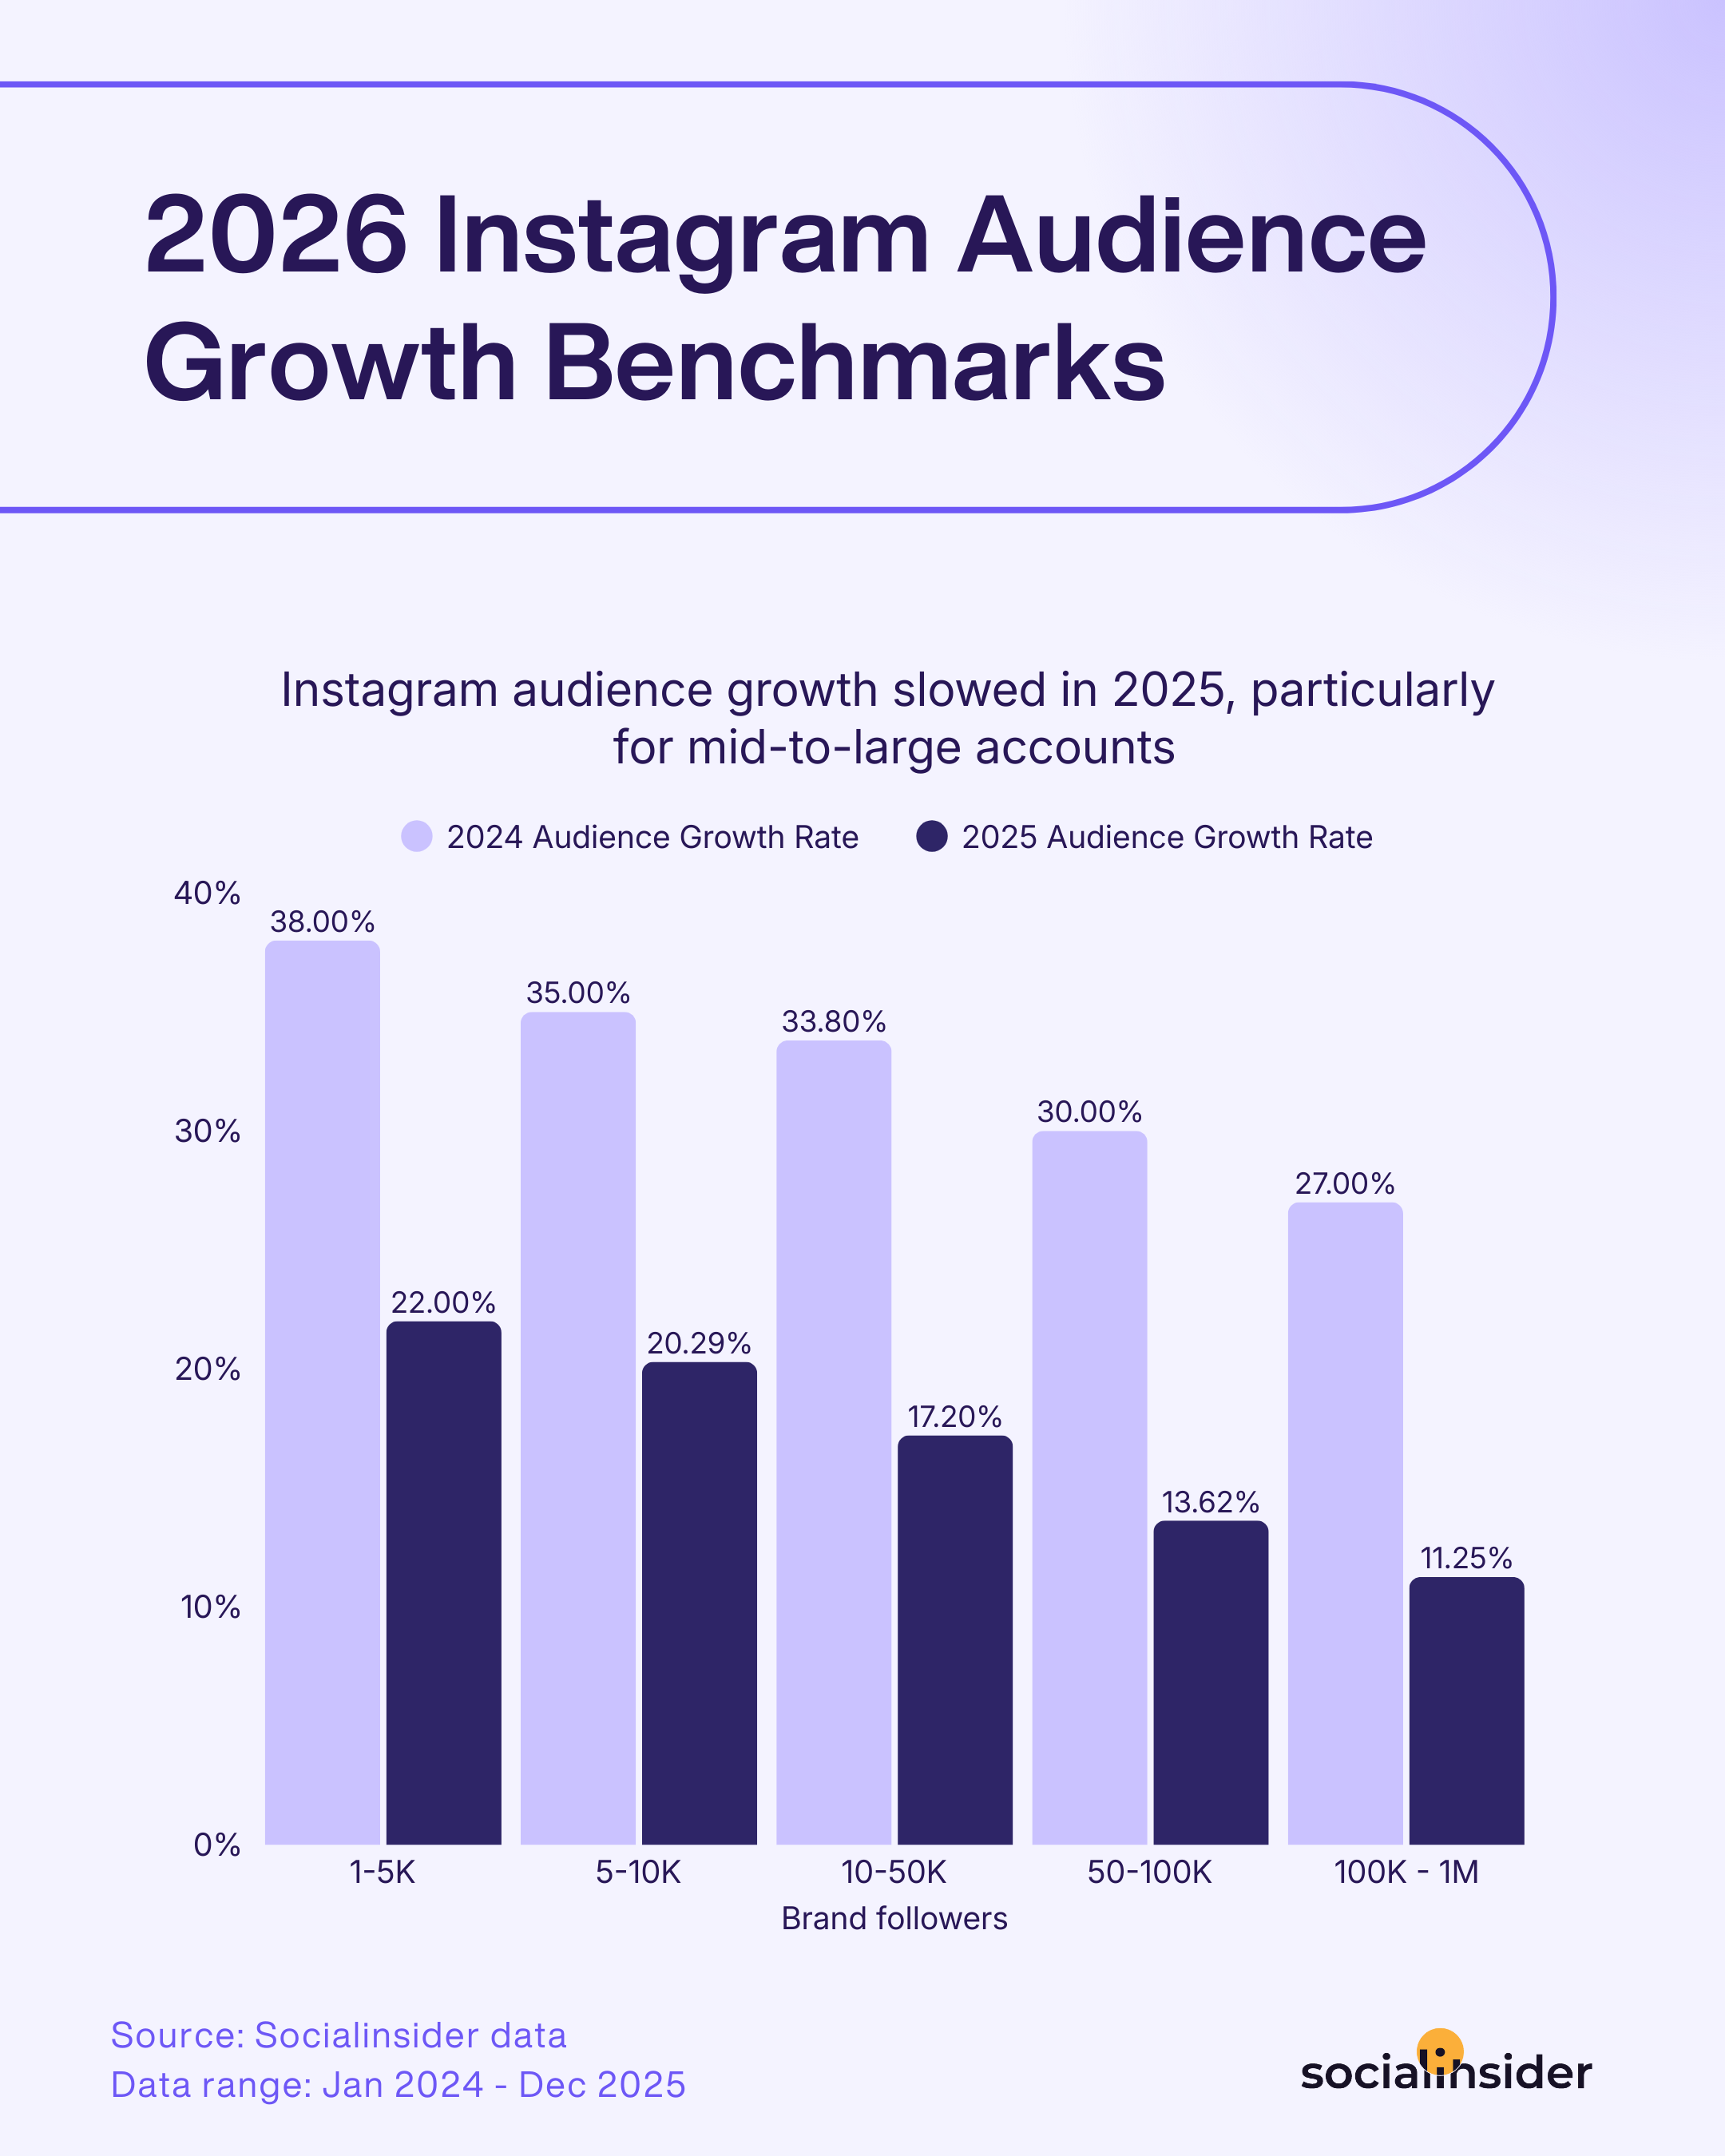
- Audience growth is harder to sustain at scale, with mid-to-large accounts experiencing the steepest slowdowns.
- Brands are responding by reallocating effort, shifting posting volume toward higher-impact, interaction-driven formats. Brands started to post more Reels - 33% increase YoY.
What does this mean for social teams?
-
Optimize for interaction, not visibility alone: formats that invite action (swipe, watch, save) consistently outperform passive consumption.
-
Double down on carousels for authority and education, particularly for insights, benchmarks, and practical takeaways.
-
Use Reels to maintain reach and relevance, but anchor performance expectations in engagement efficiency, not virality.
-
Deprioritize static images as a core tactic; use them selectively to support broader narratives or campaigns.
-
Adjust growth expectations for 2025: follower gains will be slower, especially for larger accounts, making retention and engagement more critical.
-
Measure success beyond volume, focusing on engagement quality, saves, shares, and downstream impact.
Instagram quarterly benchmarks
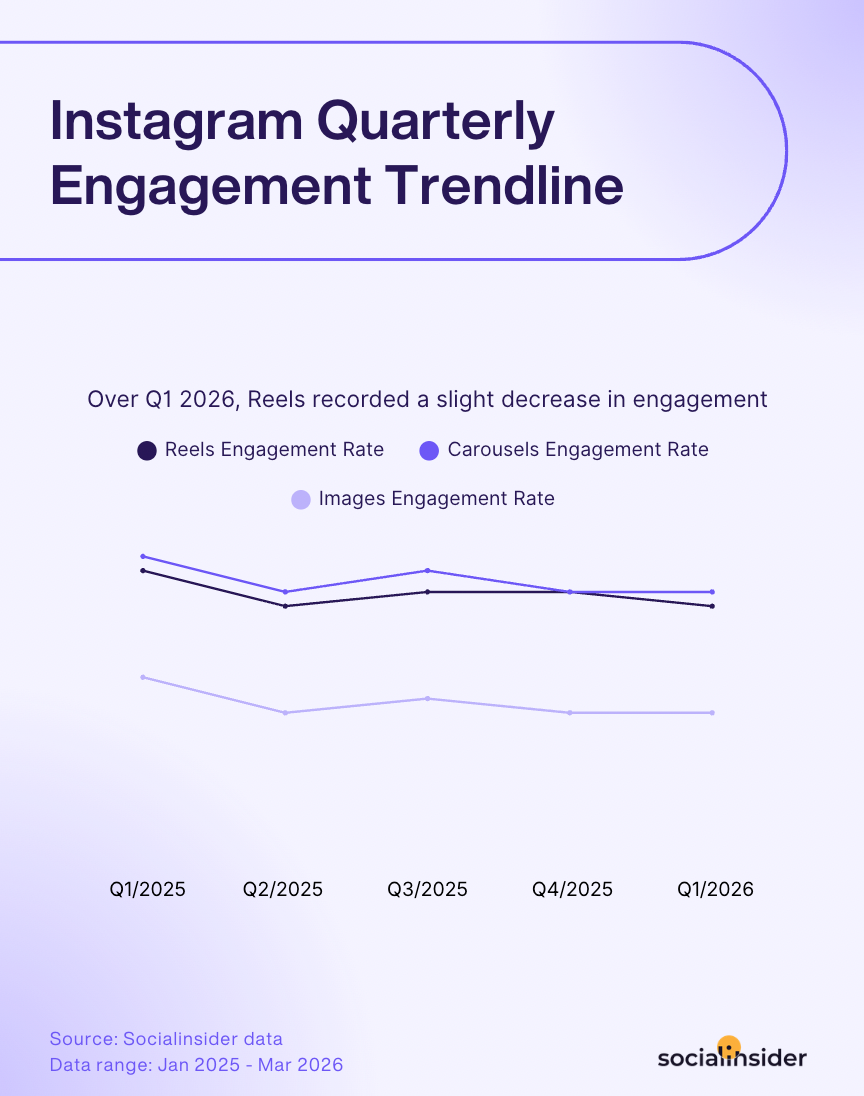
Over the first quarter of 2026, Reels recorded a slight decrease in engagement.
Over the past years, Reels and Carousels have been consistently competing as Instagram’s top-performing content formats. However, carousels continue to hold the lead when it comes to engagement, maintaining higher engagement rates than any other post type across most quarters.
At the same time, image posts continue to lag behind. Although static images were once Instagram’s core content format, they’ve been generating considerably lower engagement rates for quite some time now, as users increasingly gravitate toward more dynamic and interactive content experiences.
In a nutshell, this is how the quarterly engagement numbers look as for Q1 2026:
- Reels: Reels recorded a slight decrease in engagement in Q1 2026, dropping to 0.50% from 0.52% in Q4 2025. Despite the decline, Reels continue to be one of Instagram’s strongest-performing content formats.
- Carousels: Carousel posts maintained the highest engagement rate among all Instagram post types in Q1 2026, holding steady at 0.52%. Their consistent performance highlights users’ growing preference for swipeable and more interactive content experiences.
- Images: Single-image posts continued to generate the lowest engagement rates on Instagram, remaining flat at 0.35% in Q1 2026 and significantly underperforming compared to both Reels and carousels.
Instagram organic benchmarks
You’ve probably felt it yourself: the rules of engagement on Instagram are changing fast. These days, it’s not just what you post but how you deliver your message that makes people stop scrolling. Whether they’re looking for quick tips, a story that unfolds, or a burst of inspiration, Instagram users are more selective than ever about what actually earns their attention (and those precious double taps).
The bar for what’s considered immersive, interactive, or simply entertaining just keeps rising.
If you want the short story in terms of content performance, well, you must know that when it comes to best-performing post formats, Carousels lead the way in engagement on Instagram, while Reels are not far behind.
Now, let’s dig a little deeper:
Overall, at the moment, Instagram’s engagement rate is located at an average of 0.48%, and registering a 24% decrease YoY.
With an average Instagram engagement rate of 0.55%, Carousels have truly become Instagram’s secret weapon for engagement. This format invites audiences to pause, explore, and interact with each frame—making Carousels the go-to choice for brands that want to hold attention and deliver layered messages.
Meanwhile, Reels continue to grow in popularity, reaching a 0.52% average engagement rate on instagram. And if you ask me, I’d say it’s pretty obvious why—they fit seamlessly with the current demand for snappy entertainment and authentic behind-the-scenes glimpses. Reels make it easy to join a trend or showcase creativity, making it one of the most flexible—and engaging—formats out there right now. No wonder they’re catching up fast to Carousels.
On the other hand, the decrease in engagement rate for images—a 17% year-over-year drop—is a clear signal that static posts don’t capture the same excitement anymore.
Audiences crave formats that offer either depth or movement, which explains why the engagement rate on Instagram overwhelmingly favors Reels and Carousels these days. Compared to just a year ago, the ground has shifted, and the best way to rise above the average engagement rate for instagram is to embrace the formats winning user attention today.
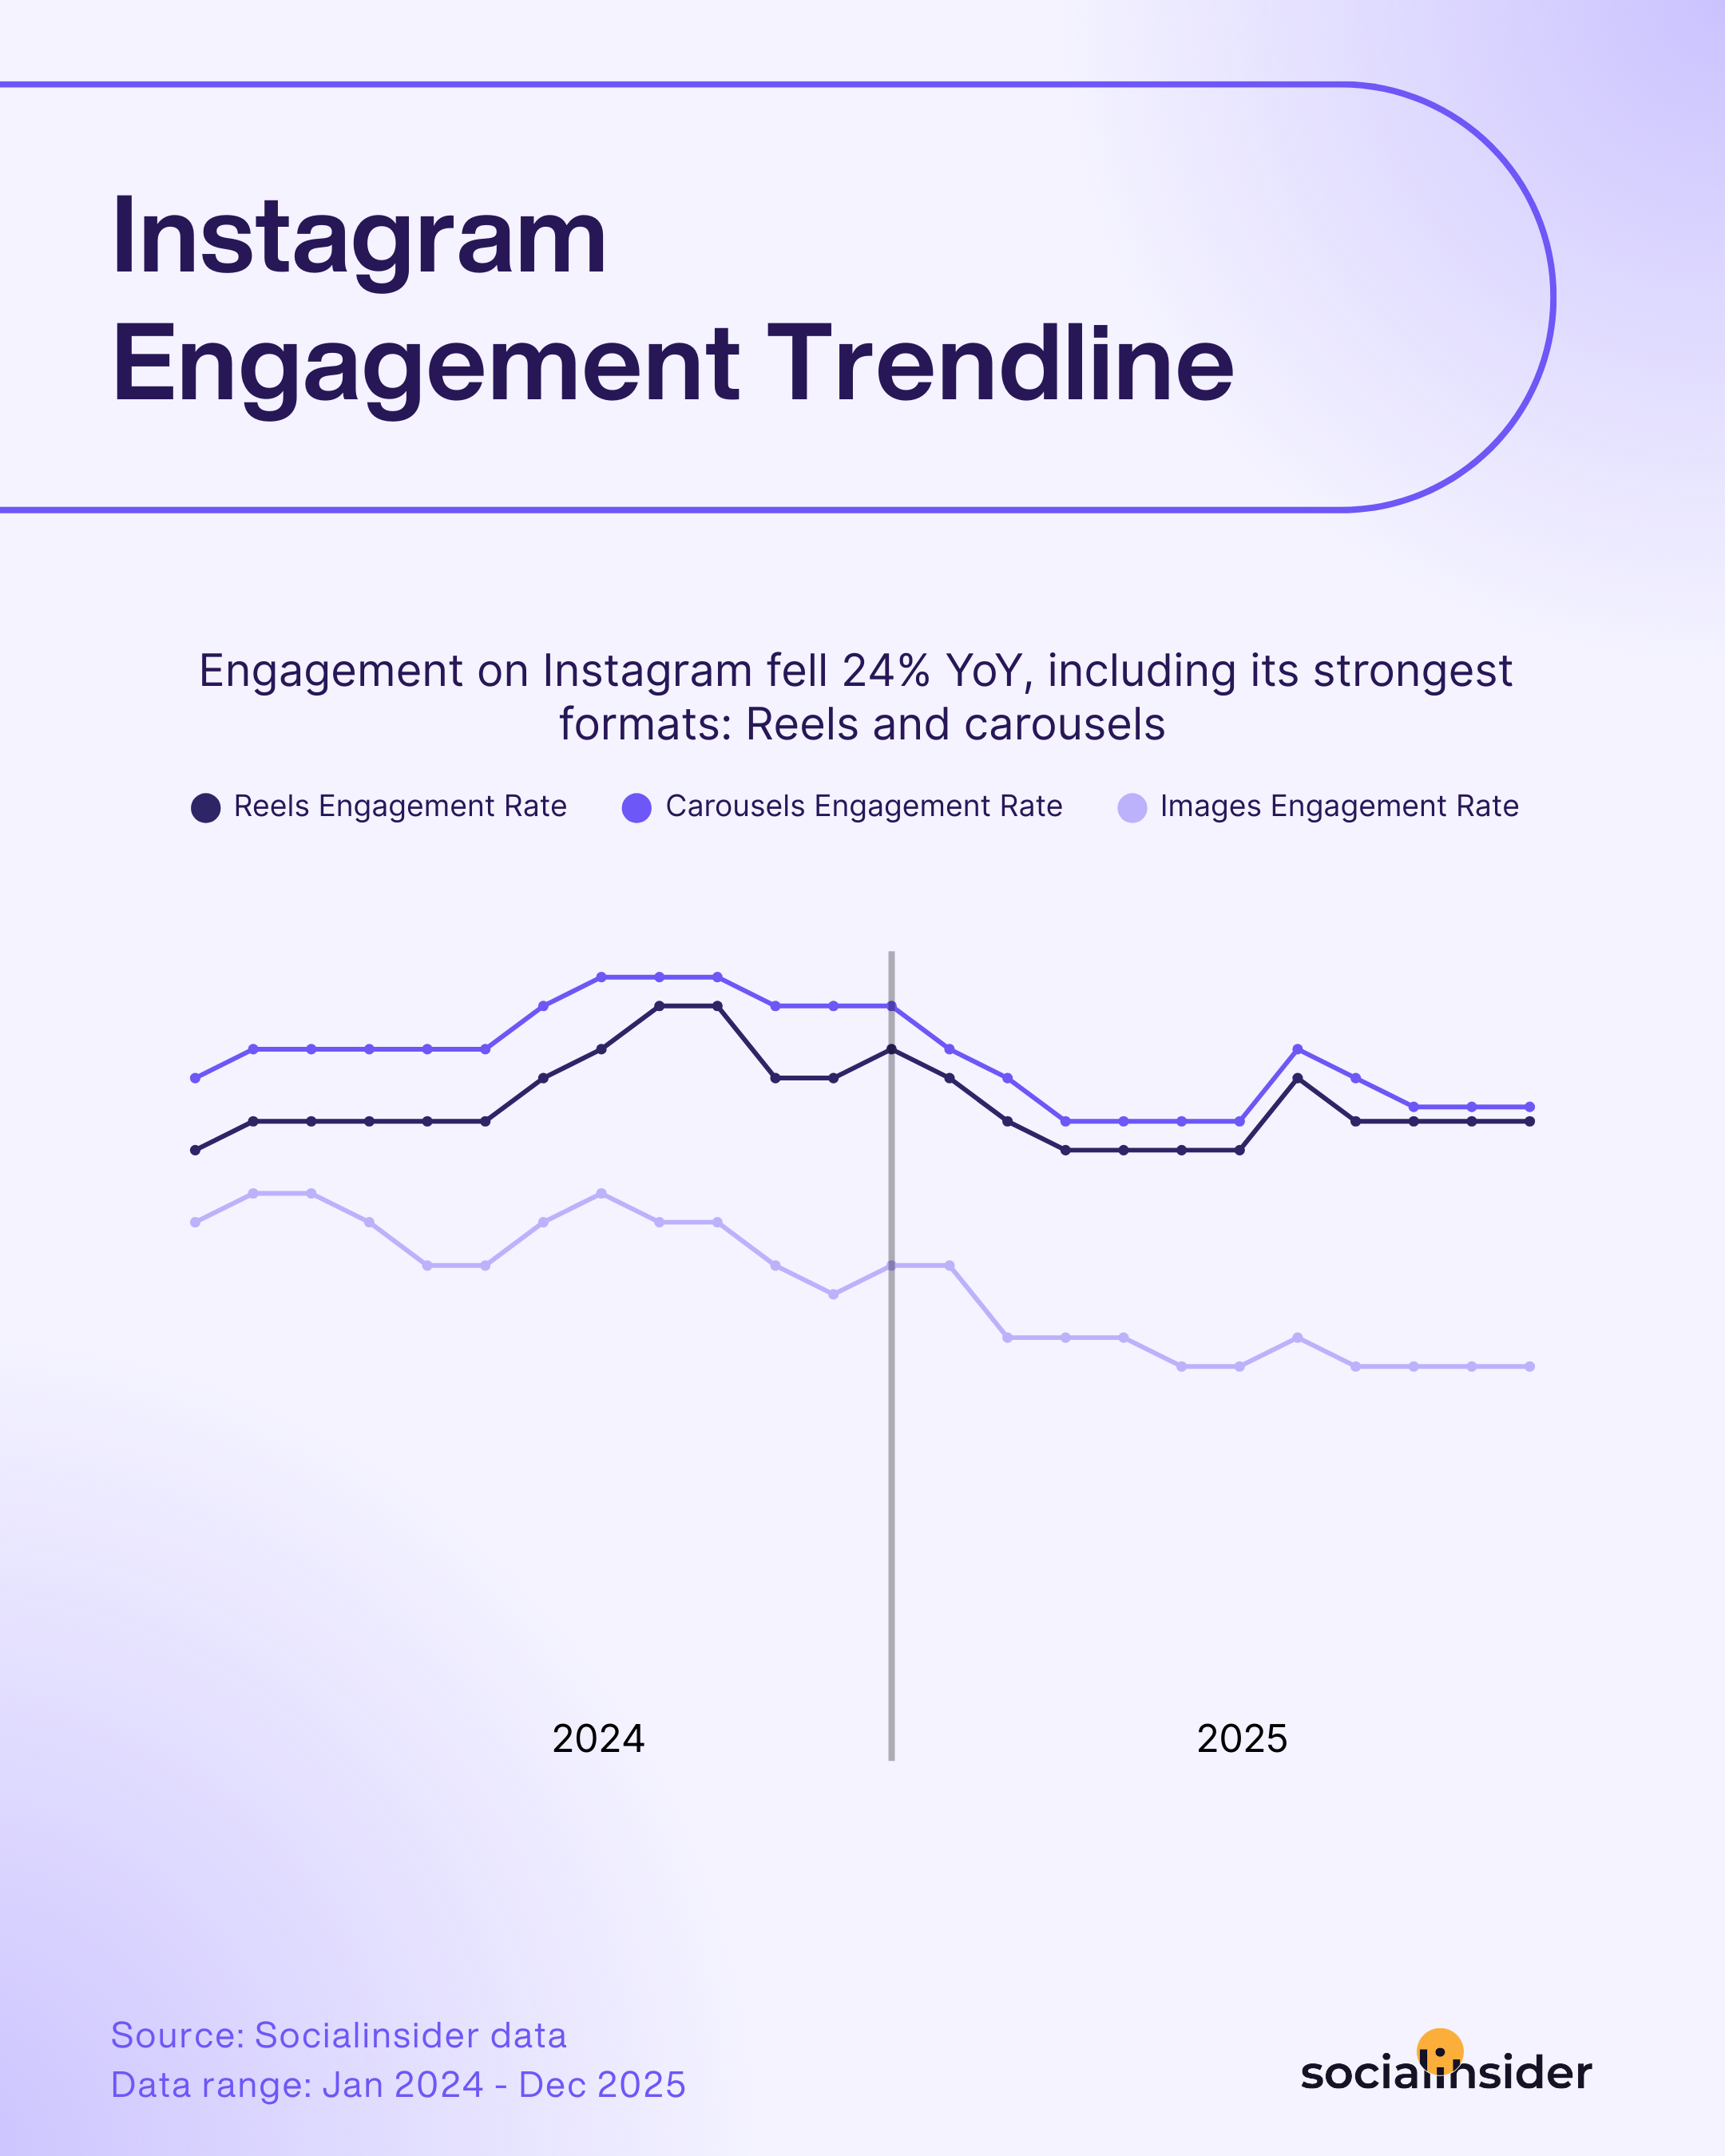
The decline in engagement isn’t random. It’s structural. We’re operating in an attention economy that has reached peak saturation. Brands are publishing more content than ever, creators are monetizing more aggressively, and AI has dramatically increased output volume. The result is a supply-demand imbalance: more content competing for the same finite human attention.
At the same time, user intent hasn’t changed. People still come to Instagram for connection, inspiration, and belonging. But the platform experience has become increasingly commercialized. When feeds feel transactional rather than relational, audiences disengage. It’s not that people care less. It’s that they’ve become more selective.
We’re also seeing a shift from passive engagement (likes) toward private engagement (shares, saves, DMs) and community-based interaction. Surface metrics are declining, but that doesn’t necessarily mean interest is. Engagement hasn’t disappeared, it’s evolved.” - Chloe Maguire, Brand & Social Media Lead at Leapsome
Strategic tactics to boost Instagram engagement rate:
- Pair educational value with entertainment: Both Reels and Carousels can teach while they entertain. Quick tips, how-tos, or industry insights presented in a fun, visually appealing way drive saves and shares—helping your average engagement rate for Instagram soar.
- Repurpose across formats: Don’t let a successful post be a one-hit wonder! If a story or tip took off as a Carousel, reimagine it as a Reel with dynamic visuals and voiceover—or flip it the other way. Not only does this approach keep your feed fresh, but it also gives your followers fresh ways to connect with the same idea.
- Mix formats for best results: A blend of Carousels and Reels is your most reliable path to outperforming the Instagram average engagement rate, appealing to storytelling lovers and video fans alike.
While audiences still crave the intentional connection the app originally offered, they’re now met with a flood of brand content. This is why private sharing via DMs has overtaken public commenting. For brands to win today, high relatability or a clear utility 'value-add' is the only way to earn a spot in a user's private conversation. – Taryn Potasky, Social Media Specialist at Intuit
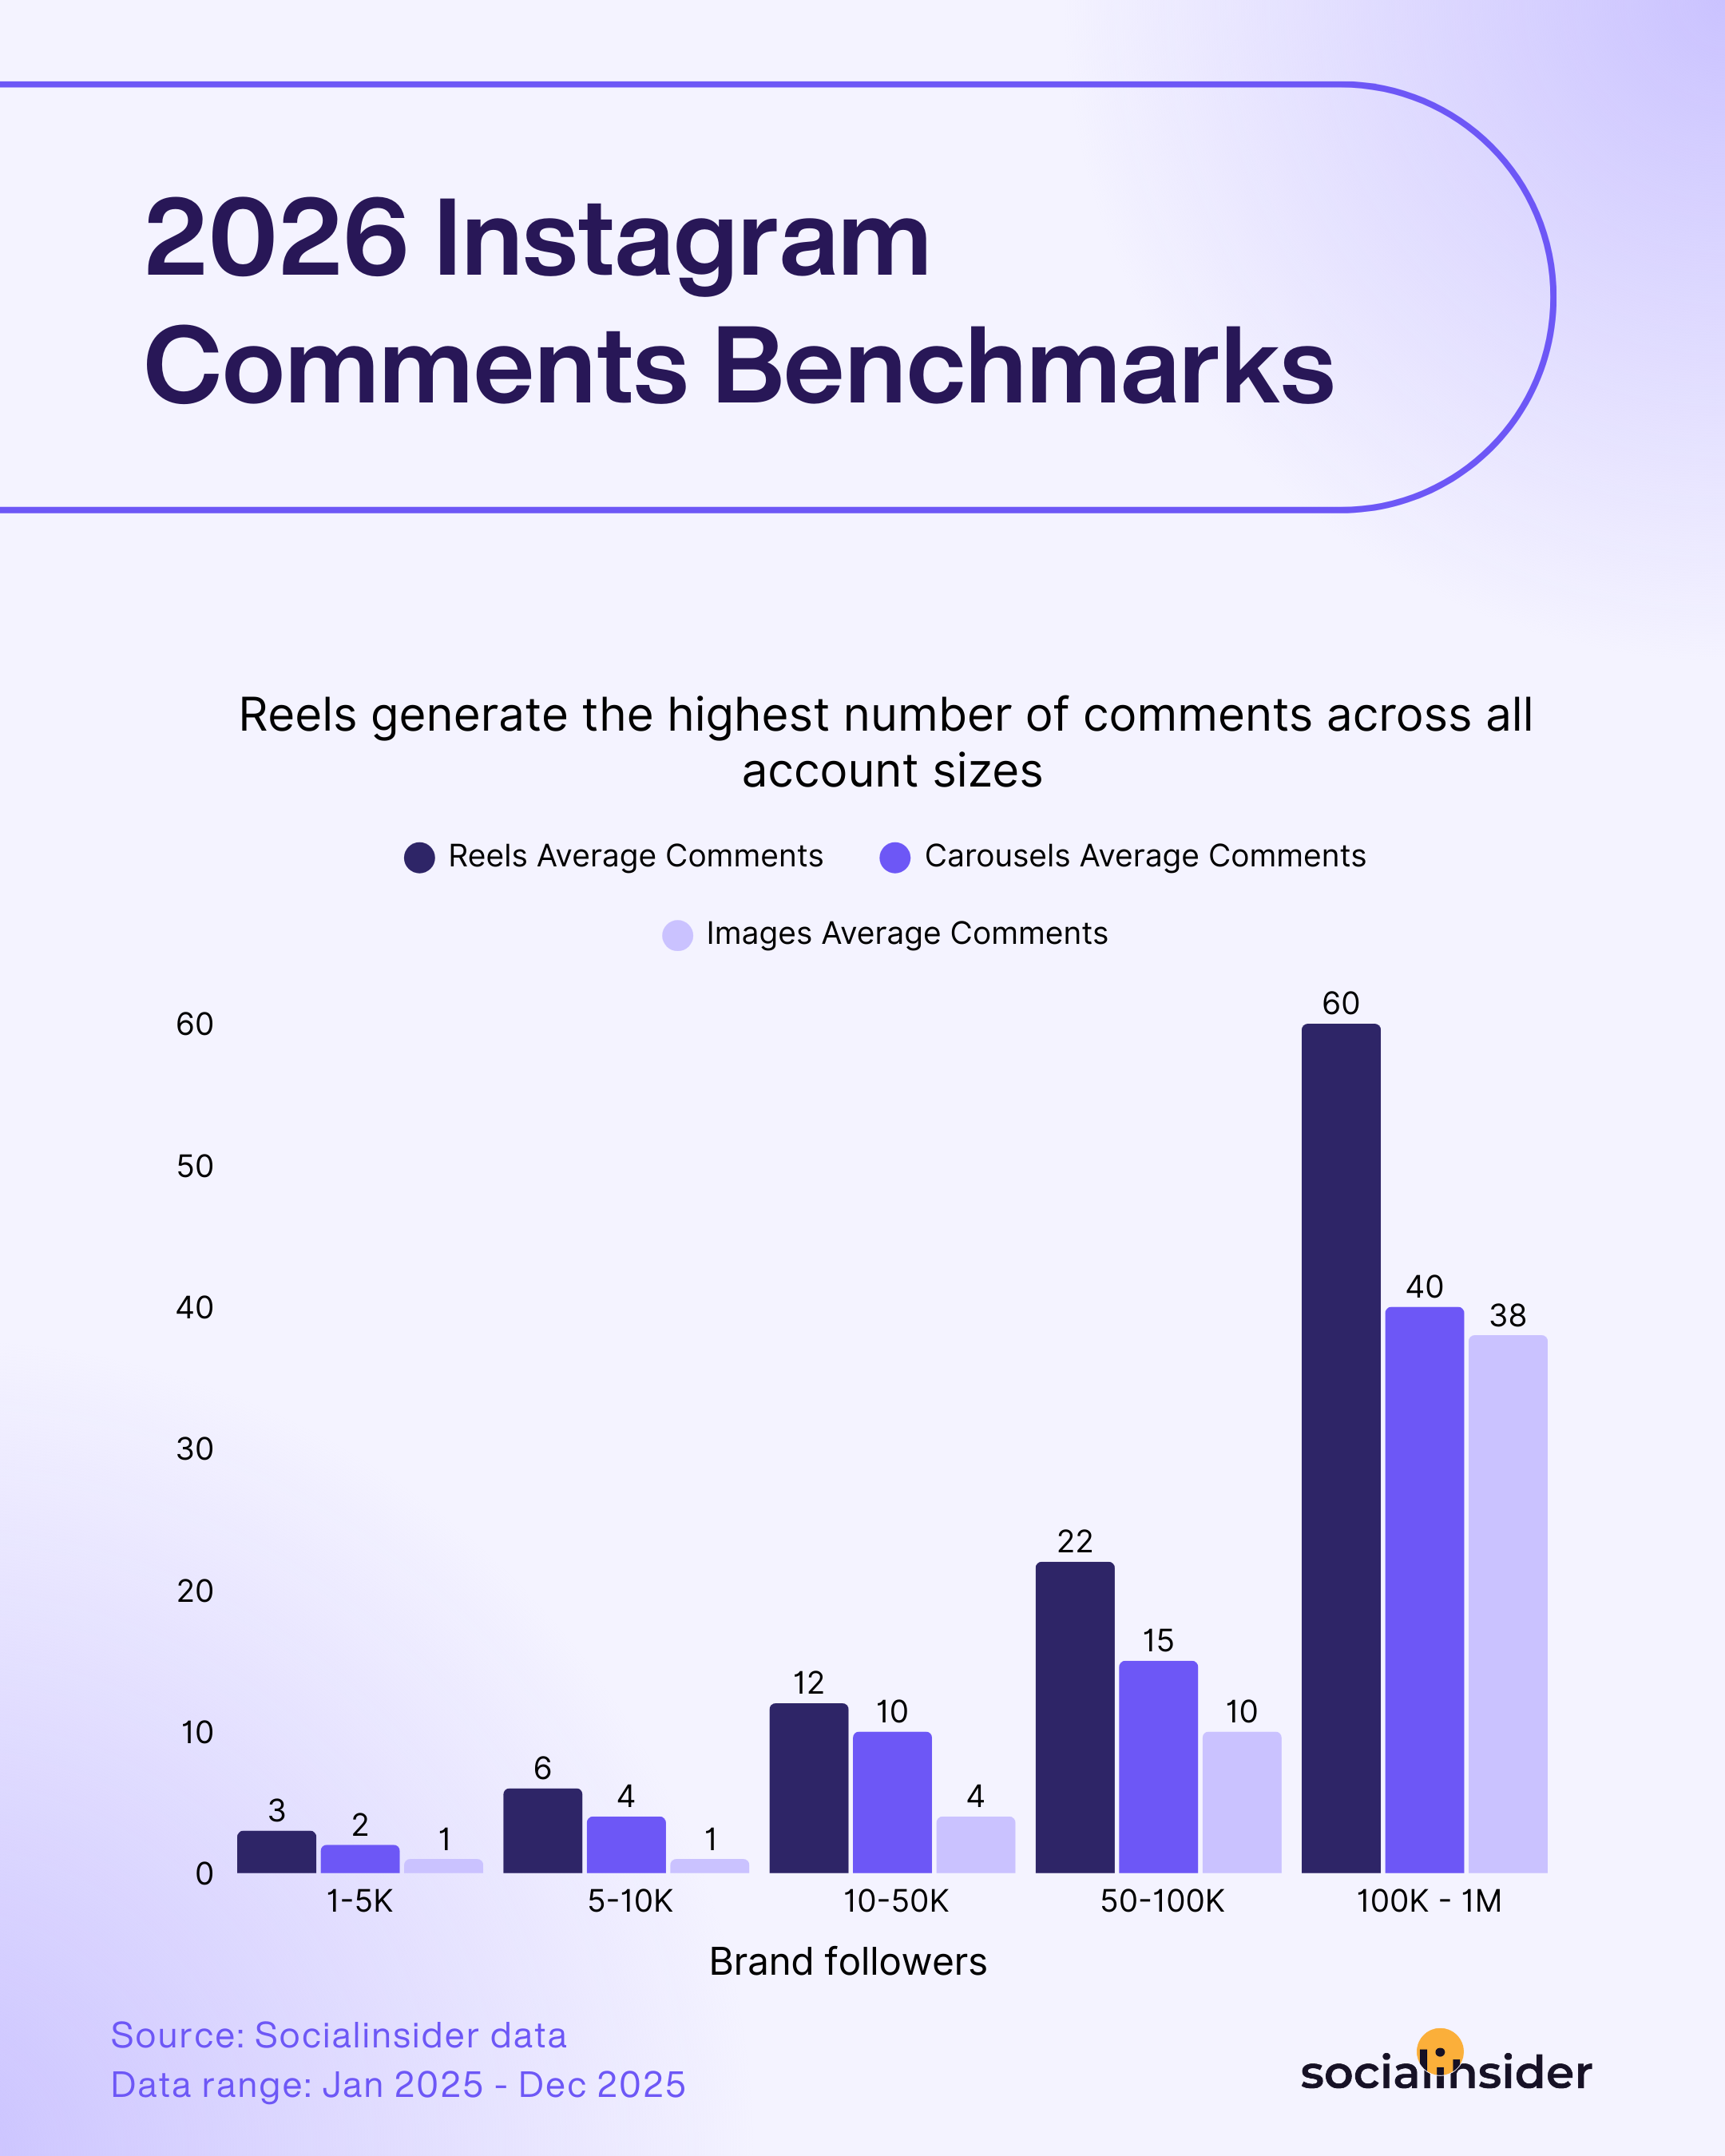
2026 Instagram comments benchmarks
If you’ve ever found yourself hoping for more real conversations in your comments section, there’s one format that consistently delivers—Reels. No matter the size of your following, Reels almost always spark the most conversations. But what’s really striking is just how much this effect multiplies as your profile grows.
For small brands, sure, the difference between formats might feel relatively modest. But as soon as you start building a bigger community, the power of Reels to inspire dialogue becomes impossible to ignore. Once you’re playing in the bigger leagues, Reels don’t just edge ahead—they absolutely dominate when it comes to comment counts. At that stage, it’s not even a close race, with Reels pulling in far more audience reactions than both Carousels and images.
Socialinsider data makes it clear that something about the fast pace, immersive sound, and trend-driven magic of Reels grabs attention and simply compels viewers to share their thoughts.
Though carousels can be just as thought provoking and lead to just as many engaged comments, the Instagram Reel is the content format that the platform is still pushing the loudest.
TikTok centers on a never ending video feed, and Instagram shifted to the same format with the Reels tab being front and center. So people flock to them, not always out of interest, but because they’re served up on a platter.
And brands know this, so the strategy becomes, let’s make these Reels as shareable as possible so people can send this to their friends and spark a conversation in the comments. Sometimes this leads to engagement bait content, but we’re also seeing a lot of incredible, out of the box storytelling that can really leave a lasting impression on people in the era of content you forget on the next scroll. - Courtney Coleman, Global Social Media Manager
Strategic tactics to drive more conversations:
- Capitalize on momentum as you grow: The bigger your following, the bigger the comment lift from Reels—so don’t hesitate to double down on them as your brand expands.
- Open with a challenge or prompt: Use those first few seconds to ask a direct question or set up a debate. That initial invitation makes it easy for followers to leave a comment without overthinking.
- Test time-sensitive or trend-driven topics: Things happening right now tend to bring out more opinions and stories, especially on Reels.
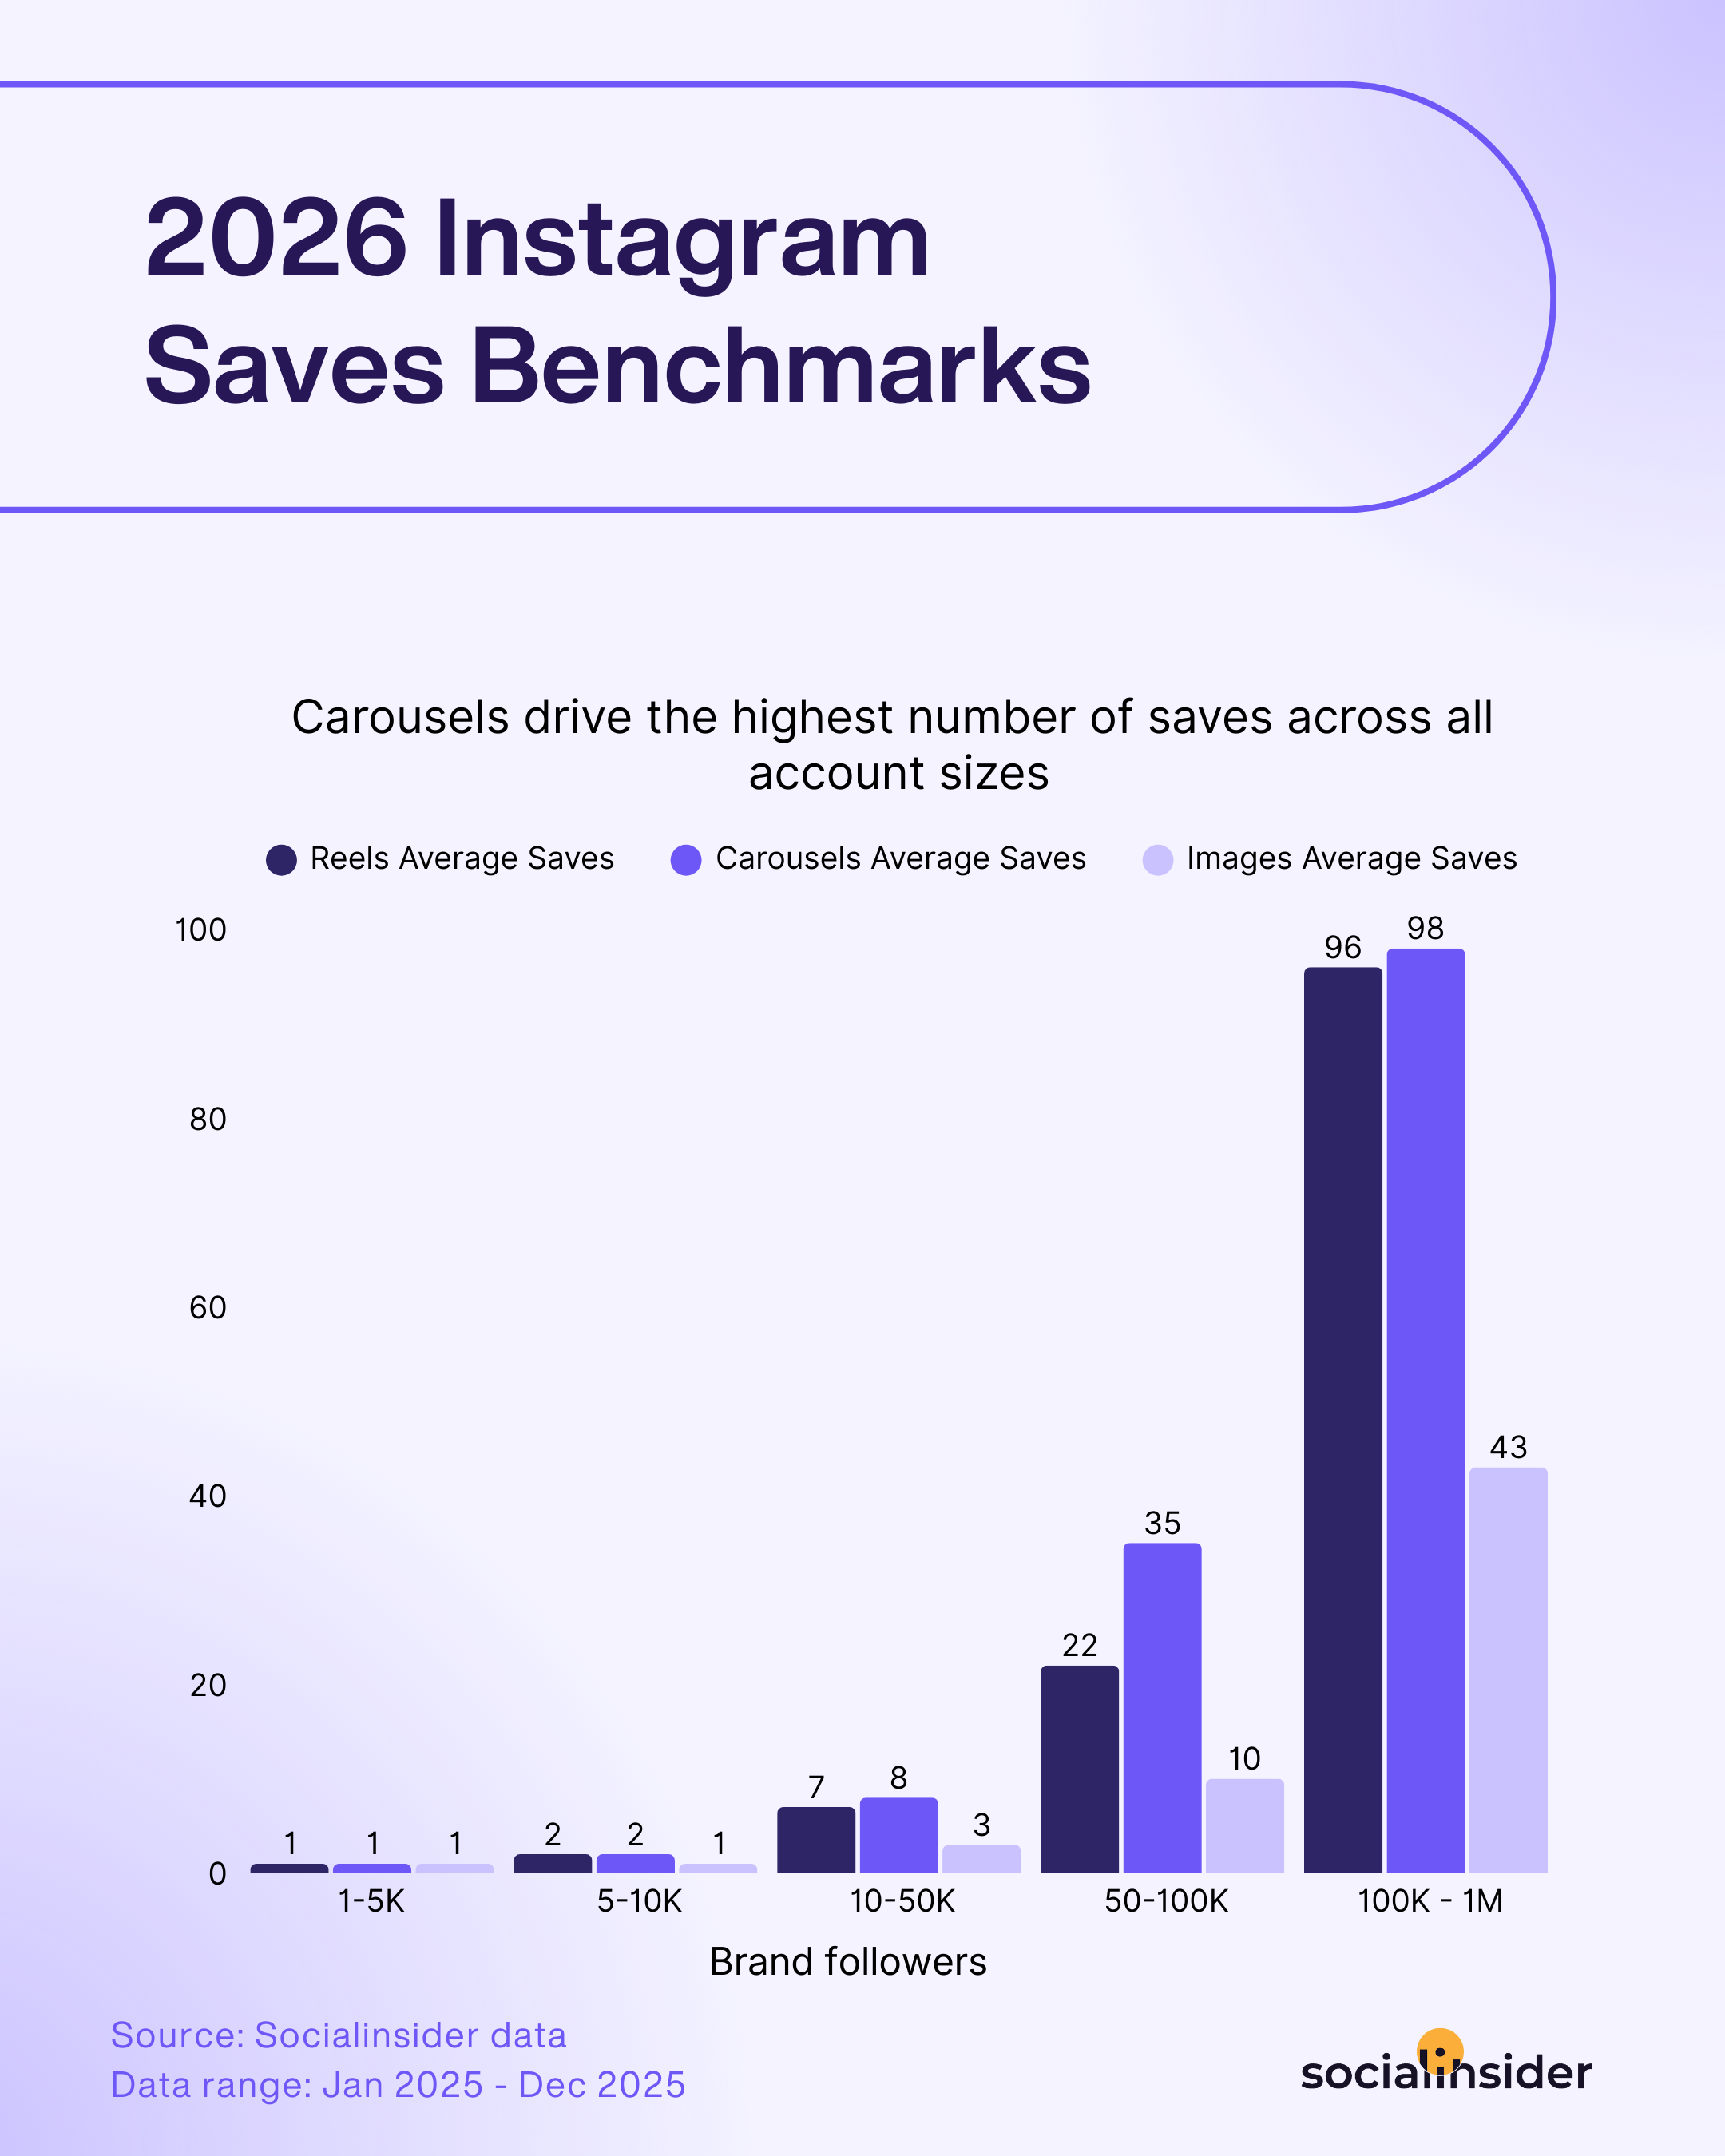
2026 Instagram saves benchmarks
Let’s talk about a metric that quietly reveals which posts people actually want to return to: saves.
Across every brand size, one content type clearly stands out—Carousels.
Whether you’re just starting with a smaller following or you’ve already built a massive community, Carousels consistently earn the highest number of saves.
As your audience grows, so does this effect. The leap is especially dramatic for larger accounts. By the time brands reach the 100K follower milestones, Carousels see their save numbers skyrocket—sometimes more than triple compared to smaller accounts.
Why Carousels?
They’re perfectly built for step-by-step lessons, checklists, and in-depth ideas—content people want to flag and come back to, whether it’s to revisit a recipe, share a workflow, or simply keep a dose of inspiration handy.
A few reasons why Carousels are performing so well: functionality, algorithm features, and ease of consumption. On social, when you watch a video or view a static image, it’s more of a passive viewing activity within platforms. There’s something about physically swiping on mobile (or clicking on desktop) that gives carousels a bit more stickiness.
Additionally, with Instagram, there’s an algorithmic feature that shows the second frame of a carousel when you’re seeing it a second time, but haven’t engaged with it yet. It ends up being served twice in the feed as a second chance for engagement.
Lastly, carousels are a nod to traditional brick-and-mortar print media, like brochures. They’re not quite long enough to be consumed like a magazine, making them a free piece of media that audiences can quickly skim to learn about a topic. – Nancy Oganezov, Senior Social Strategist at Dentsu Creative
Strategic tactics to generate more saves:
- Make Carousels longer if it helps deliver more value; don’t be afraid to go beyond just a few slides if you’re offering something worth saving.
- Start with a scroll-stopping cover slide: For Carousels, invest extra time in that very first image—if it sparks curiosity or says “Save me,” people are far more likely to swipe and keep the post as a resource.
- Design a branded ‘Save for later’ sticker or graphic: Visually cue the action with subtle icons or text in your slides—it’s a small nudge that works surprisingly well.
A ‘save-worthy’ carousel comes down to one factor: service content. These are the posts that share a piece of helpful information that a fan will want to come back to reference later or something they may want to try and remember. As brands look for more ways to engage their audiences, these helpful tips can be a real asset and give people a reason to follow. But here’s the catch – the information you’re offering has to be truly useful. Working with a running brand, some of the most successful posts we saw were carousel posts with images of our shoes that called out product features. Simple, helpful, and sharable. - Kyle Mccall, Social Media Manager
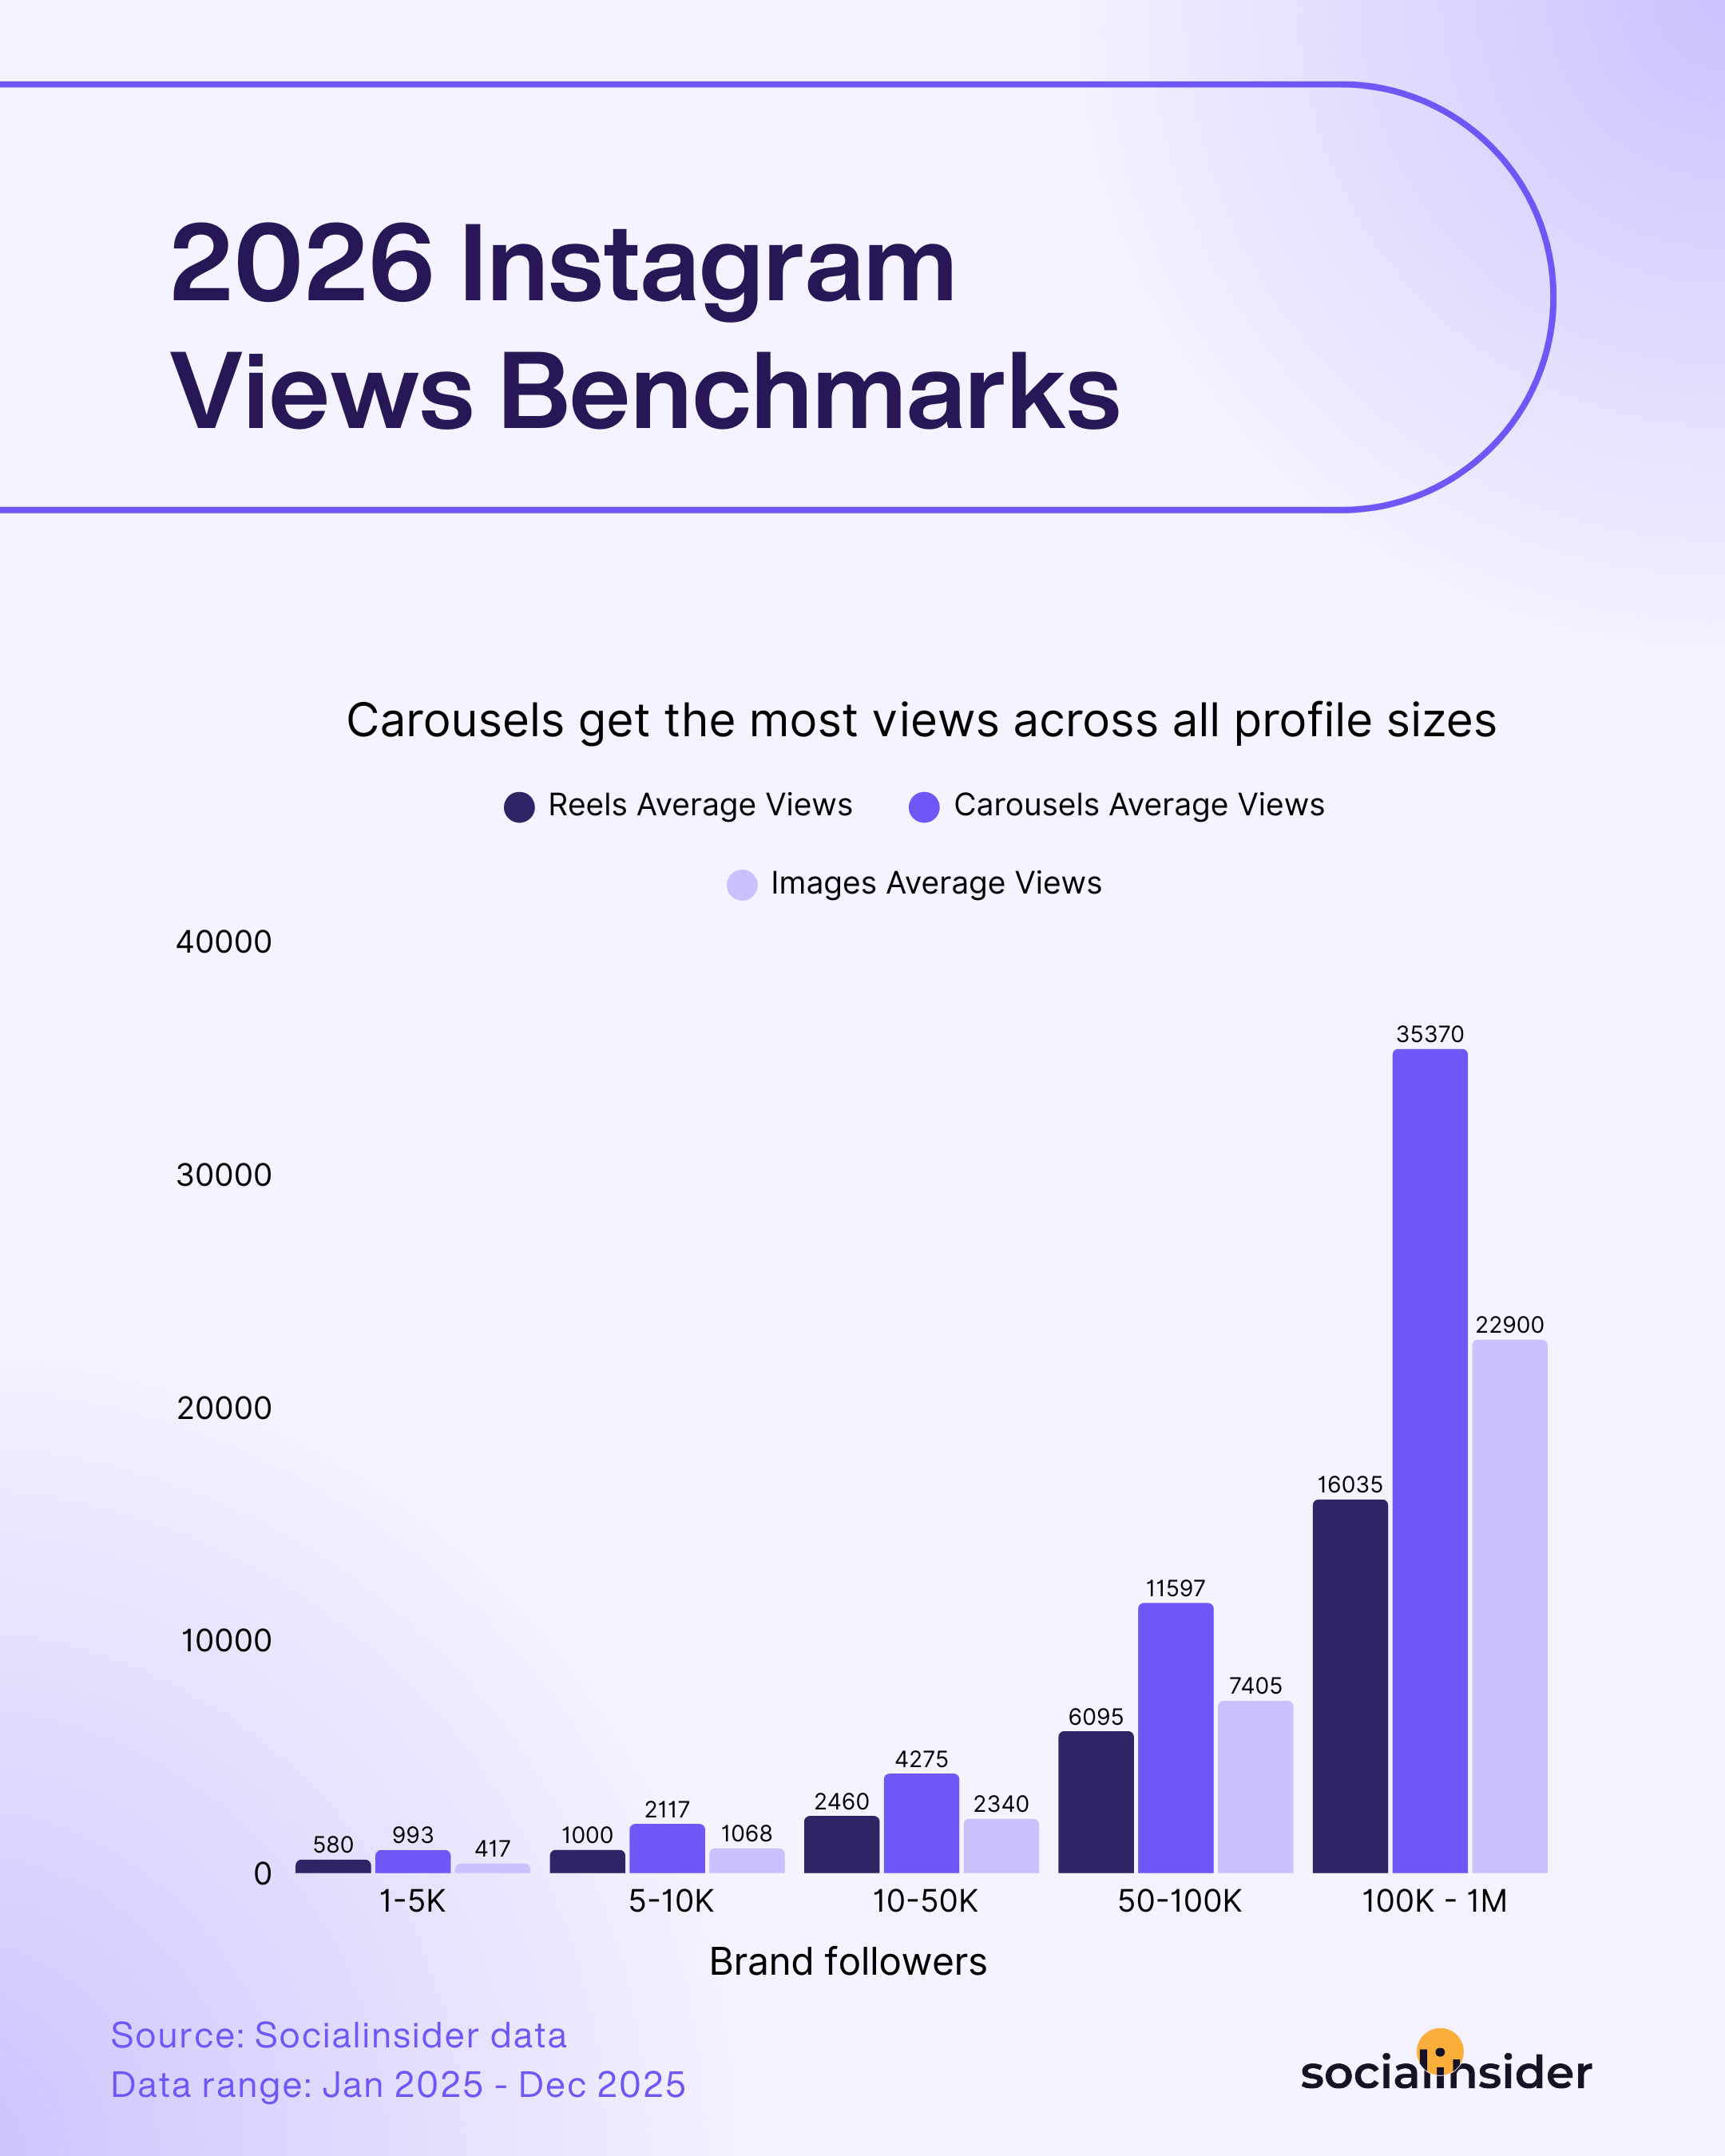
2026 Instagram views benchmarks
Carousels take the top spot for views on Instagram, no matter the size of your account. What gives them this clear advantage—even over Reels? It’s all about double exposure.
Carousels are the only content format that can show up twice in someone’s feed: first as the original post and then again if a user scrolls past without interacting, Instagram often resurfaces the Carousel later with a different slide. That extra chance to capture attention naturally drives up the view count and keeps your content in circulation longer than a single-frame post or video.
And similar to the other metrics’ case, as your follower count grows, this effect becomes even more powerful.
For brands with over 100K followers, it’s common to see Carousels reach over 35,000 views per post—easily outpacing both Reels and static images, which simply don’t have the same second-shot advantage. Reels still perform well, riding the wave of video discovery, but the unique way Carousels re-enter the feed ensures they lead in overall visibility.
Strategic tactics to get more views:
- Focus on Carousels for maximum exposure—use those extra slides to get your content seen not just once, but potentially twice by every follower.
- Blend Reels into your strategy especially for fresh audiences: Instagram pushes fresh video content to people who don’t follow you (yet).
- Design each slide to stand on its own: remember, Instagram might resurface any part of your Carousel, so make every frame count.
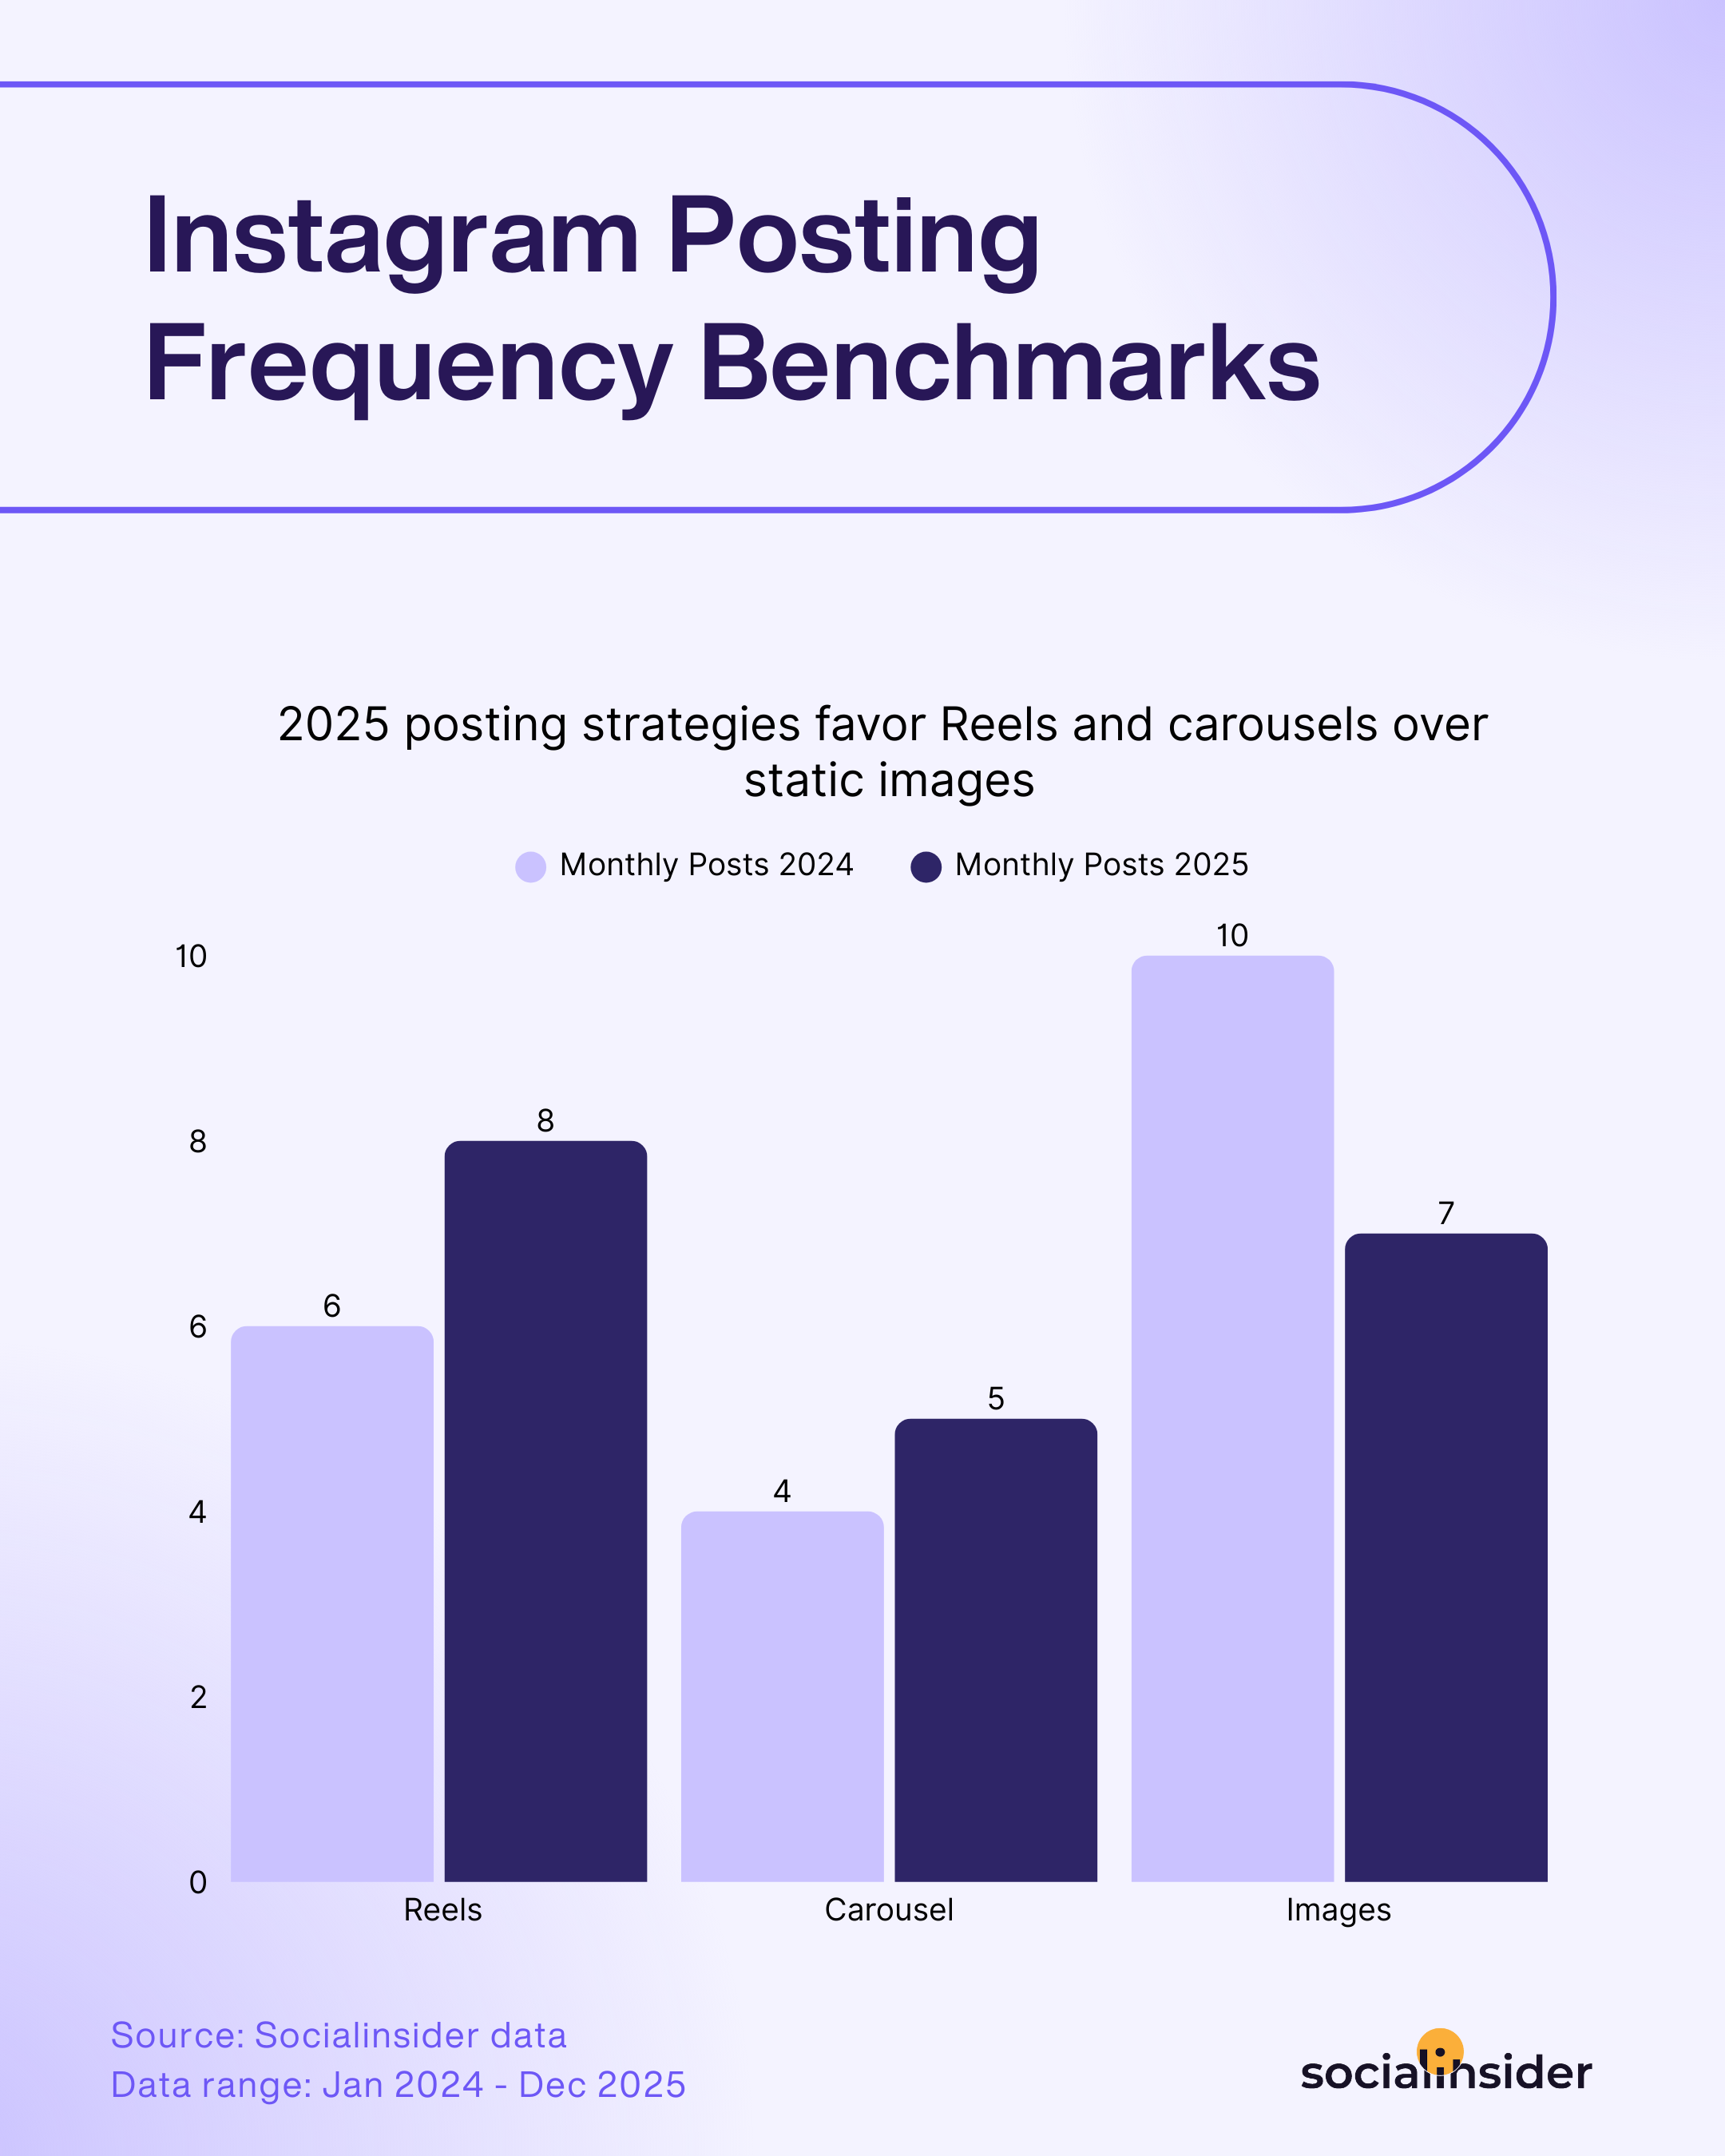
Instagram posting frequency benchmarks
Regardless of the platform you’re managing, one thing is clear - that for effective social media marketing, consistency is key. But the mix of what you post matters just as much as how often you show up.
Right now, most brands are posting Reels most frequently, followed by images, with Carousels coming in third.
In 2026, the ideal Instagram mix is mostly short-form video (around 60–70% Reels) because discovery still runs through watch time and shares. About 20–30% should be carousels built for saves (value, education, opinion, or storytelling), as they deepen loyalty and signal quality to the algorithms. The remaining 10% can be single images or culture-driven posts that humanise the brand and keep your grid sharp. Stories should run frequently alongside all of this, acting as the relationship layer that turns reach into brand trust. – Sam Oliver, Social Media Strategist
Strategic tactics to optimize your content calendar:
- Shift your focus from images to Carousels: If you’re still relying on single-image posts out of habit, try replacing some of them with Carousels. Since Carousels consistently outperform images in both reach and engagement, making this switch can give your content an immediate lift.
- Let analytics guide you: Don’t just guess what works. Regularly review your post performance to see exactly which specific formats, topics, or series spark the best results for your brand—then double down on what’s making the biggest impact.
- Focus on quality and relevance, not just quantity: Instead of posting just to fill the calendar, make sure each post, whether it’s a Reel, Carousel, or image, ties back to what your brand stands for and offers real value to your audience. Every single piece of content should move your brand story forward—helping you stay memorable, trustworthy, and engaging, no matter how often you show up.
I think there is absolutely still a place for static images on Instagram. As mentioned elsewhere here, carousels still have strong engagement and so I would recommend using your static images in a carousel. For the brands I’ve worked with, real-time event coverage has always been a social pillar and the reality is that even the quickest video team isn’t going to have content turned around in the same time as a photographer. Strong imagery can tell a whole story - the key is to have frames that grab attention. – Kyle Mccall, Social Media Manager
2026 Instagram audience growth benchmarks
Building your Instagram community is a journey that looks different at every stage. Some accounts seem to take off overnight, while others find the path to steady growth a little slower. If you’re curious about how your followers stack up, here’s what the latest numbers reveal.
One thing is clear: audience growth on Instagram isn’t linear—it changes as your community gets bigger. The latest data shows that the smaller your account, the faster you’re likely to grow.
Brands with just a few thousand followers can see growth rates above 20%, while the pace inevitably slows as your page gets bigger, gradually dipping to around 11% for large, established profiles closing in on a million followers.
That’s not a failing; it’s simply how the platform works. In the early days, you benefit from the novelty factor—new faces join quickly, every campaign feels fresh, and organic reach comes easier. But as your numbers climb, it naturally takes more creativity (and effort) to attract each new wave of followers. The bigger your reach, the more your audience growth starts to level out as retention and churn balance things out.
Mid-to-large accounts tend to slow right down because the algorithm stops giving them that early “boost” and just shows posts to their followers. As you get bigger, engagement naturally drops a bit; more casual followers, fewer proper die-hard fans, so reach takes a knock even if your numbers look decent. A lot of creators also play it safer and go a bit broader with their content, which waters down the niche edge that got them growing in the first place. – Sam Oliver, Social Media Strategist
Strategic tactics to get more followers in 2026:
- Take advantage of the early-stage momentum: When your account is small, invest energy in community-building, collaborations, and shareable content—these are your best levers for quick gains.
- Watch out for churn: The bigger you get, the more important it becomes to stay relevant and keep the content mix fresh to avoid drop-off.
- Encourage user-generated content: Run hashtag challenges, feature customer stories, or host giveaways that invite community participation—this not only engages current followers but also exposes your profile to their networks.
Early brands grow by borrowing attention and showing up everywhere to get discovered. Once a brand matures, growth comes from compounding brand equity, not chasing raw reach. That means sharpening what makes the brand distinctive, creating more value for existing audiences, and expanding selectively into new spaces where it can show up with real credibility. The brands that stall at scale are usually the ones still running a challenger playbook long after they stopped being one. - Sierra Winnow, Senior Social Strategy Manager
Methodology
The findings of this study were based on the analysis of 35M Instagram posts, collected from 447,613 pages with an active presence between January 2025 - December 2025.
The average engagement rate per post (by followers) on Instagram is calculated as the total engagement (the sum of likes and comments) of the posts published within an established timeframe divided by the total number of followers that a profile has. The result is then multiplied by 100.
Average comments per post represents the number of comments a post receives, on average.
Average saves per post stands for the average number of saves a post receives on average.
Average views per post represents the number of views a post receives on average.
Average posts per month stands for the average number of views a Reels get, on average.
The average follower growth rate is calculated as the number of followers you gained divided by the number of followers you started with and multiplied by 100.
NOTE: This study contains 2025 values, presented as 2026, because, at the time of publication, there wasn't enough data for analysis, with the year just starting. That is why we bring quarterly updates, as the year unfolds and more data is available.
Get in-depth Instagram competitive insights
Run an insightful Instagram competitive analysis and get content optimization insights!
Ready to improve your social media strategy with real-time insights?
Get strategic insights, analyze the social performance across all channels, compare metrics from different periods and download reports in seconds.