15 Facebook Metrics To Track For Smarter Decision Making
Facebook metrics show whether your content reaches, resonates, and converts. Learn the 15 metrics to track and how to use each one.

Facebook metrics tell you whether your content is reaching people, resonating with them, and moving them toward action, and that's true whether you're looking at reach, views, engagement rate, CTR, or CPM. Meta Business Suite gives you access to more of these numbers than you'll ever need, yet most social media leaders still walk into executive meetings unsure whether what they're presenting actually tells the right story.
If you're here, you already know the problem usually isn't a lack of data. It's not knowing which of those numbers actually matters for the goal in front of you.
In this guide, I've broken down the Facebook metrics that are worth your attention: what they measure, what you should be comparing with your competitors, and how to use them to make better decisions. And as a bonus, I'm sharing some insight Katie McKiever, social media and communication specialist, gave me in a chat we had. Let's dive in!
Key takeaways
- Facebook metrics tracking should start with a defined goal: awareness, community, or action, and only include the metrics tied to that goal, since reporting every available number without a goal produces noise instead of insight.
- Meta has renamed Facebook reach to "viewers" and impressions have turned into views, so a sudden change in reach or impressions in historical reports usually reflects Meta's metric redefinition, not an actual performance shift.
- Facebook metrics such as engagement rate, follower growth, and content pillar performance become particulalrly actionable when compared against competitor benchmarks.
- Weekly Facebook reporting should track post-level engagement rate, comments, response time, and video watch time, while monthly reporting should track follower growth rate, engagement rate by reach, audience demographics, and competitive benchmarks.
Goal-first vs. metric-first tracking: how to set up correctly
The right way to track Facebook metrics starts with your goals, not with whatever numbers your dashboard happens to show you.
It sounds obvious, but I’ve seen this reporting mistake more than once. Someone opens their social media analytics, sees twenty metrics staring back at them, and starts pulling whichever ones look impressive that week. Convenient, but not really helpful.
The right way to do it is to start with goals. Decide what you're trying to accomplish with your social media strategy, then measure and report on the Facebook metrics that actually help you advance that goal.
Katie McKiever explained this principle in practical terms:
You should track the metrics that connect back to the actual goal of the content. If the goal is awareness, look at views and follower growth. If the goal is community, look at comments, shares, reactions, saves, and direct messages. If the goal is action, look at clicks, conversions, and what people do after they leave Facebook.
More on metrics in the following sections, but before that, a warning from Katie:
The biggest mistake is reporting every number available without explaining what it means. Metrics should help tell the story of whether your content is reaching the right people, resonating with them, and moving them toward action.
How Meta's metric deprecations have changed what you can reliably track
You might have noticed that Meta has renamed and restructured several of its core Facebook metrics. The biggest change is that reach no longer exists in its original form.
Meta now measures Facebook reach as "viewers" instead, folding it into a broader definition of who actually saw your content rather than how many times it was served.
Facebook analytics tools like Socialinsider have already adapted to this change. In the app, you can still see this metric as Reach, but there is a note about the underlying change: "This metric is now powered by Meta's Viewers." Same concept for your reporting purposes, different name and methodology on Meta's end.
Facebook impressions have gone through a similar shift, essentially folding into views. If you've been tracking impressions as a separate line item from video or content views, that distinction has largely disappeared on Meta's side.
A lot of historical benchmarks and reporting templates were built around the old definitions. If your reports show a sudden change in reach or impressions and nothing in your content strategy changed, the metric definition might be the culprit.
Facebook metrics by marketing goal
Your Facebook metrics report should look different depending on what you're trying to accomplish. As mentioned before, grouping them by goal makes it far easier to build a useful report.
Katie McKiever sums up her current priorities this way:
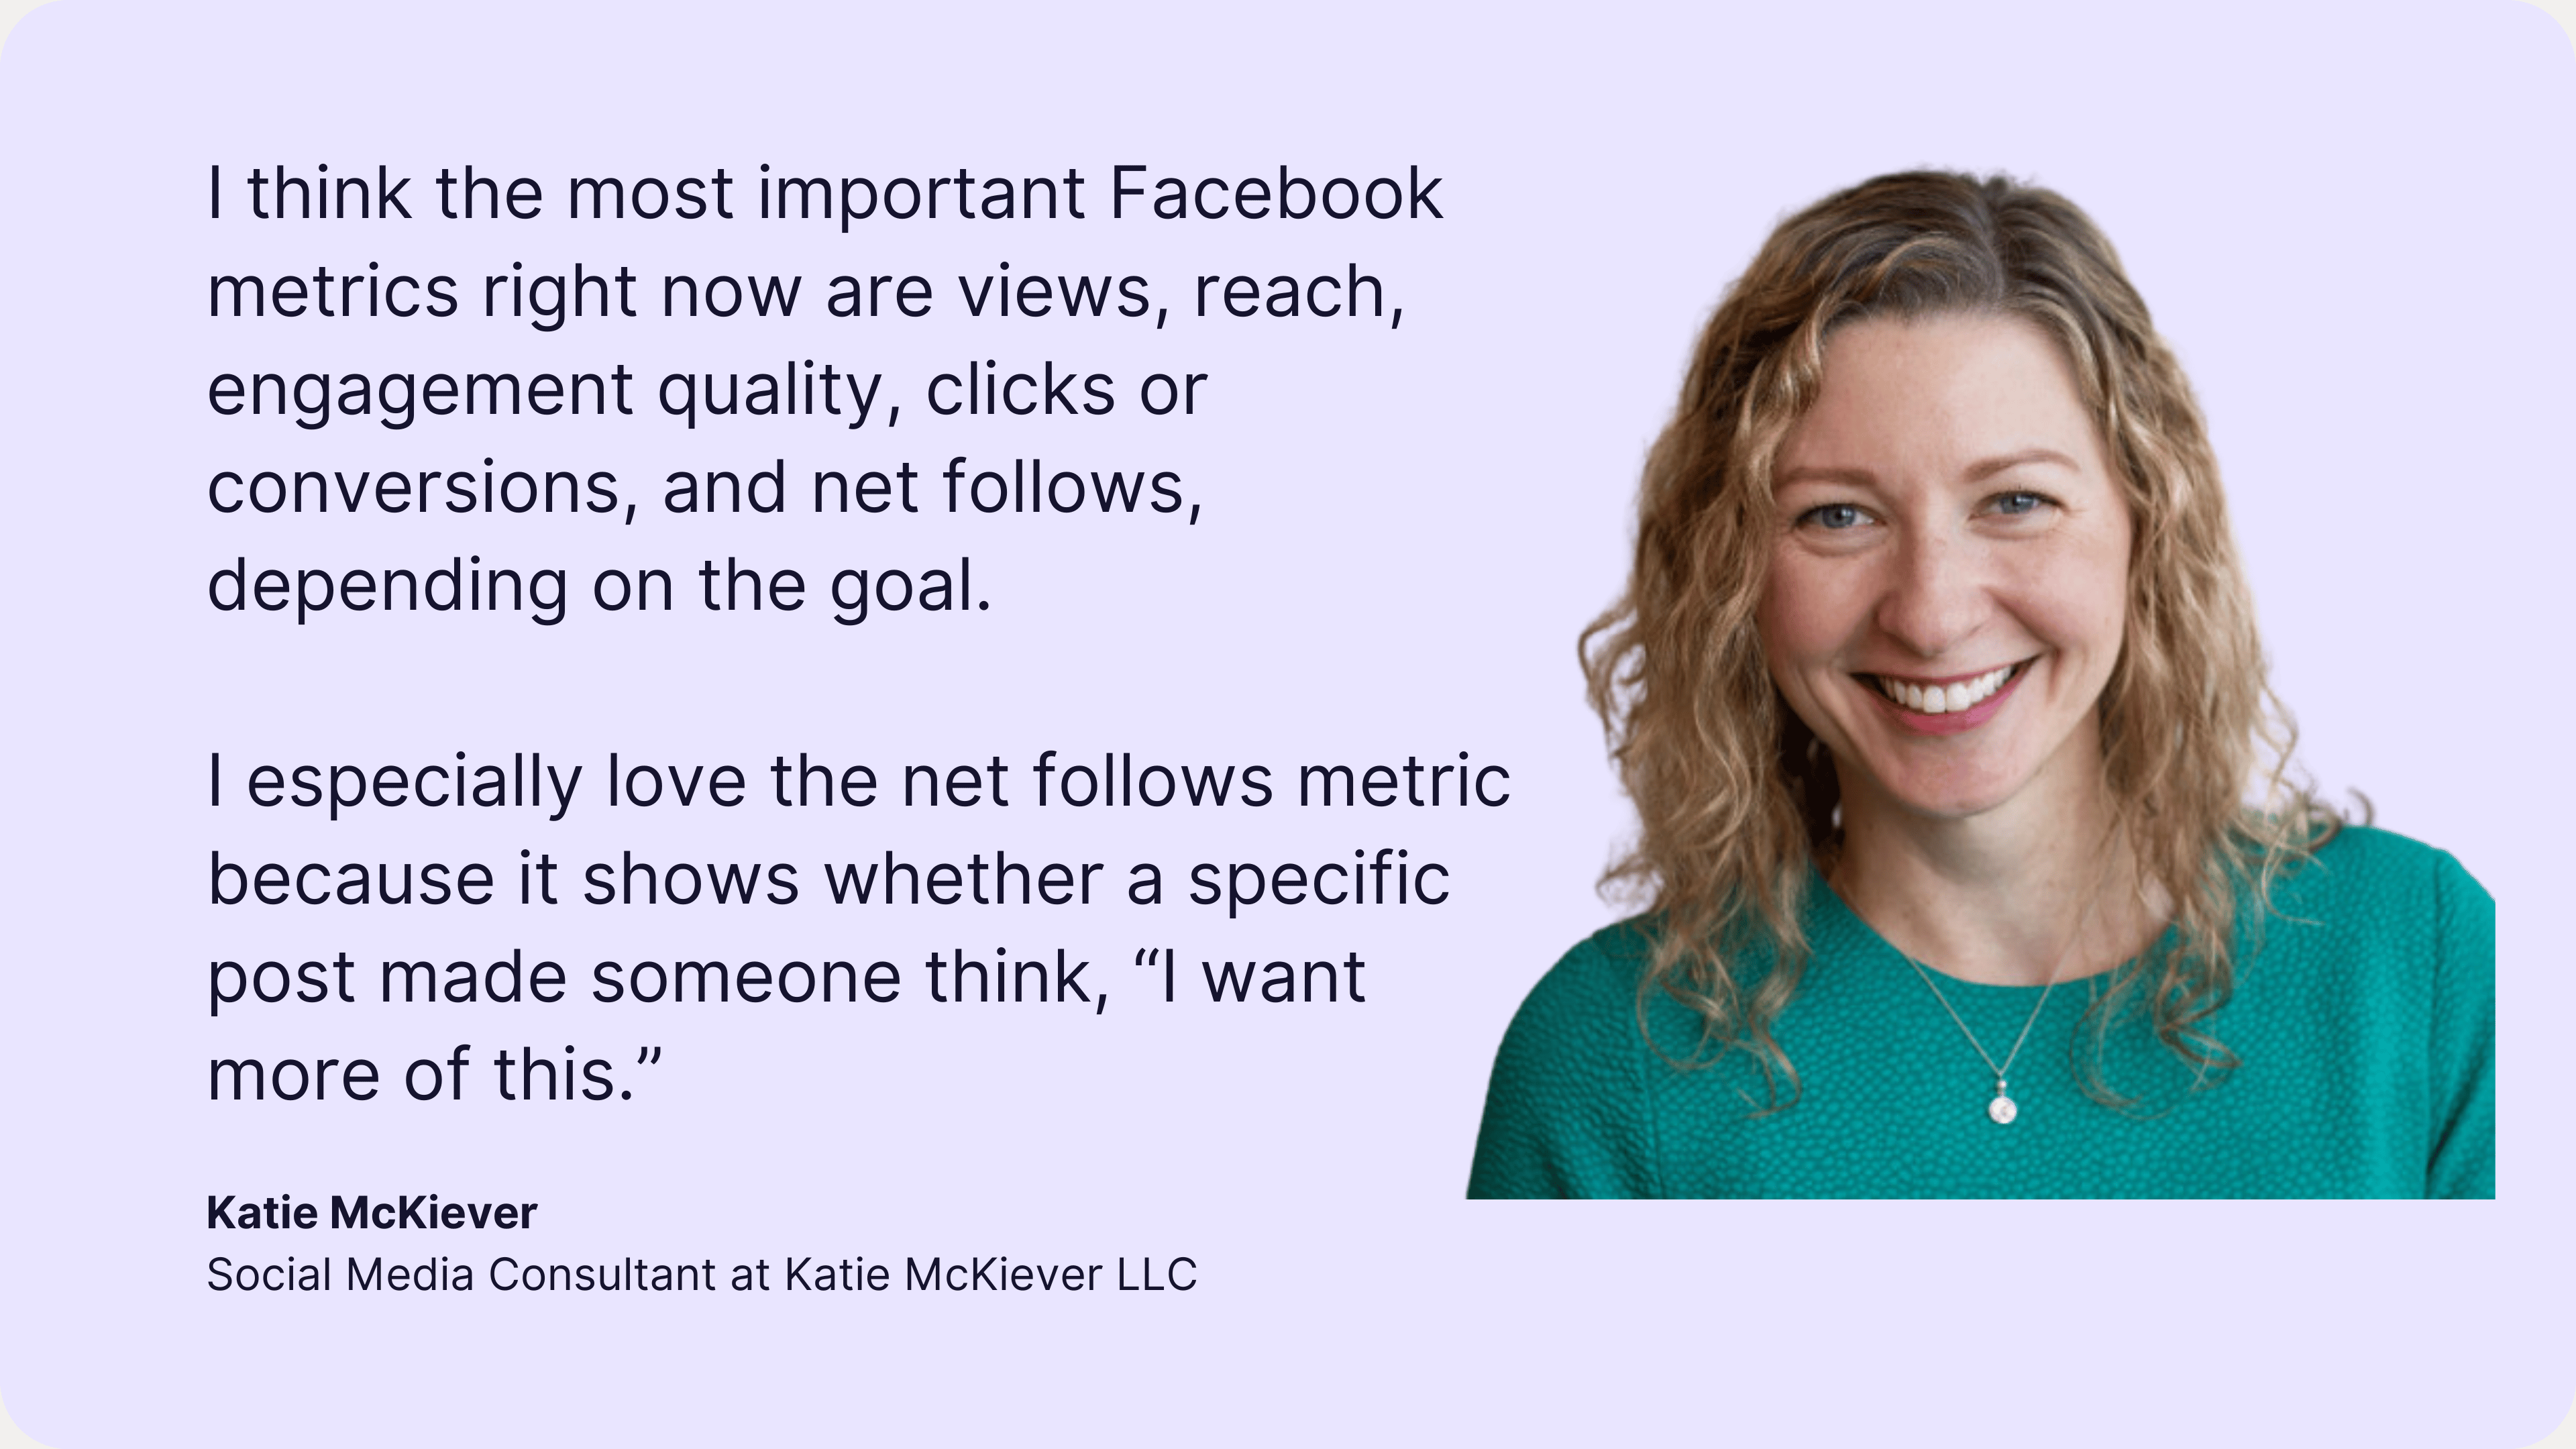
I think the most important Facebook metrics right now are views, reach, engagement quality, clicks or conversions, and net follows, depending on the goal... Views can tell you something was seen, but net follows can help tell you whether it was valuable enough for someone to want to stay connected.
Here’s a quick cheat sheet to what to measure depending on your social media goals:
Brand awareness goals
Awareness goals are best measured by how many people saw your content and whether that audience is growing over time.
- Reach (now measured as viewers): how many unique people saw your content
- Impressions (now folded into views): total times your content was displayed
- Follower growth rate: the pace at which your audience is expanding
- Share of voice: your visibility relative to social media competitors in the same space
Audience growth goals
Audience growth goals focus less on raw visibility and more on whether new people are actually joining your page.
- Net new followers: raw follower gain in a period
- Reach from non-followers: an indicator of how much new audience your content is pulling in
- Top posts by reach: which content format or topic attracts new eyeballs
Engagement and community goals
Engagement and community goals are best measured by how people interact with your content, not just how many saw it.
- Engagement rate by reach: the most accurate signal of how resonant your content is
- Reactions breakdown: tracks sentiment, since love, haha, and angry reactions carry different signals than a generic like
- Comments volume and comment rate: the highest-intent engagement signal, showing real conversation
- Shares: an amplification indicator; content worth sharing has strong organic growth potential
- Response rate and response time: for brands managing community, these show how active and trustworthy the page feels to followers
Website traffic goals
Traffic goals live or die on whether people actually click through from Facebook to your site.
- Link clicks: a direct count of users clicking through to your site from a post
- Click-through rate (CTR): link clicks divided by impressions, telling you how compelling your copy and creative are
- Link click rate by post type: helps identify whether video, carousel, or static drives more traffic for your audience
- Referral traffic from Facebook (in Google Analytics / GA4): cross-validates what Meta reports and shows downstream behavior
- Bounce rate from Facebook traffic: tells you whether the audience quality matches the page intent
Conversion goals
Conversion goals require looking past engagement entirely and focusing on what happens after someone takes action.
- Conversion rate: the percentage of people who clicked and completed the desired action, whether that's a form fill, purchase, or sign-up
- Cost per result (paid): how efficiently your ad spend is generating the target action
- ROAS (Return on Ad Spend): revenue generated per dollar spent on Facebook ads
- Lead form completion rate (for Facebook Lead Ads): measures how well your in-platform lead forms convert
- Frequency: how many times the same person has seen your ad; high frequency with low conversion signals creative fatigue, and it's a common silent campaign killer
Essential Facebook page metrics
Every Facebook page metric worth tracking falls into one of a few core categories: how many people saw your content, how often, and how well it’s performing to attract new followers. Here are some Facebook best practices for choosing the right metrics.
Facebook reach
Reach tells you how many unique people saw your content, and it remains one of the clearest signals of whether your page is getting noticed.
Since Meta folded reach into its "viewers" metric, the underlying idea hasn't changed: it's still about unique views, not repeat impressions from the same person.
Reach should be paired with engagement for meaning. A high reach with low engagement means your content got in front of people but didn't land. A modest reach with strong engagement often means the opposite: your content is hitting the mark and will eventually lead to growth.
While metrics are tracked individually, they often need context to turn them into insights.
Facebook impressions
Impressions measure the total number of times your content was displayed, counting repeat views from the same person as well as new ones. So, one person scrolling past your post three times counts as three impressions but only one unit of reach.
For example, a high impressions-to-reach ratio can mean your content is showing up repeatedly to the same core audience, which is worth knowing whether you're trying to build familiarity or trying to expand into new audiences entirely.
Follower growth rate
Follower growth rate on Facebook measures how quickly your page is gaining followers relative to its existing size, and it's one of the metrics most likely to swing based on a handful of standout posts rather than steady, predictable growth.
That volatility shows up clearly once you're tracking it over time. In the Socialinsider audience view, net follower growth moves in visible waves, with periods of decline followed by a sharp climb around a specific post or campaign, then a leveling off again. Growth rarely moves in a straight line, and a dashboard that tracks it week over week makes those patterns easy to catch instead of guessing at them from memory.

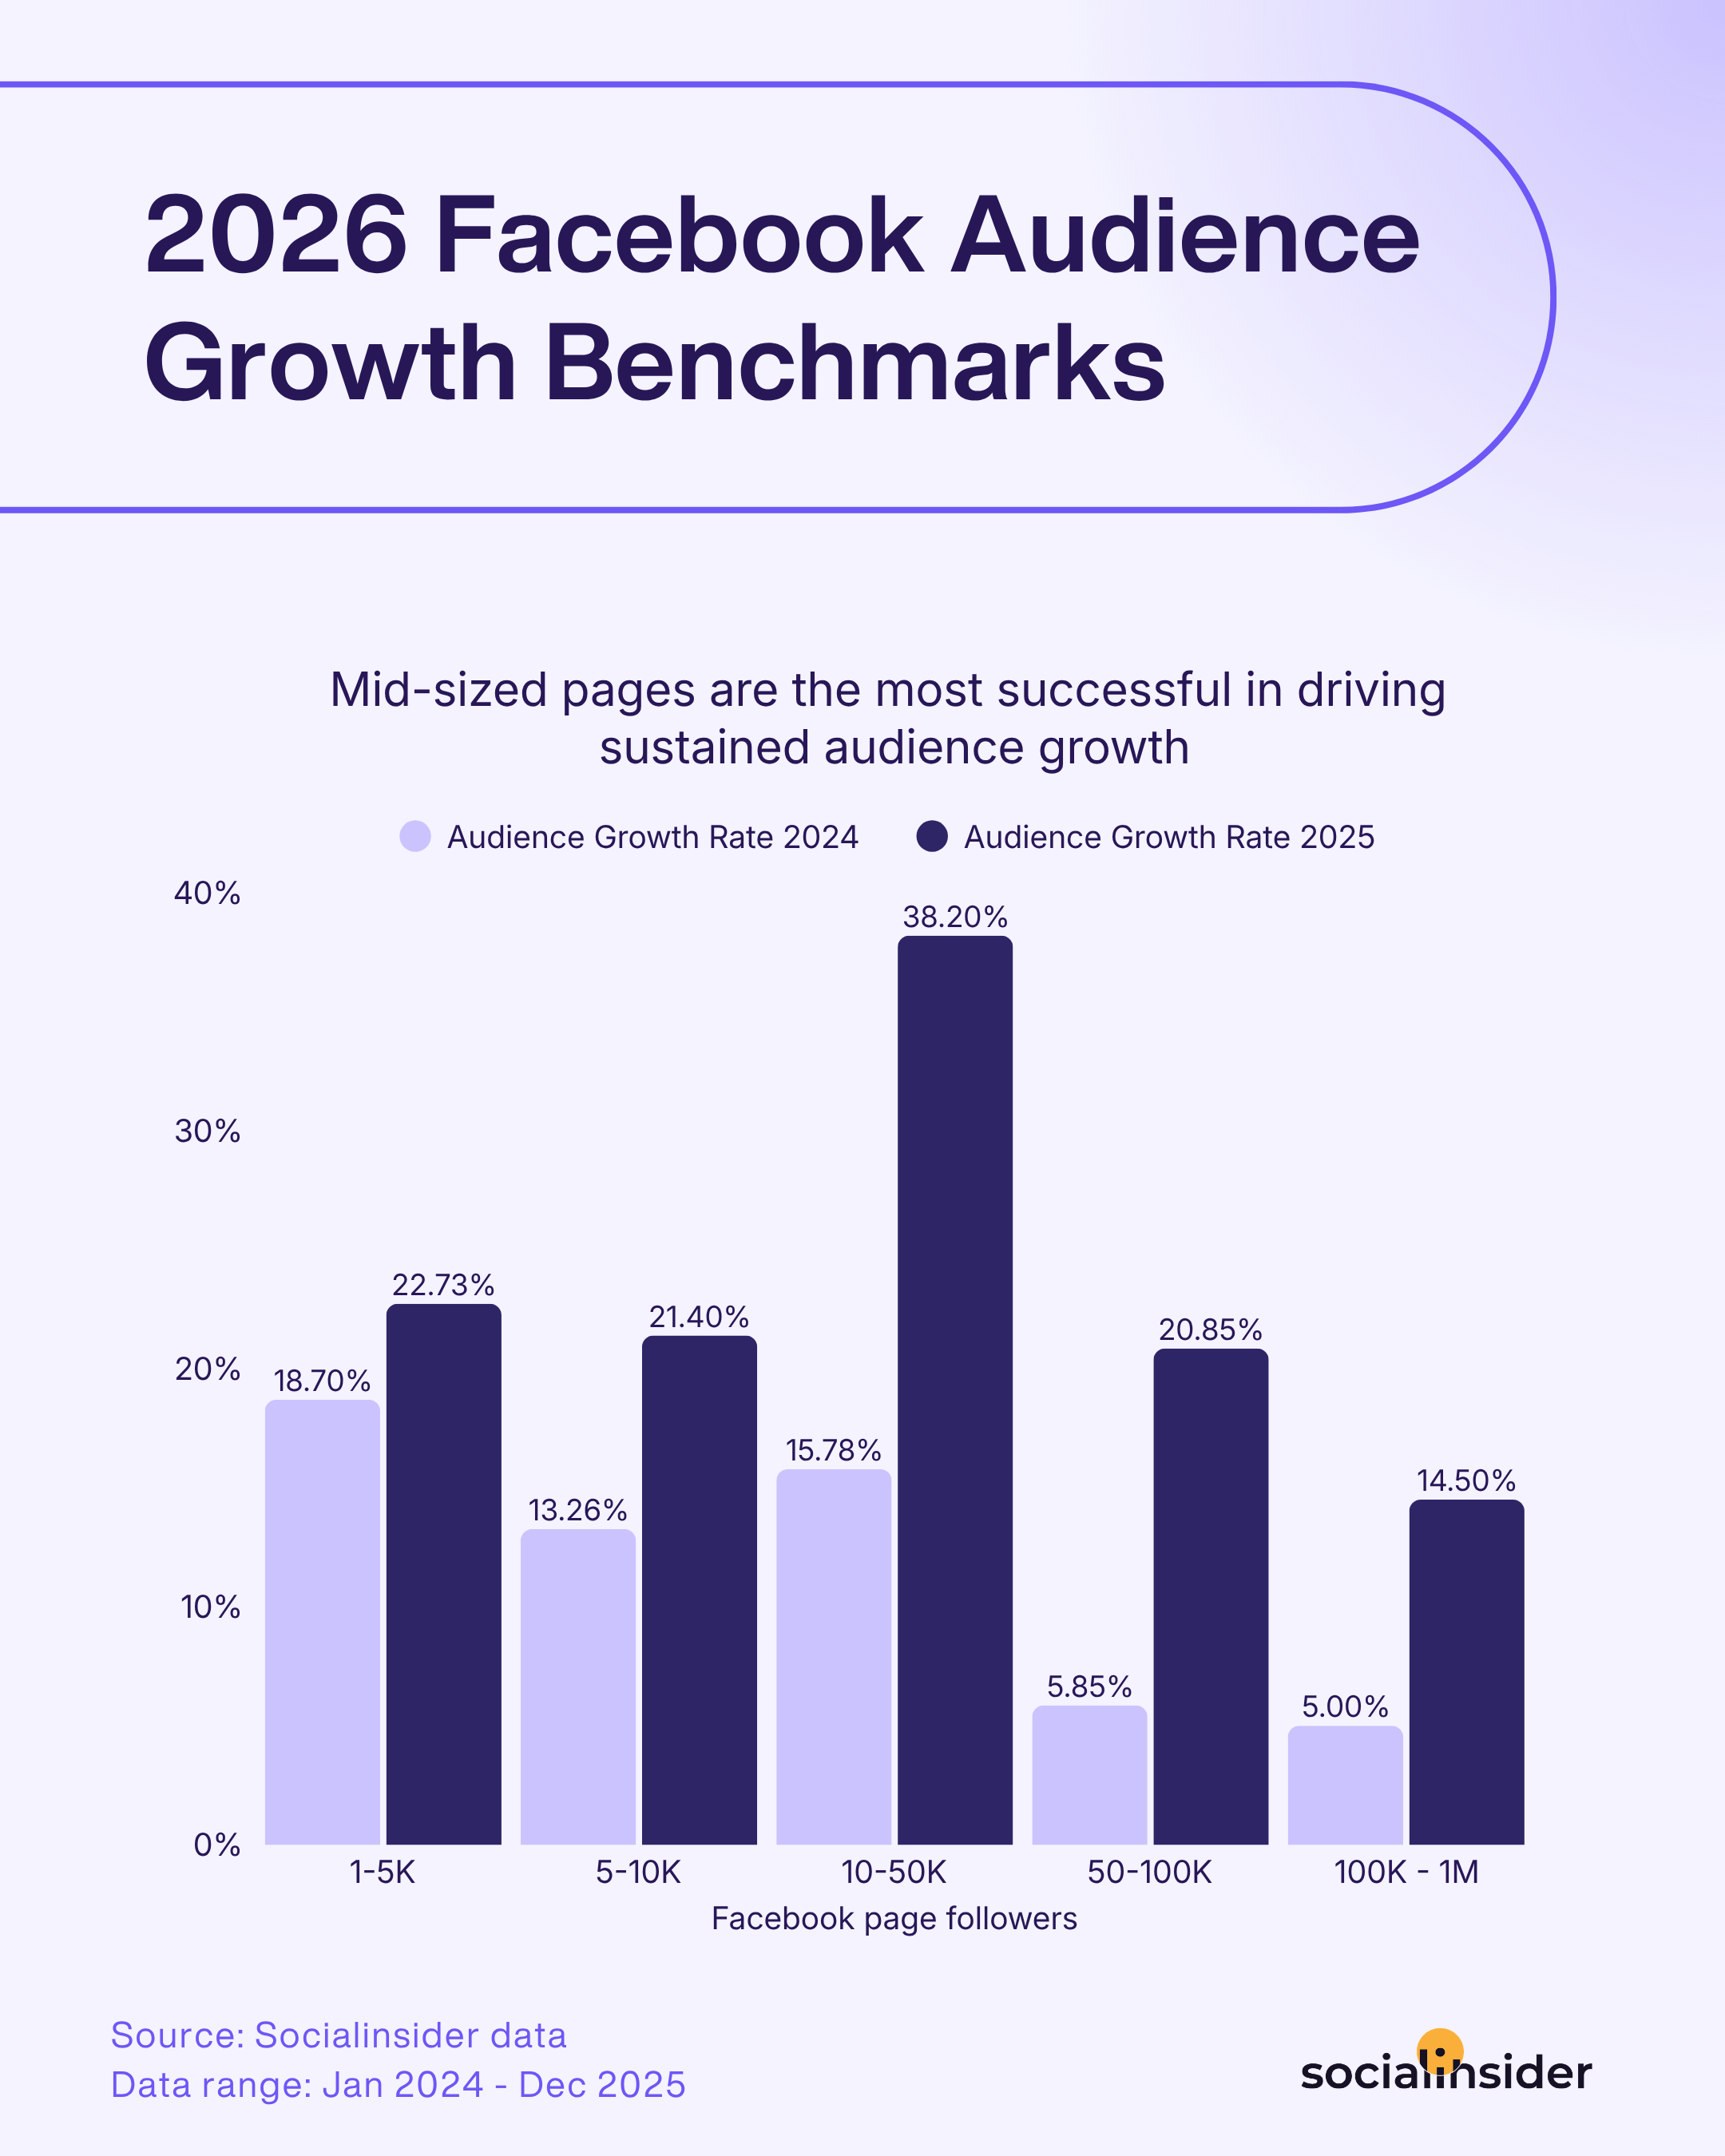
So what counts as a healthy follower growth rate right now? It depends on your page size. According to Socialinsider’s 2026 Facebook Benchmarks report, mid-sized pages tend to see the strongest sustained growth, often outperforming both very small and very large pages by a wide margin.
Smaller pages in the low thousands of followers also see solid gains, while pages already sitting above 100K followers typically grow at a slower, steadier pace.
Overall, there’s good news: growth rates across the board have climbed noticeably year over year.
Facebook post & engagement metrics
Engagement metrics tell you whether people are actually reacting to your content, not just scrolling past it. Let’s look at what’s worth tracking separately.
Engagement rate by followers vs. by reach: which formula to use and when
Engagement rate by reach is the more accurate formula for judging how resonant a specific post is, while engagement rate by followers is better for tracking overall page health over time.
The difference comes down to how you calculate the engagement rate:
- Engagement rate by followers divides total engagement by your follower count, which stays fairly stable and works well for comparing performance month over month.
- Engagement rate by reach divides engagement by the number of people who actually saw the post, which gives you a truer read on whether the content itself performed well, independent of how many people it reached.
In the Socialinsider dashboard, you can see both formulas calculated side by side alongside total, paid, and organic engagement, plus a daily engagement trend that shows clear spikes tied to specific posts rather than steady, even activity.

If you're only going to track one of these consistently, my recommendation is to choose engagement rate by reach, which tends to paint a more honest picture, since it isn't inflated or deflated just because your follower count changed.
Reactions, comments, shares: what each type signals
Reactions, comments, and shares each tell a different part of the story about how people are responding to your content:
- Reactions are the lowest-friction response, so a spike in reactions alone tells you a post caught attention but not much about how strongly people felt about it.
- Comments carry far more intent. Someone stopping to type a response, ask a question, or share an opinion is investing more than a click ever requires.
- Shares sit at the top of the amplification ladder, since a share puts your content in front of an audience you didn't reach directly.
Comment and share activity often cluster around a small number of standout posts rather than spreading evenly, as shown in the Socialinsider engagement view below.

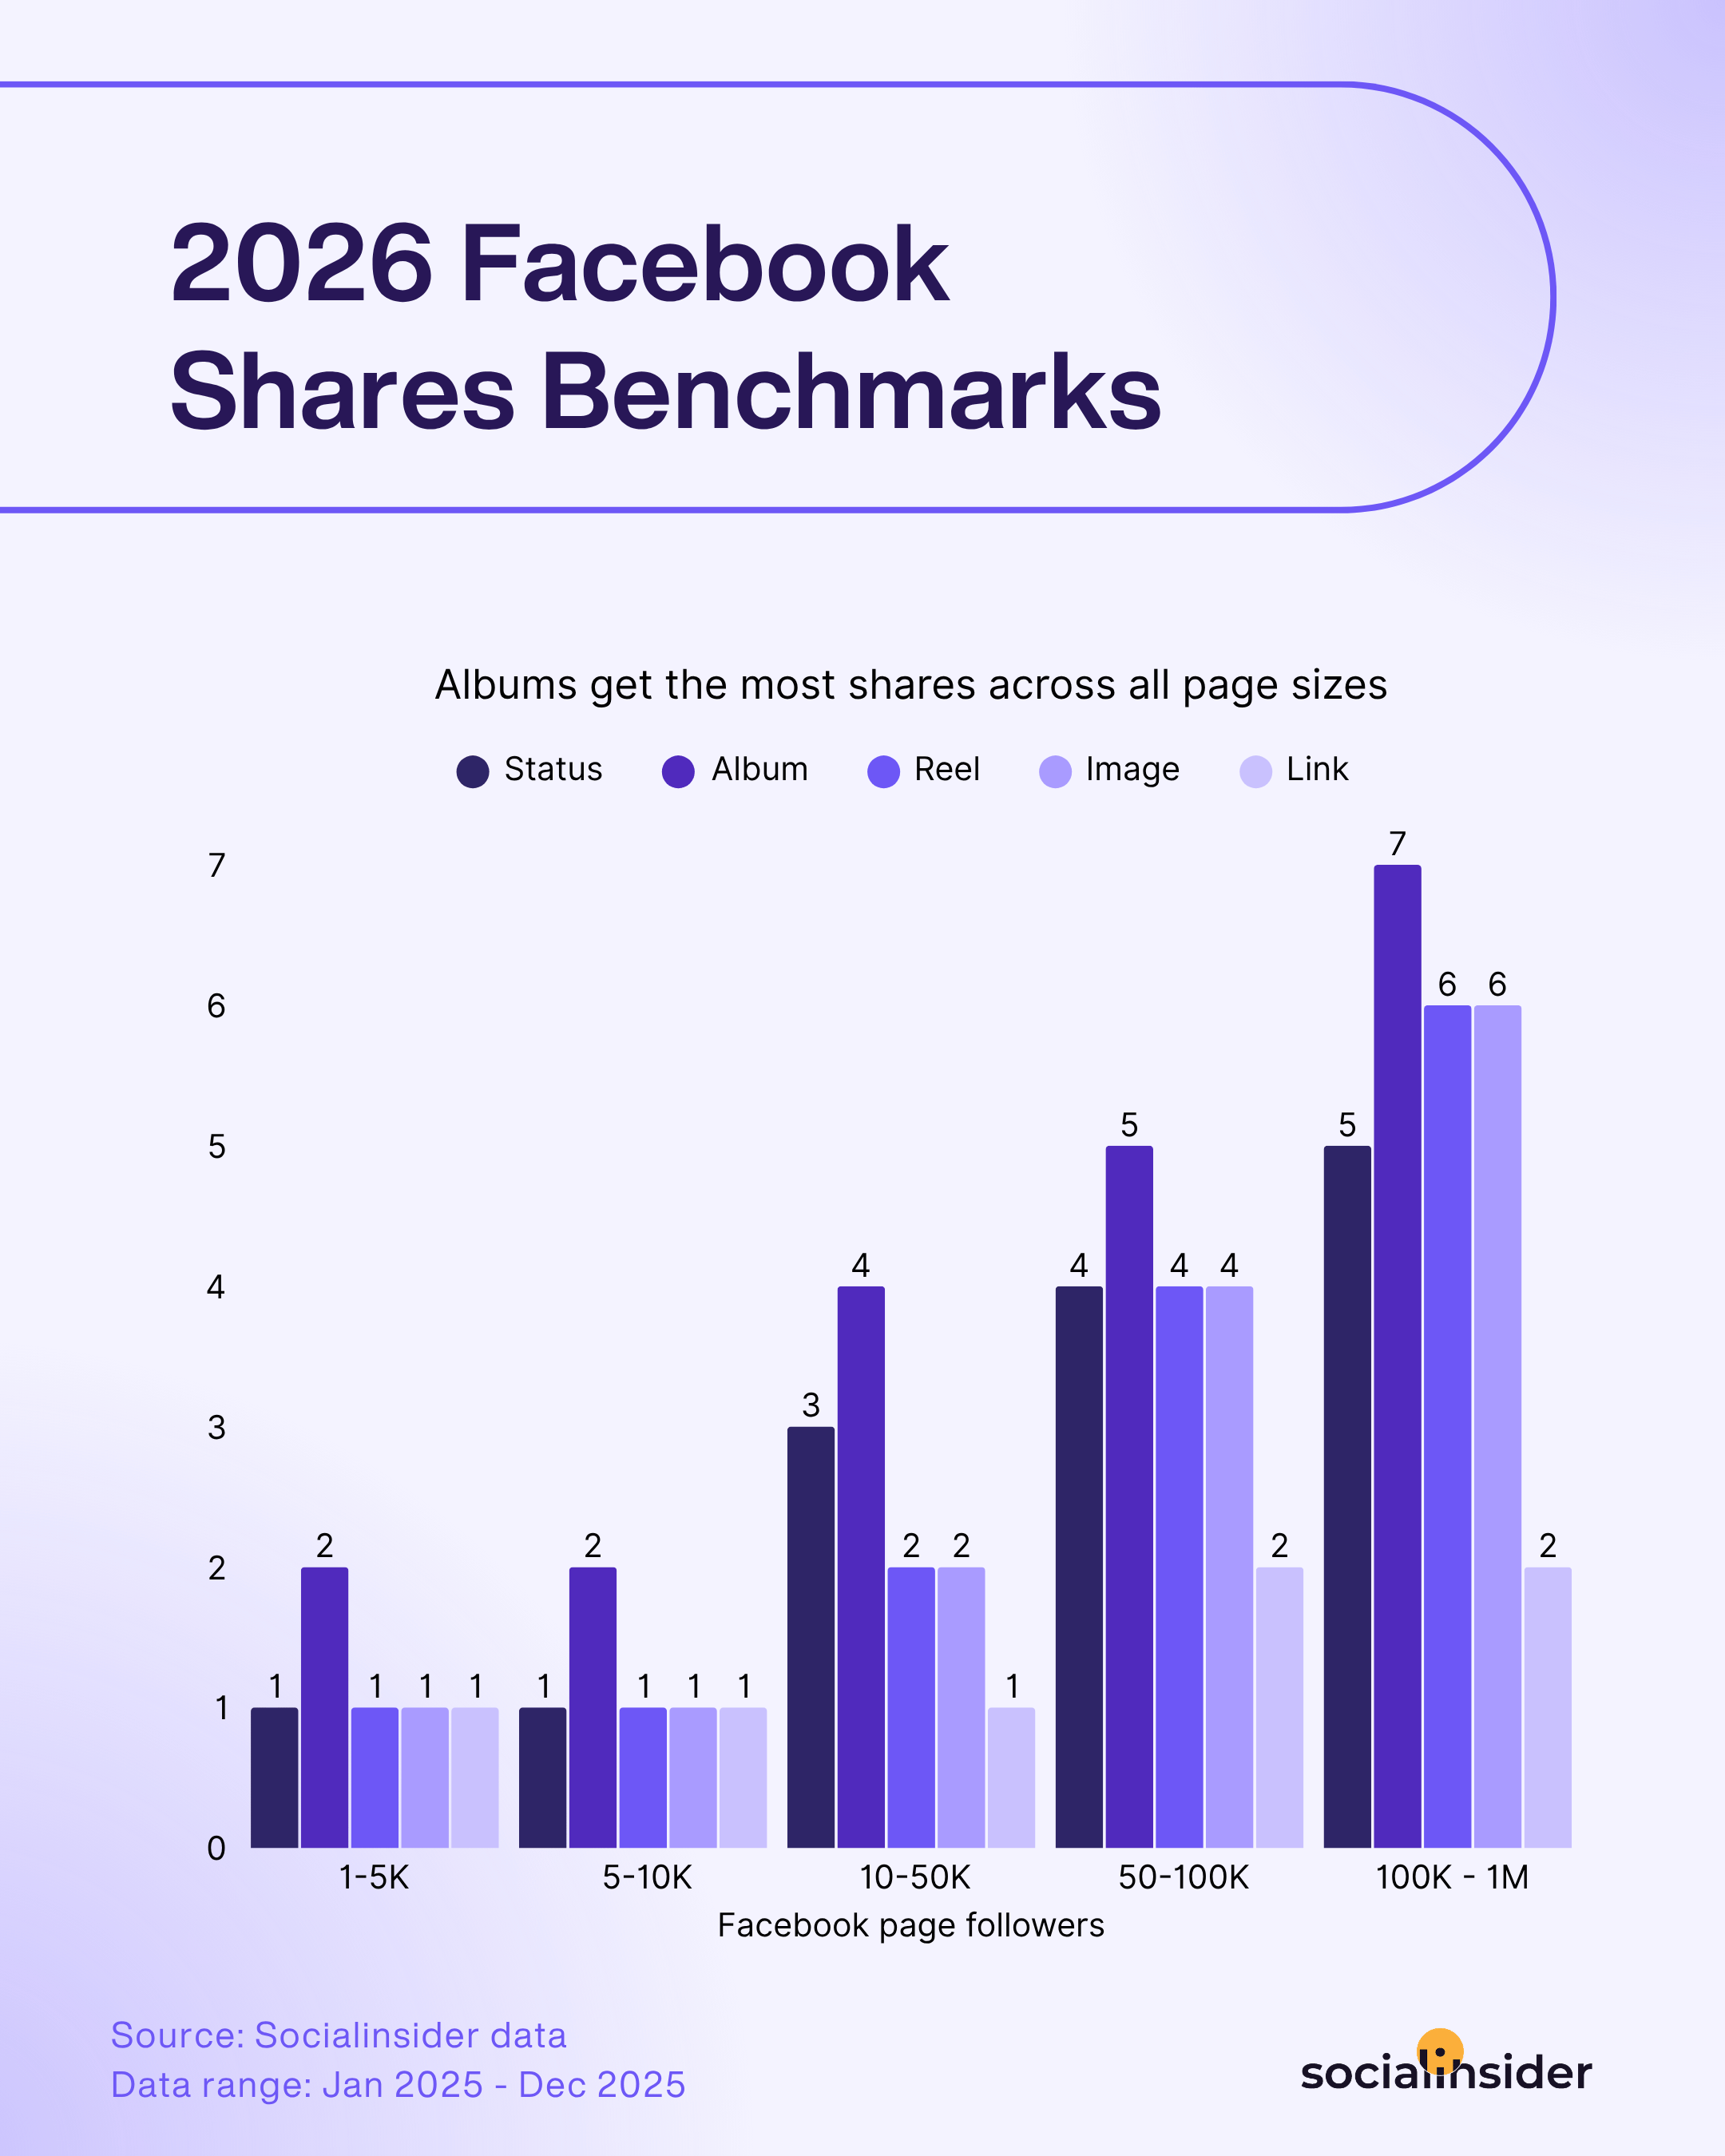
If you’re looking to improve your social media engagement strategy, Socialinsider’s benchmarks come in handy. Recent Facebook data shows that status posts consistently drive more conversation than other formats across page sizes, while albums tend to pull in the most shares.
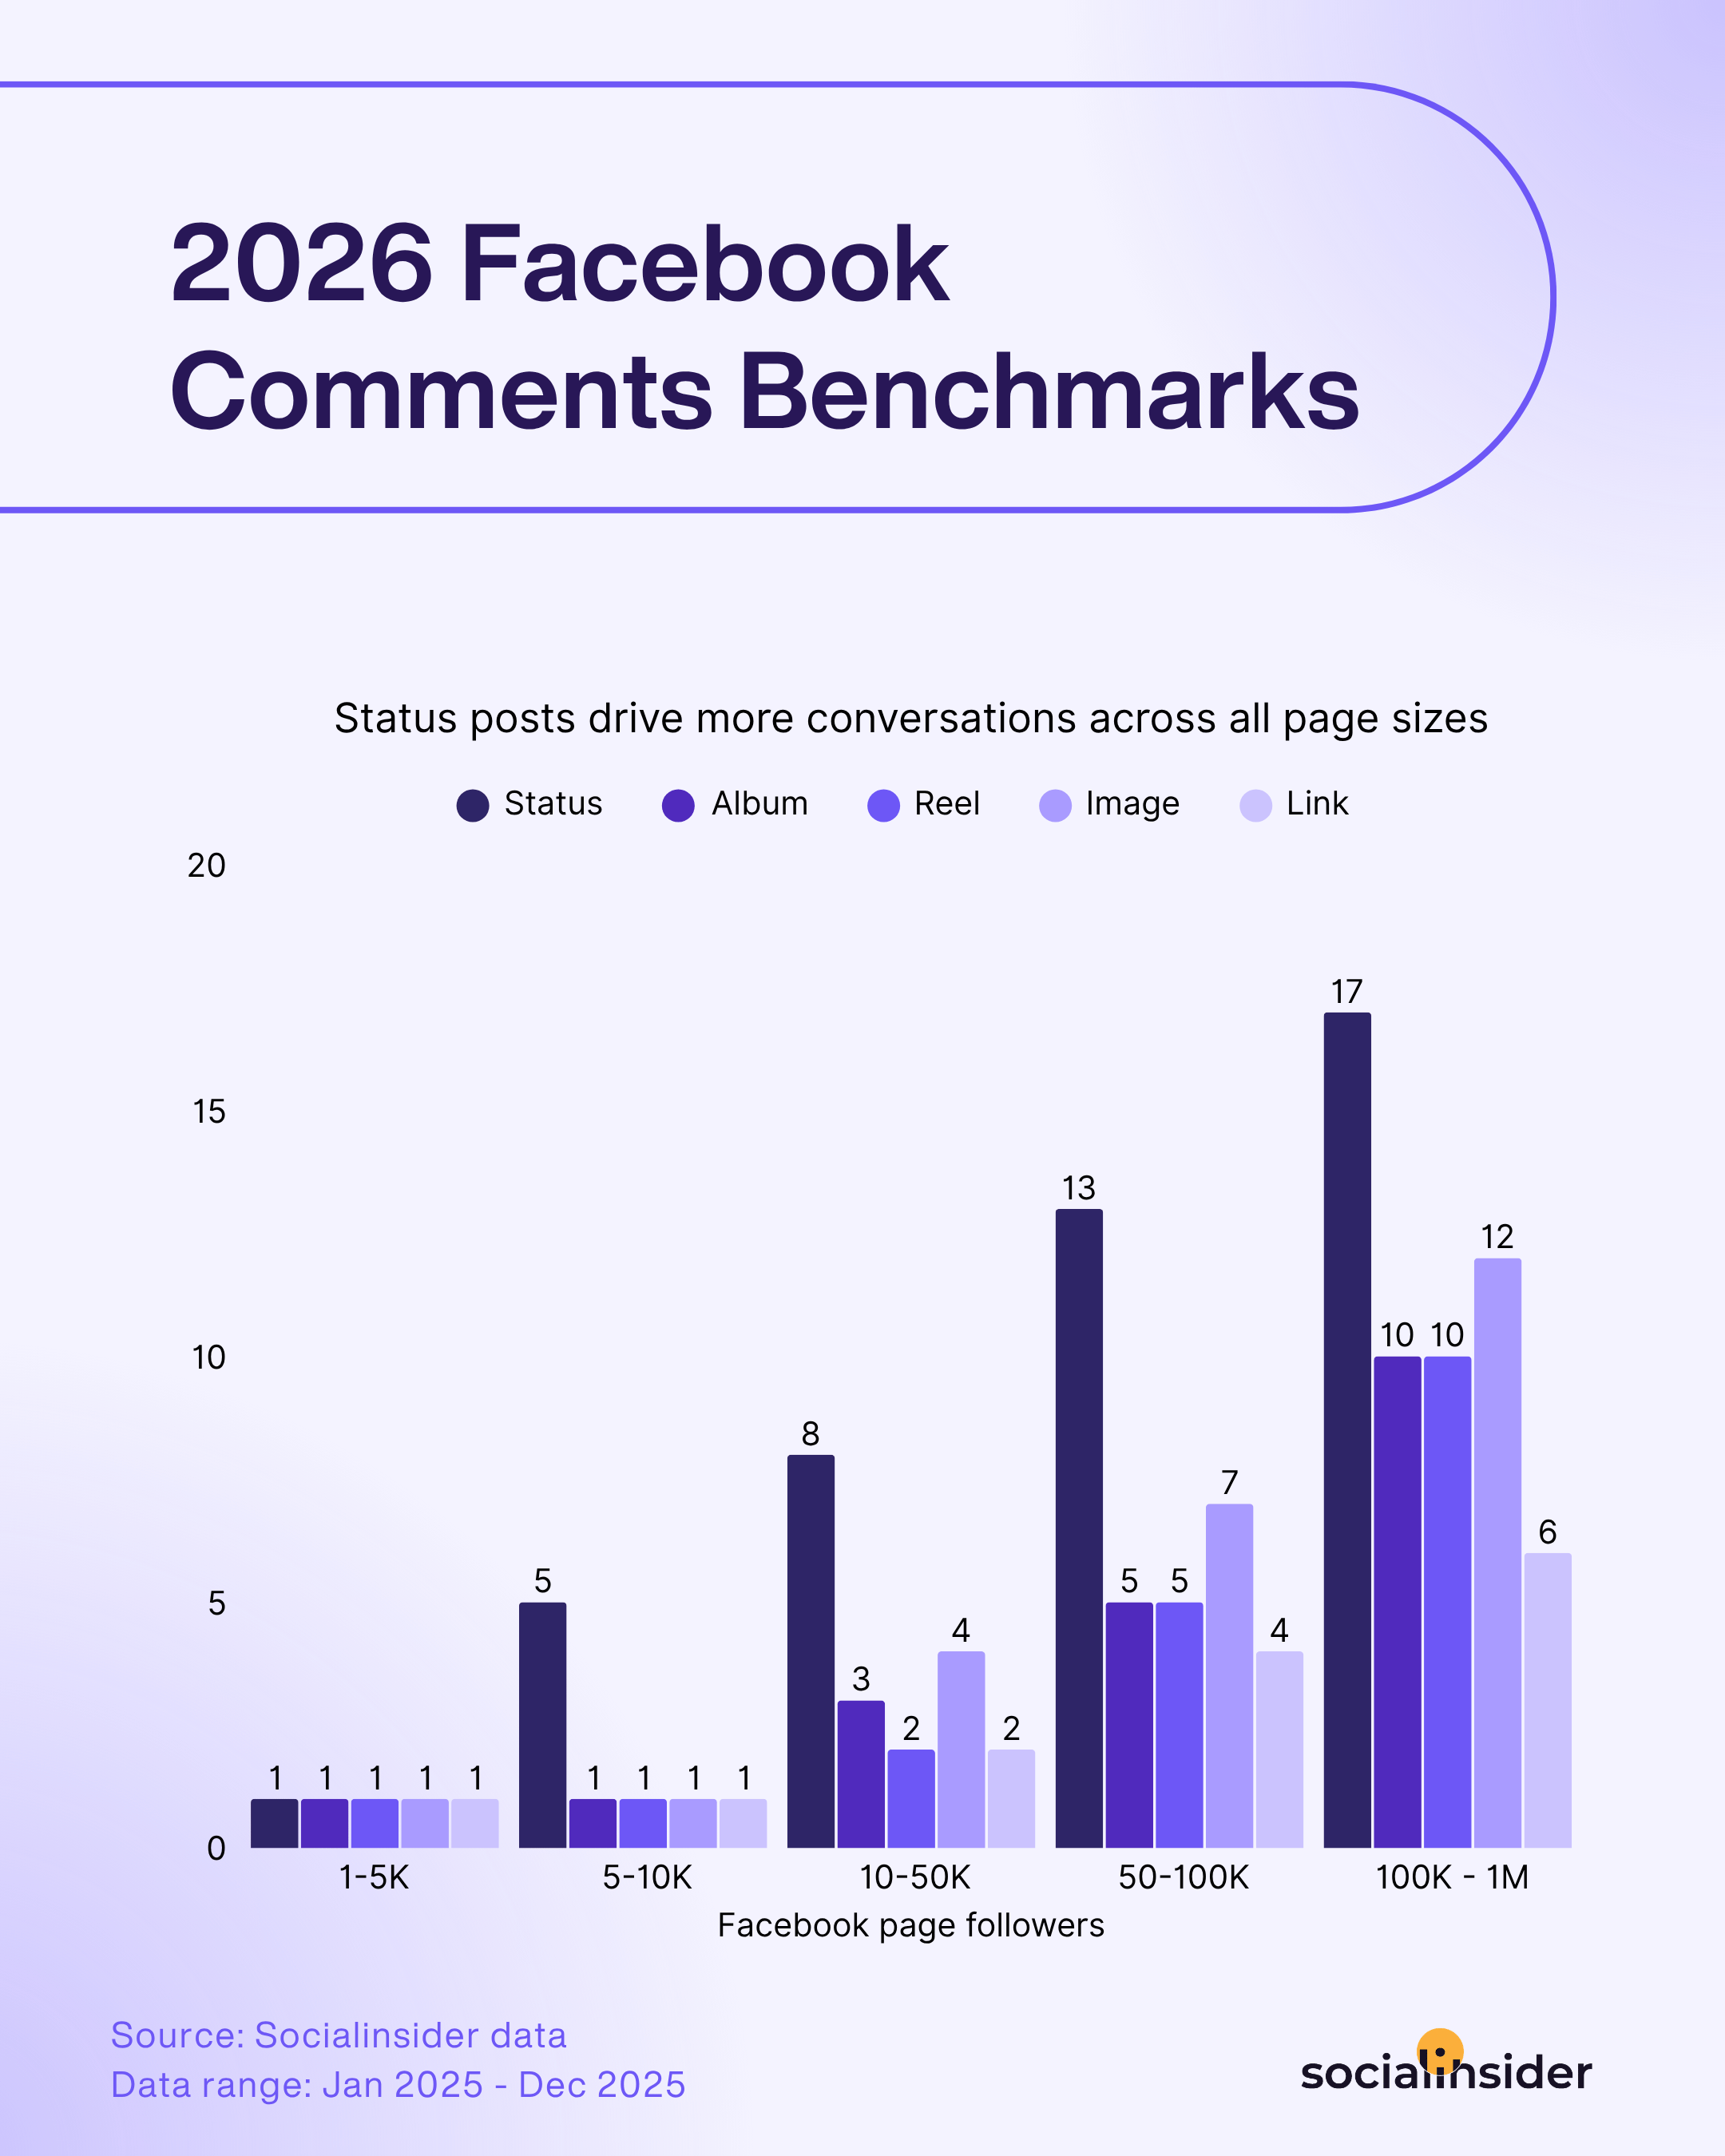
That pattern holds fairly steady whether a page has a few thousand followers or sits well into six figures, which is useful context if you've been assuming video or image posts should automatically outperform simpler formats on these specific metrics.
Katie McKiever, social media and communication specialist, explains why the metric breakdown matters:
I look at the numbers, but I'm also reading the comments, looking at the tone of the conversation, noticing what questions keep coming up, and paying attention to what people seem excited, confused, or frustrated by. Sometimes a post with lower views can still be incredibly valuable if the right people are engaging with it.
Saves and clicks: the undertracked engagement signals
Post clicks and saves often get overlooked in favor of reactions and comments, even though they can be the clearest signal of community engagement.
- Clicks mean someone wanted more information badly enough to act on it, whether that's expanding a photo, opening a video, or following a link.
- Saves mean something even more specific: someone found the content valuable enough to want to come back to it later, which is a different kind of endorsement than a quick like.
Click activity tends to spike around the same posts that drive comments and shares, as shown below, which can give you important clues. For example, if a post is generating clicks but no comments or shares, it may be functioning more as a utility (information, an offer, a link) than as conversation-starting content.

Next, I’ll walk you through a content format that deserves its own metric category.
Facebook video metrics
Video performance requires its own set of Facebook metrics. You might have noticed that a video that gets a lot of views can still fail to hold attention, and a video with modest reach can still perform exceptionally well once someone starts watching. So, let’s look at key video metrics and how you can interpret them to improve your Facebook strategy.
Reach and engagement rate
Reach and engagement rate for video content work the same way they do for any other post type, but they carry more weight here because video asks more of the viewer than a static post does.
A post's individual metrics panel brings this together clearly. In the Socialinsider view below, a single video shows reach, views, engagement rate by followers, by reach, and by views all sitting side by side, along with likes, comments, and shares for that specific post.

Looking at engagement rate by reach specifically matters more for video than for static posts, because reach tells you how many people the video was served to, while engagement rate tells you whether those people did something once it played. A video with strong reach but a flat engagement rate by reach is getting distribution without payoff, which is worth optimizing before you put budget behind more of the same format.
Total plays and replays
Total plays count every time your video was played, including multiple plays from the same viewer, while replays isolate how many of those plays came from someone watching the same video again.
A high replay count relative to total plays suggests the content got a second watch, whether that's because it was entertaining, informative enough, or dense enough that people needed another pass to catch everything. In the post breakdown shown earlier, replays sat at a meaningful share of total plays, which is a stronger signal of quality than the raw play count alone.
If plays are climbing but replays stay flat across most of your video content, that's a sign the videos are forgotten, not building the kind of repeat interest that compounds over time.
Average watch time and retention
Average watch time tells you how long, on average, people stuck around before dropping off, and retention shows you exactly where in the video that drop-off happens.
Together, these two numbers are valuable. Average watch time gives you a single number to track over time, but the retention curve shows whether viewers dropped off in the first few seconds, held steady, or lost interest right before the payoff.
If retention consistently drops sharply in the first two or three seconds across your videos, the issue is usually the opening hook. If the drop happens later, closer to the middle or end, the pacing or length is more likely the culprit.
For a deeper look at how views and engagement diverge across formats, it's worth checking views vs. engagement as a broader framework.
Facebook audience & demographic metrics
Facebook audience metrics are important to understand not only how many people are following your Facebook page, but who they are and if they fit your ideal client profile.
Audience growth and net new followers
Total follower count and net new followers together show whether your page is growing or simply holding steady with some churn.
A flat total follower count can hide a lot of movement. You might be gaining a steady stream of new followers while losing a similar number elsewhere. Understanding how to properly track this over time starts with knowing how to calculate follower growth in a way that accounts for both gains and losses, not just the net number.
In the Socialinsider audience view below, the total climbs gradually before leveling off and dipping slightly, then recovering again. That kind of movement is normal, but it's only useful information if you're watching the trend rather than glancing at a snapshot.

Katie McKiever told me why net follows is one of her favorite signals for exactly this reason:
I especially love the net follows metric because it shows whether a specific post made someone think, 'I want more of this.' To me, that's powerful. If someone clicks follow directly from a post, that's a clear signal that the topic, format, or message landed.
Fan demographics (age, gender, location): how to use them for targeting
Fan demographics show you the age, gender, and geographic breakdown of your audience, and they're most useful when you check whether they match who you're creating content for.

The geographic distribution matters for content optimization, but also for posting time customization. Your posting schedule should be built to account for different time zones.
The same applies to age and gender splits. Content built around assumptions about who's watching can miss the actual audience by a wide margin once the demographic data is checked against it.
Facebook ads metrics
I’ve been focusing mainly on organic Facebook performance so far, but Facebook ad performance depends on a different set of metrics. What counts as cost-efficient here depends on your industry, objective, and funnel stage. Let’s break it down.
CPM, CPC, CTR and definitions and what "good" looks like
CPM, CPC, and CTR each measure a different part of how efficiently your ad spend turns into attention, and none tells the full story alone.
- CPM (cost per thousand impressions) shows what you're paying to get seen, regardless of clicks. CPMs often range from $5–15 on Meta, compared to a higher $30–60 on LinkedIn.
- CPC (cost per click) shows what each click costs once someone acts. Averages are around $1–3 on Meta, depending on market and objective, similar to averages on TikTok or YouTube. For comparison, CPC is around $5–8 on LinkedIn.
- CTR (click-through rate) connects the two, showing what percentage of viewers actually clicked. As a broad rule of thumb, a CTR of 1-1.5% is considered good on Meta, which is higher than the 0.5–1% average for LinkedIn, but lower than the typical 2% plus on TikTok.
A low CPM with a low CTR often means your ad is cheap to show but not compelling enough. A higher CPM with a strong CTR can still be more cost-efficient once you factor in CPC. "Good" varies too much by industry to compare against a generic benchmark, so comparing against pages similar to yours paints a better picture.
Conversion rate and cost per result
Conversion rate measures the percentage of people who clicked and completed your intended action, while cost per result shows how efficiently your spend produced that outcome.
A campaign can have a strong CTR and still underperform if conversion rate is low. It’s usually a sign of mismatch between the ad's promise and the landing page or offer. Cost per result puts a dollar figure on the outcome, making campaigns easier to compare even across different audiences or formats.
Katie McKiever's framing on choosing metrics by goal applies directly here: "If the goal is action, look at clicks, conversions, and what people do after they leave Facebook."
ROAS: how to set a baseline for your industry
ROAS (return on ad spend) measures revenue generated per dollar spent, and it's the metric most directly tied to whether a campaign is worth continuing.
A useful baseline starts with your margins. A 4x ROAS might be excellent for a thin-margin business and still fall short for one with lower cost of goods.
Strong organic engagement tends to make paid campaigns more efficient too, since the audience already has some familiarity with the brand before the ad reaches them.
How to benchmark your Facebook metrics against competitors
Facebook metrics mean little without something to compare them against. A 3% engagement rate could be excellent or mediocre depending entirely on your niche. So, look at numbers next to a competitor's numbers to understand where you stand.
Overview performance metrics
Comparing overview metrics against a competitor is the fastest way to see whether your Facebook page is keeping pace, gaining ground, or falling behind.
Socialinsider’s competitive benchmarking feature puts pages side-by-side to compare followers, growth, posts, and engagement rates in one view. The example below highlights how context matters: one page posts heavily with low return and dropping followers, while a less frequent poster yields far better engagement per follower. High volume with low reach requires a completely different fix than a low-volume, high-efficiency strategy.

Here’s Katie McKiever's take on competitive data:
It's helpful to know what competitors or peer organizations are posting, what's earning engagement, what topics keep showing up, and where there may be gaps. But the goal is not to chase what everyone else is doing. Competitive insights can inform the strategy, but your own audience, goals, and voice still have to lead it.
Content pillars analysis and top posts
Looking at top-performing posts and content pillars shows what topics and formats are driving that performance.
In the comparison below, each page's top three posts are ranked by engagement alongside reach, likes, comments, and shares. In this view, it’s easy to spot which specific Facebook posts are carrying the most weight. The content pillar breakdown underneath adds another layer, showing which topics each page leans on most and how engagement rate holds up across those categories.

A competitor might be using a content pillar heavily, while your page barely touches it. If their engagement rate on that pillar is strong, that's something worth looking into.
Which metrics belong in a weekly check vs. a monthly strategic review
Not every Facebook metric deserves the same attention on the same schedule. In my experience, here’s what’s optimal:
Weekly check for fast, operational optimizations:
- Post-level engagement rate
- Comments and response time
- Video watch time and retention on recent posts
- Click volume on any active links
Monthly strategic review for slower-moving, directional signs:
- Follower growth rate and net new followers
- Engagement rate by reach, averaged across the month
- Audience demographics and geographic shifts
- Competitive benchmarks and share of voice
- ROAS and conversion rate trends, if running ads
The weekly check is about catching problems or wins early enough to act on them, such as a post underperforming, a spike in negative sentiment, a video that's suddenly getting more views. The monthly review is about strategic direction: is the page growing, is the audience evolving, how are competitors doing, is the strategy building towards goals?
Katie McKiever explains this in terms of storytelling:
I'm a storyteller and story identifier at heart, so to me, every set of metrics is begging for a story. The job of the social media professional is to identify the right story from the data and tell it to the right audience... The data matters, but the story you tell from the data is what turns reporting into real business insight.
How to track metrics over time to spot trend changes
Spotting a real trend change means comparing the current period against a long-term average, not against last week alone.
For example, a single week of lower engagement can happen without a solid reason, like a holiday or a smaller batch of posts. Comparing against a four-week average at least makes it easier to spot real trends.
If a metric moves in the same direction for three or four consecutive periods, a real change is happening. If it bounces back quickly, it probably wasn't a trend at all.
Make sure your Facebook analytics tool offers historic data so you can reliably spot social media trends and lasting changes in metrics.
Final thoughts
Facebook metrics are useful only when tied to a clear goal, tracked consistently, and read alongside competitors.
To get the most out of your reporting, be deliberate about what you're measuring and go beyond momentarily impressive numbers. Always think in terms of insights and what’s useful for decision-making.
I know that's easier said than done, so I suggest getting help from a social media analytics tool like Socialinsider, which you can try for free for 14 days to see which Facebook metrics matter most for your own strategy.
Sabina Varga
Content marketing expert with 15 years of experience in digital marketing. I dream of beach life but love the city as a multitasking mom juggling playgrounds, books, brunches, and travels.

Know what your competitors do — before your manager asks
Get instant social benchmarks & reports without manual work.

