Tyson Foods Brand Overview
See social media performance data for Tyson Foods
Tyson Foods
0.06%
Brand Avg Engagement RatePhoto
Top Content (By Eng. Rate)1218
Avg. Brand Video ViewsBrand Posts Across Channels
Cross-channels analysis of the post
Brand Posts Across Channels
| Channels | Posts | Avg. Posts/Day |
|---|---|---|
 Twitter Twitter | 0 | 0 |
 Facebook Facebook | 65 | 0.36 |
 Instagram Instagram | 61 | 0.34 |
| Total | 126 | 0.7 |
Top Posts
Tyson Foods Instagram
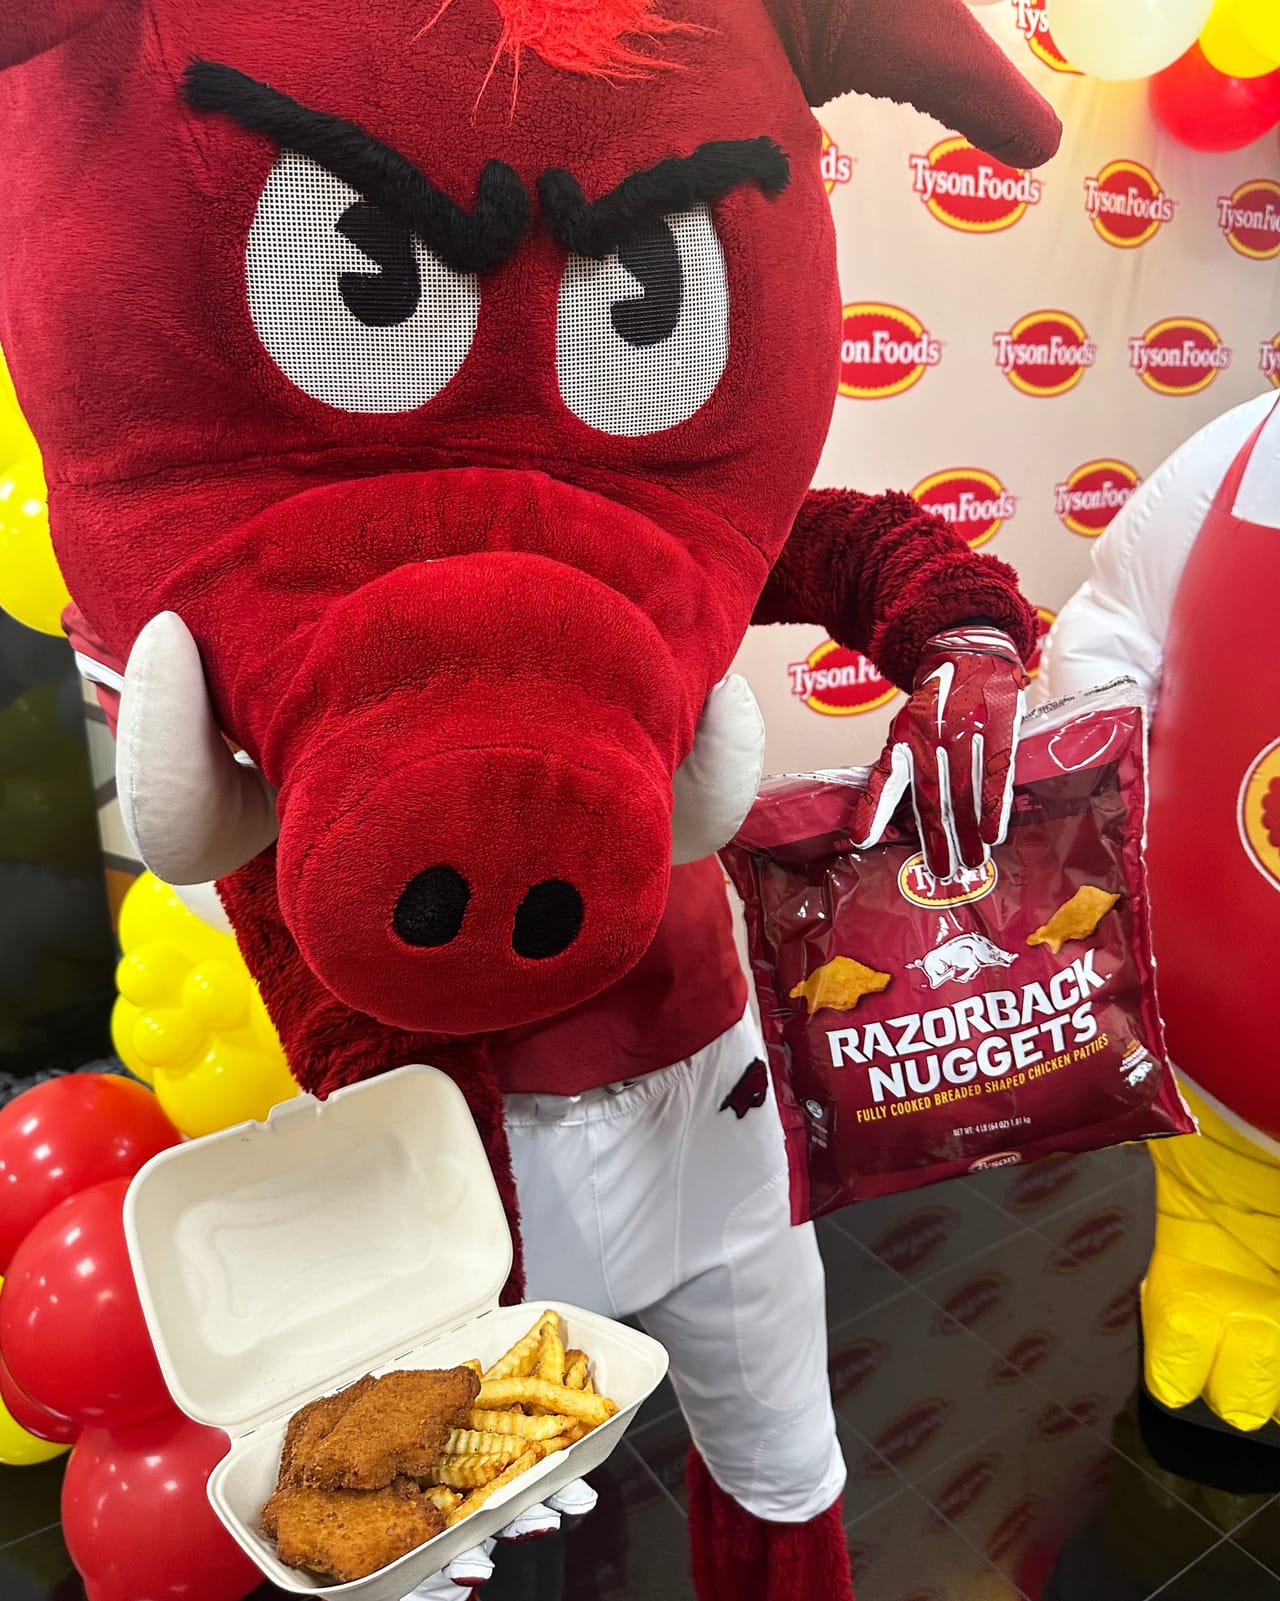
Mar 27, 2025
22K followers
Engagement Rate
1.461%
Tyson Foods Instagram

Jun 26, 2025
22K followers
Engagement Rate
1.434%
Tyson Foods Instagram

Apr 22, 2025
22K followers
Engagement Rate
0.642%
Brand Engagement Across Channels
Cross-channels analysis of the engagement
Brand Engagement Across Channels
| Channels | Engagement | Avg. Engagement |
|---|---|---|
| Twitter | 0 | 0 |
| Facebook | 3913 | 60.2 |
| Instagram | 2809 | 46.05 |
| Average | 2241 | 35.42 |
Brand Video Views Across Channels
Cross-channels analysis of the engagement
Brand Video Views Across Channels
| Channels | Video Views | Avg. Video Views |
|---|---|---|
| Twitter | 0 | 0 |
| Facebook | 133K | 4439 |
| Instagram | 9083 | 432.52 |
| Average | 47K | 1624 |
Similar Brands
Explore top-performing brands from the FMCG — Food Industry


Ready to improve your social media strategy with real-time insights
Get strategic insights, analyze the social performance across all channels, compare metrics from different periods and download reports in seconds.