The Campbell's Company Brand Overview
See social media performance data for The Campbell's Company
The Campbell's Company
1.75%
Brand Avg Engagement RateCarousel Album
Top Content (By Eng. Rate)1707
Avg. Brand Video ViewsBrand Posts Across Channels
Cross-channels analysis of the post
Brand Posts Across Channels
| Channels | Posts | Avg. Posts/Day |
|---|---|---|
 YouTube YouTube | 10 | 0.06 |
 Instagram Instagram | 57 | 0.32 |
| Total | 67 | 0.37 |
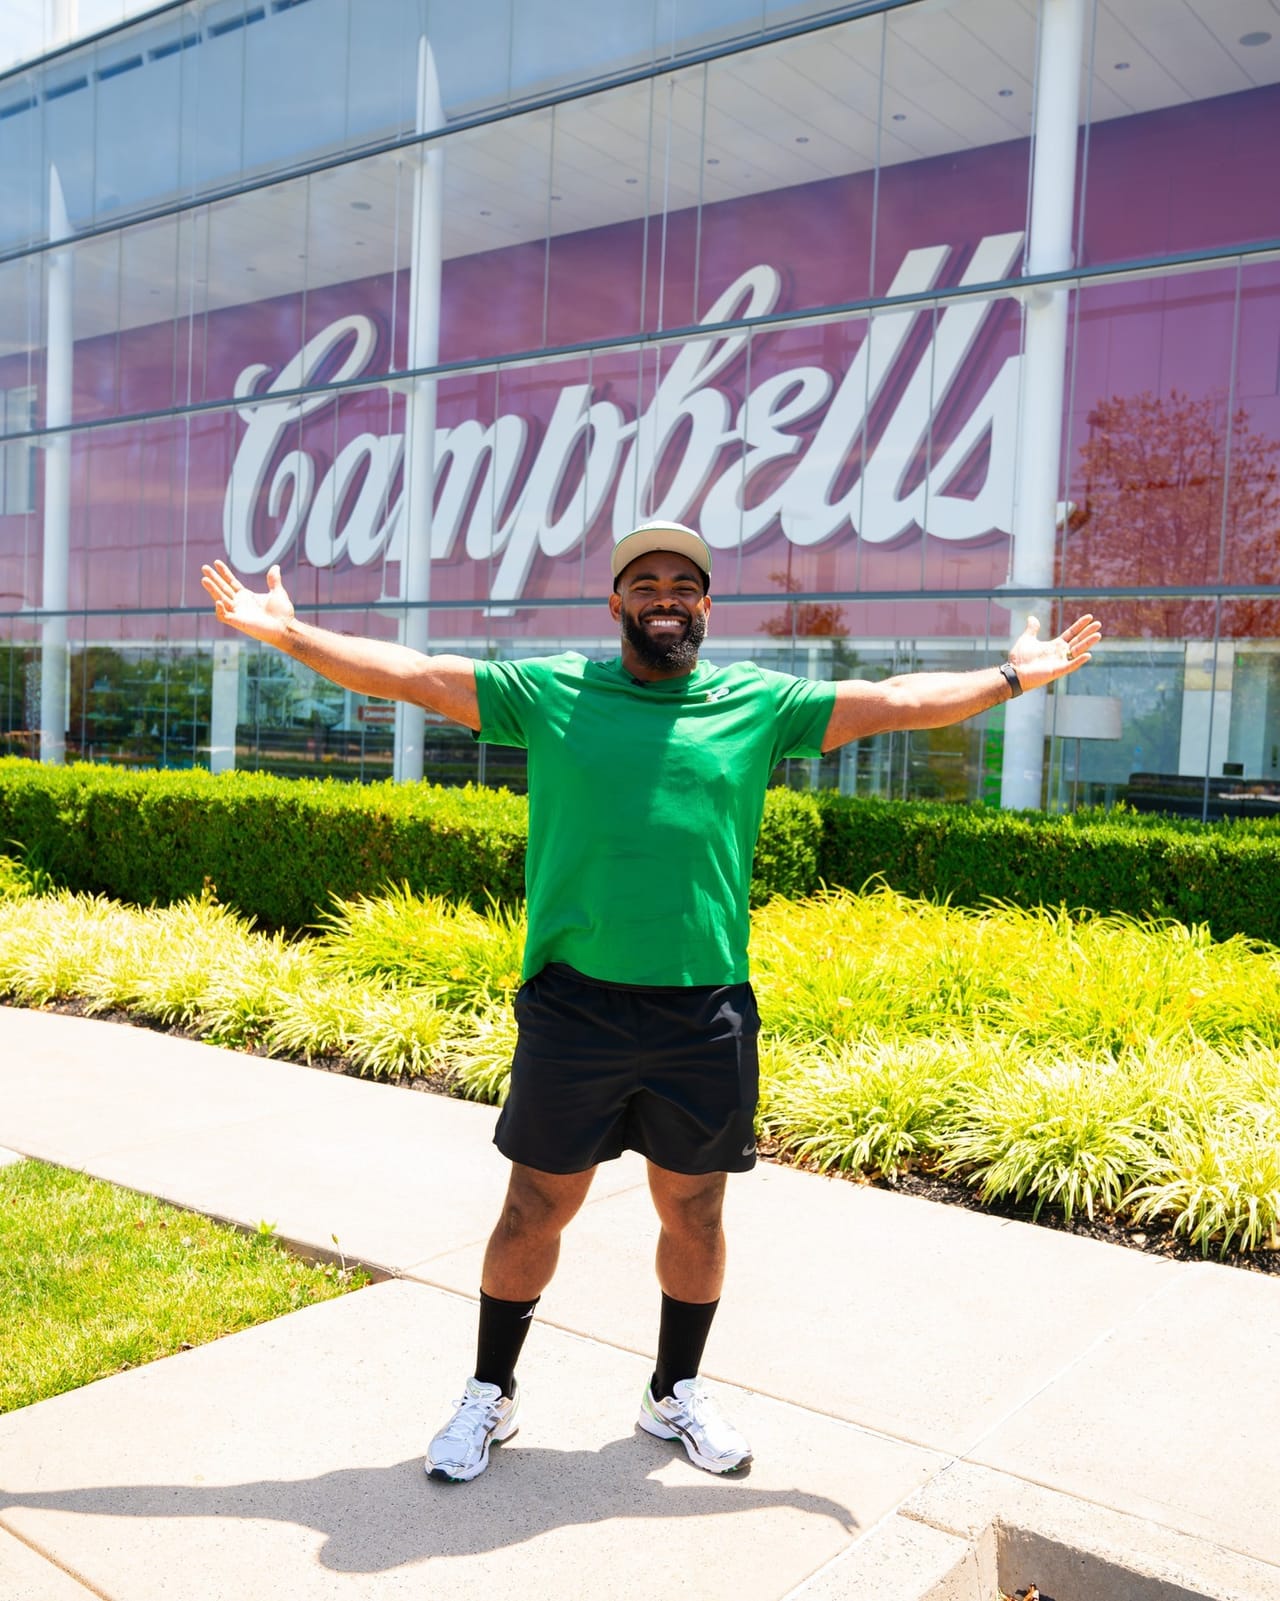
Top Posts
 The Campbell's C...
 Instagram

Mar 31, 2025
9042 followers
Engagement Rate
7.432%
The Campbell's C... YouTube

Apr 29, 2025
618 followers
Engagement Rate
3.884%
The Campbell's C... Instagram
Feb 10, 2025
8990 followers
Engagement Rate
3.459%
Brand Engagement Across Channels
Cross-channels analysis of the engagement
Brand Engagement Across Channels
| Channels | Engagement | Avg. Engagement |
|---|---|---|
| YouTube | 117 | 11.7 |
| Instagram | 8300 | 145.61 |
| Average | 4209 | 78.66 |
Brand Video Views Across Channels
Cross-channels analysis of the engagement
Brand Video Views Across Channels
| Channels | Video Views | Avg. Video Views |
|---|---|---|
| YouTube | 13K | 1307 |
| Instagram | 53K | 2107 |
| Average | 33K | 1707 |
Similar Brands
Explore top-performing brands from the FMCG — Food Industry


Ready to improve your social media strategy with real-time insights
Get strategic insights, analyze the social performance across all channels, compare metrics from different periods and download reports in seconds.