General Mills Brand Overview
See social media performance data for General Mills
General Mills
0.09%
Brand Avg Engagement RateCarousel Album
Top Content (By Eng. Rate)1815
Avg. Brand Video ViewsBrand Posts Across Channels
Cross-channels analysis of the post
Brand Posts Across Channels
| Channels | Posts | Avg. Posts/Day |
|---|---|---|
 YouTube YouTube | 5 | 0.03 |
 Twitter Twitter | 0 | 0 |
 Facebook Facebook | 48 | 0.27 |
 Instagram Instagram | 65 | 0.36 |
| Total | 118 | 0.66 |
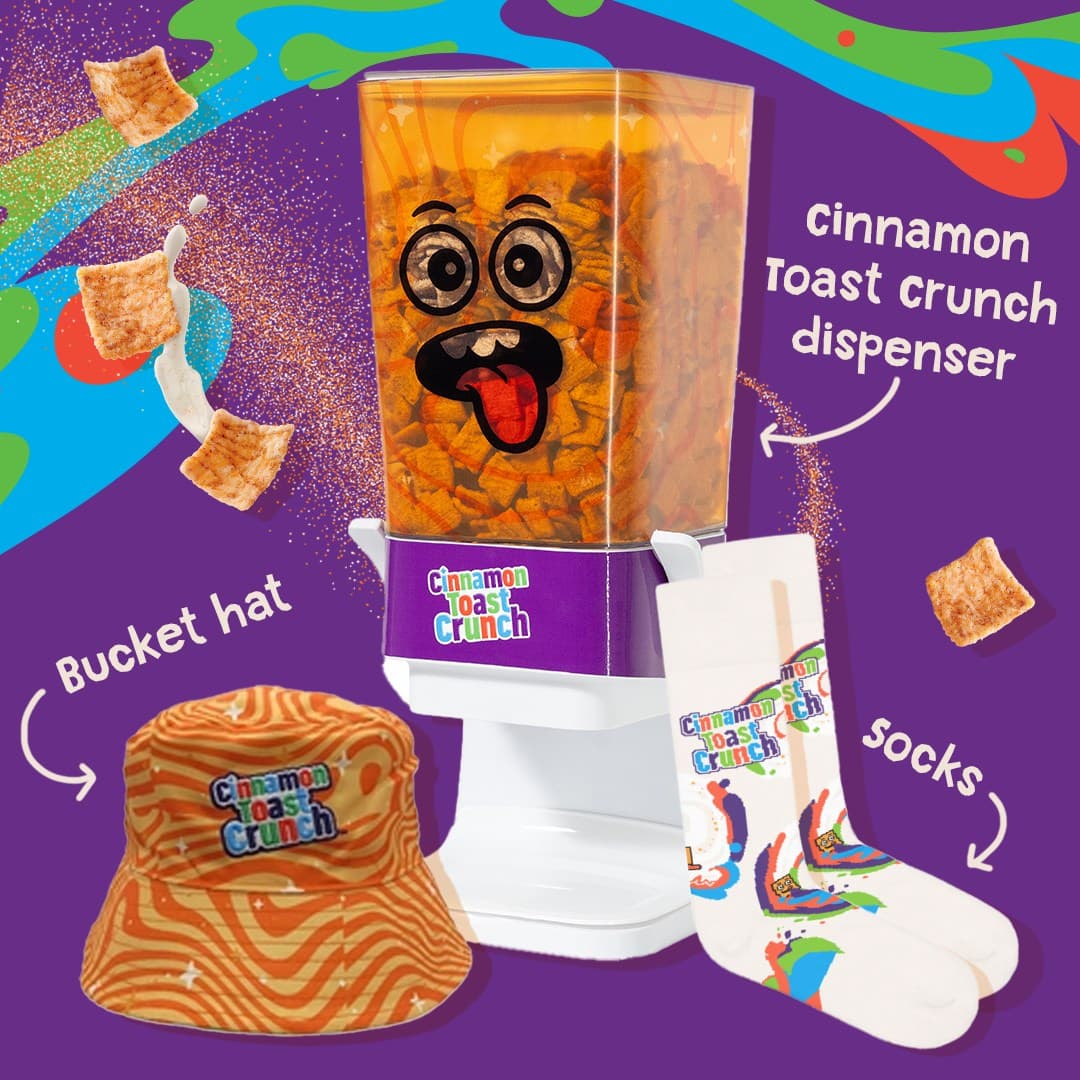
Top Posts
General Mills Instagram

Jan 29, 2025
102K followers
Engagement Rate
1.657%
General Mills Instagram

Jan 16, 2025
102K followers
Engagement Rate
0.995%
General Mills Instagram
Mar 6, 2025
102K followers
Engagement Rate
0.875%
Brand Engagement Across Channels
Cross-channels analysis of the engagement
Brand Engagement Across Channels
| Channels | Engagement | Avg. Engagement |
|---|---|---|
| YouTube | 41 | 8.2 |
| Twitter | 0 | 0 |
| Facebook | 2563 | 53.4 |
| Instagram | 16K | 242.28 |
| Average | 4588 | 75.97 |
Brand Video Views Across Channels
Cross-channels analysis of the engagement
Brand Video Views Across Channels
| Channels | Video Views | Avg. Video Views |
|---|---|---|
| YouTube | 2438 | 487.6 |
| Twitter | 0 | 0 |
| Facebook | 138K | 4179 |
| Instagram | 96K | 2593 |
| Average | 59K | 1815 |
Similar Brands
Explore top-performing brands from the FMCG — Food Industry


Ready to improve your social media strategy with real-time insights
Get strategic insights, analyze the social performance across all channels, compare metrics from different periods and download reports in seconds.