Rice University Brand Overview
See social media performance data for Rice University

Rice University
0.54%
Brand Avg Engagement RateCarousel Album
Top Content (By Eng. Rate)5895
Avg. Brand Video ViewsBrand Posts Across Channels
Cross-channels analysis of the post
Brand Posts Across Channels
| Channels | Posts | Avg. Posts/Day |
|---|---|---|
 YouTube YouTube | 84 | 0.47 |
 Twitter Twitter | 130 | 0.72 |
 Facebook Facebook | 43 | 0.24 |
 Instagram Instagram | 79 | 0.44 |
| Total | 336 | 1.87 |
Top Posts
Rice University Instagram
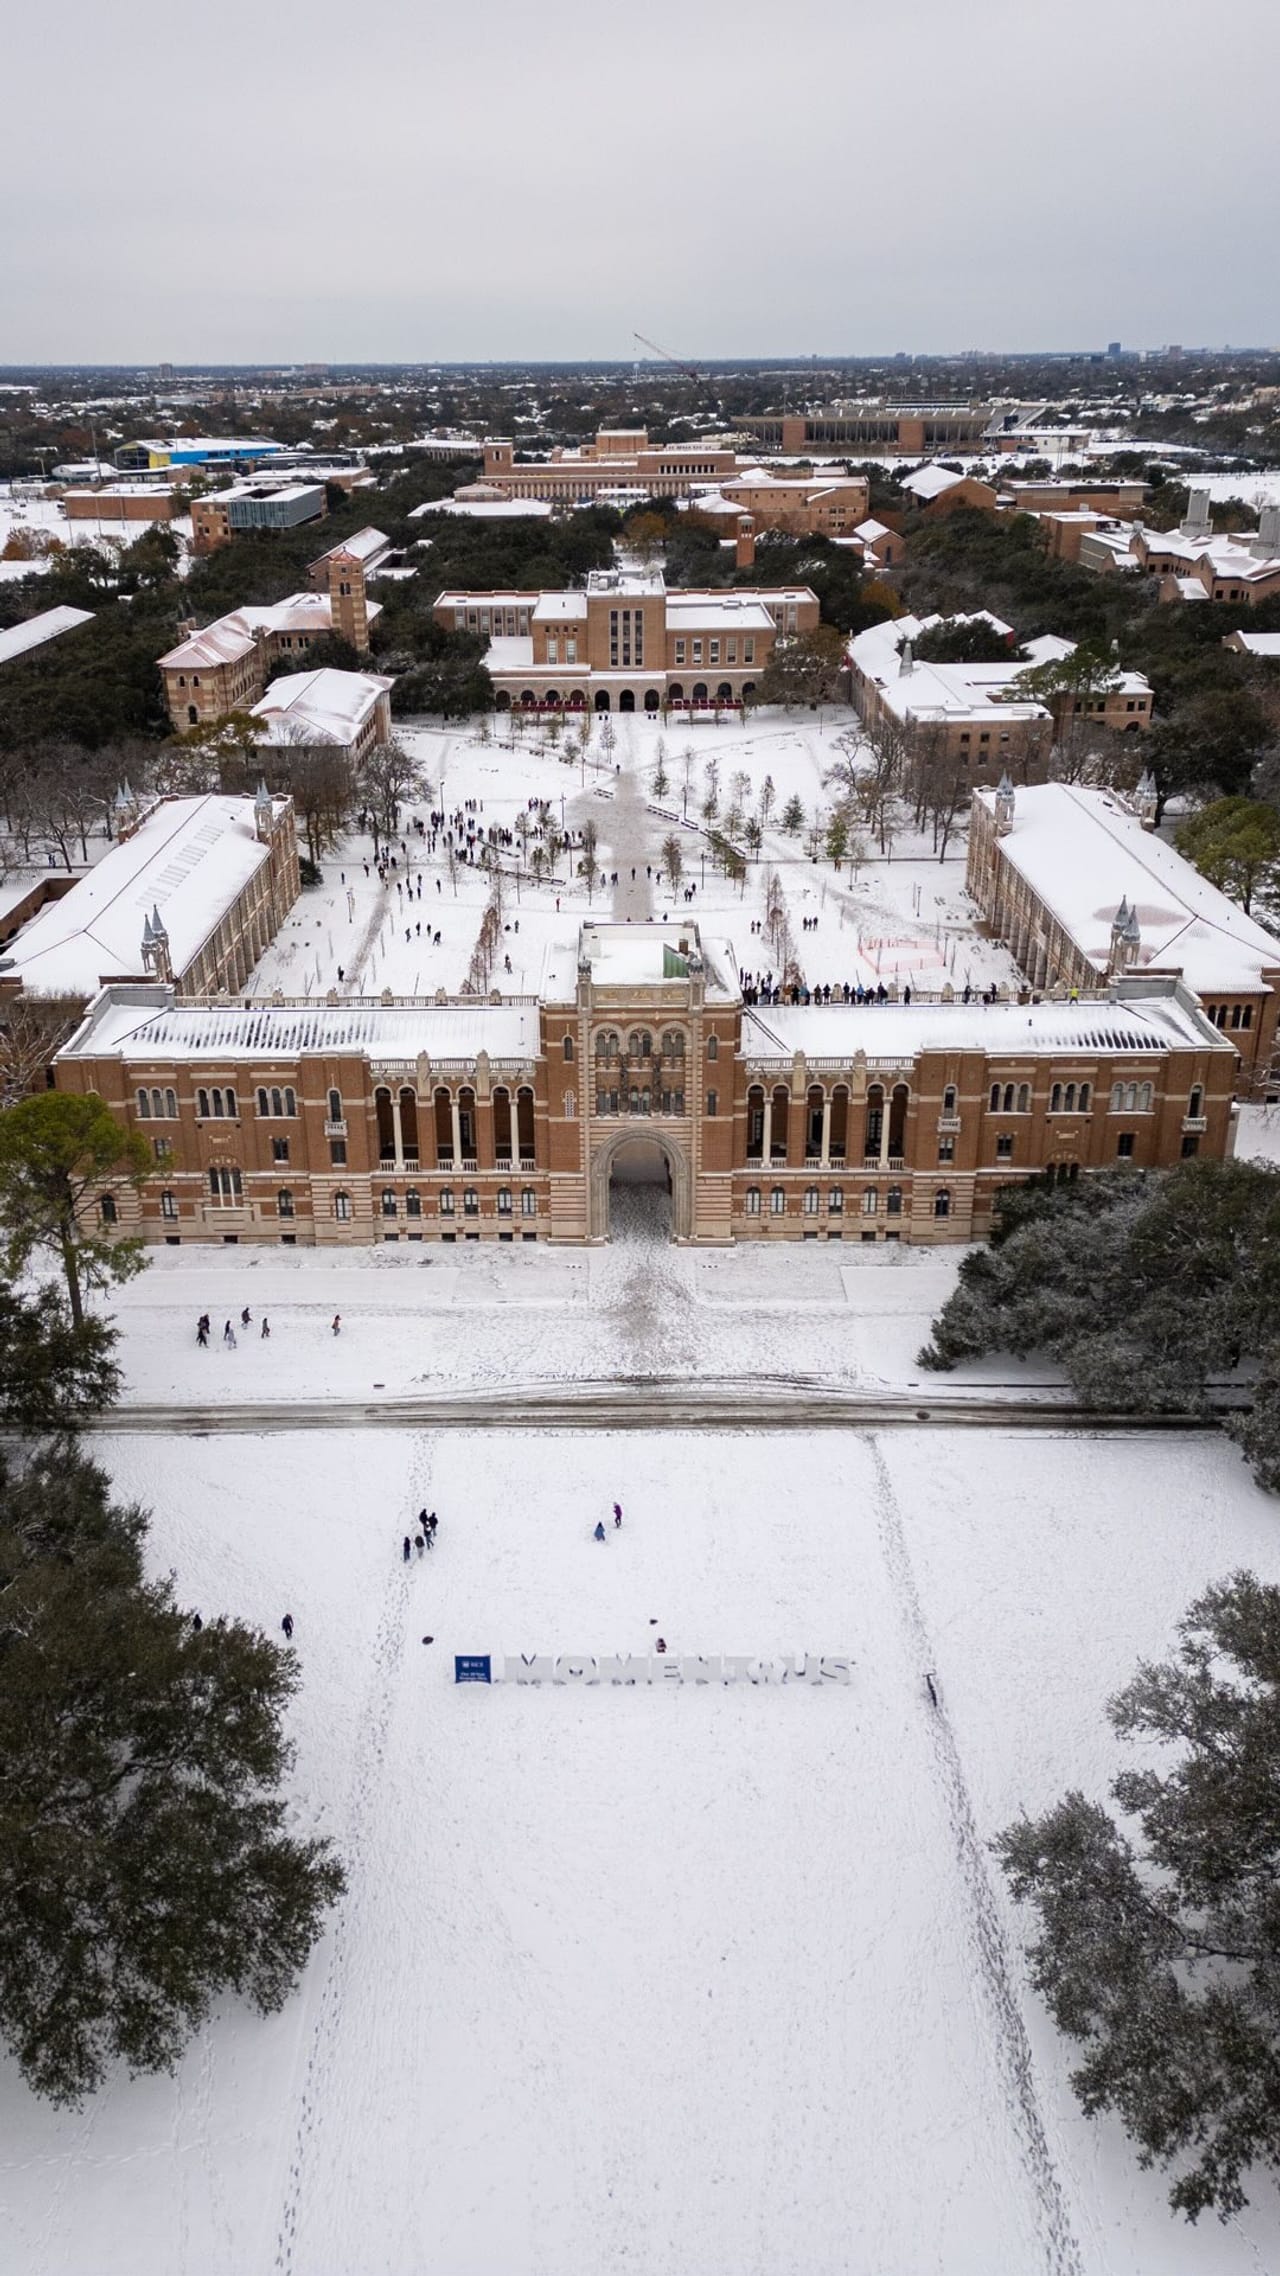
Jan 21, 2025
70K followers
Engagement Rate
11.306%
Rice University Instagram
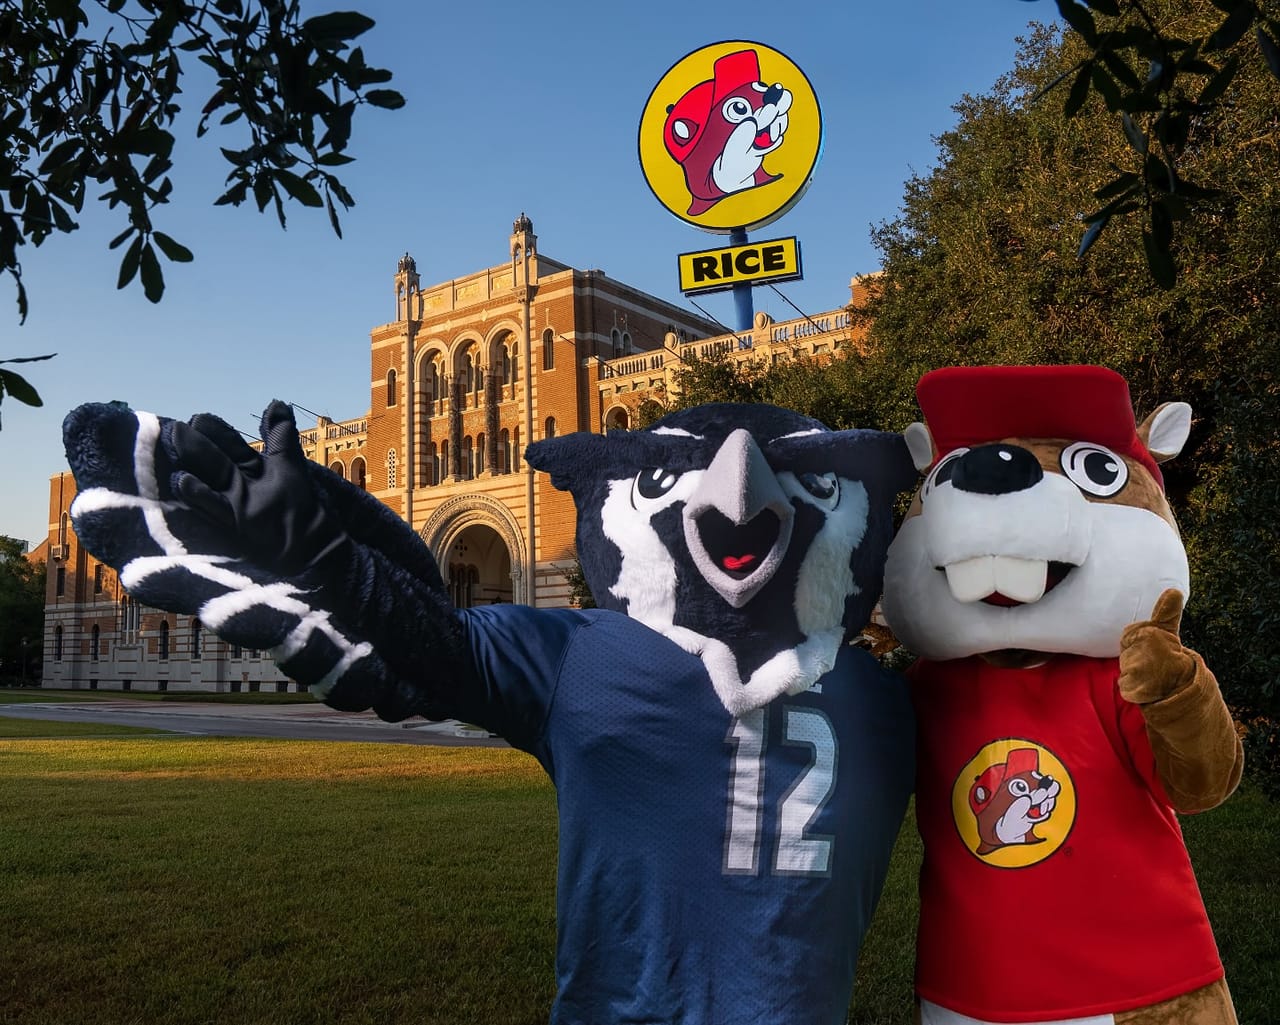
Apr 1, 2025
73K followers
Engagement Rate
10.751%
Rice University Instagram

Jan 22, 2025
70K followers
Engagement Rate
7.163%
Brand Engagement Across Channels
Cross-channels analysis of the engagement
Brand Engagement Across Channels
| Channels | Engagement | Avg. Engagement |
|---|---|---|
| YouTube | 1478 | 17.6 |
| Twitter | 3739 | 28.76 |
| Facebook | 4790 | 111.4 |
| Instagram | 110K | 1397 |
| Average | 30K | 388.63 |
Brand Video Views Across Channels
Cross-channels analysis of the engagement
Brand Video Views Across Channels
| Channels | Video Views | Avg. Video Views |
|---|---|---|
| YouTube | 63K | 752.51 |
| Twitter | 54K | 2834 |
| Facebook | 214K | 4985 |
| Instagram | 765K | 15K |
| Average | 274K | 5895 |
Similar Brands
Explore top-performing brands from the Education Industry


Ready to improve your social media strategy with real-time insights
Get strategic insights, analyze the social performance across all channels, compare metrics from different periods and download reports in seconds.