Boxlight Corp Brand Overview
See social media performance data for Boxlight Corp
Boxlight Corp
0.41%
Brand Avg Engagement RatePhoto
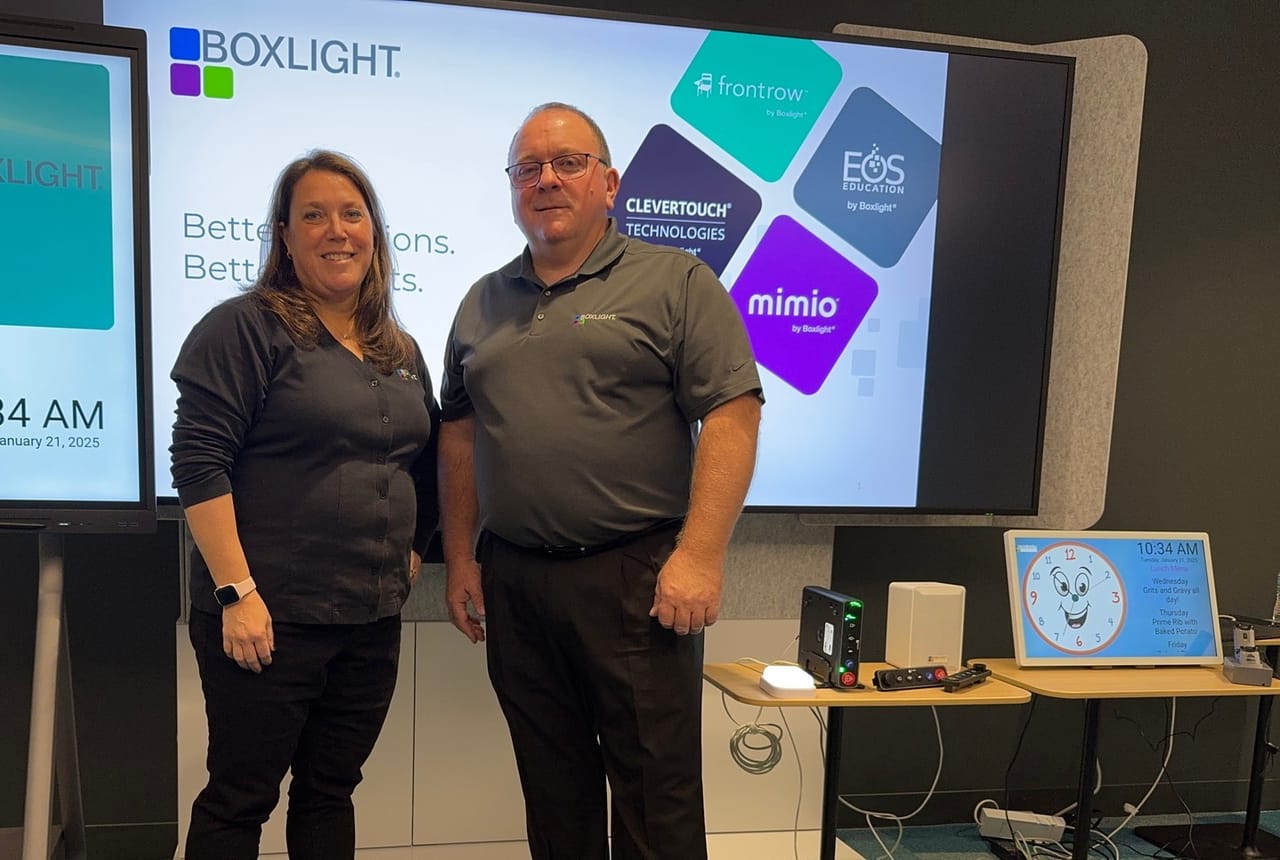
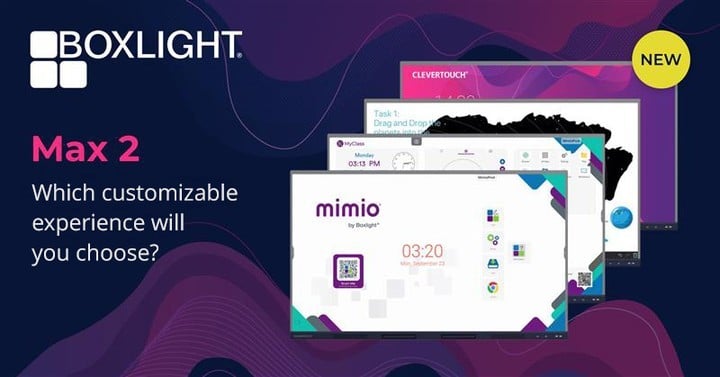
Top Content (By Eng. Rate)85.33
Avg. Brand Video ViewsBrand Posts Across Channels
Cross-channels analysis of the post
Brand Posts Across Channels
| Channels | Posts | Avg. Posts/Day |
|---|---|---|
 YouTube YouTube | 0 | 0 |
 Twitter Twitter | 132 | 0.73 |
 Facebook Facebook | 62 | 0.34 |
 Instagram Instagram | 9 | 0.05 |
| Total | 203 | 1.13 |
Top Posts
Boxlight Corp Instagram
Jan 22, 2025
301 followers
Engagement Rate
2.99%
Boxlight Corp Instagram

Mar 14, 2025
301 followers
Engagement Rate
1.993%
Boxlight Corp Instagram
Feb 13, 2025
301 followers
Engagement Rate
1.661%
Brand Engagement Across Channels
Cross-channels analysis of the engagement
Brand Engagement Across Channels
| Channels | Engagement | Avg. Engagement |
|---|---|---|
| YouTube | 0 | 0 |
| Twitter | 156 | 1.18 |
| Facebook | 54 | 0.87 |
| Instagram | 43 | 4.78 |
| Average | 63.25 | 1.71 |
Brand Video Views Across Channels
Cross-channels analysis of the engagement
Brand Video Views Across Channels
| Channels | Video Views | Avg. Video Views |
|---|---|---|
| YouTube | 0 | 0 |
| Twitter | 0 | 0 |
| Facebook | 728 | 121.33 |
| Instagram | 220 | 220 |
| Average | 237 | 85.33 |
Similar Brands
Explore top-performing brands from the Education Industry


Ready to improve your social media strategy with real-time insights
Get strategic insights, analyze the social performance across all channels, compare metrics from different periods and download reports in seconds.