Rare Beauty Brand Overview
See social media performance data for Rare Beauty
Rare Beauty
0.8%
Brand Avg Engagement RateVideo
Top Content (By Eng. Rate)332K
Avg. Brand Video ViewsBrand Posts Across Channels
Cross-channels analysis of the post
Brand Posts Across Channels
| Channels | Posts | Avg. Posts/Day |
|---|---|---|
 YouTube YouTube | 182 | 1.01 |
 TikTok TikTok | 185 | 1.03 |
 Facebook Facebook | 351 | 1.95 |
 Instagram Instagram | 315 | 1.75 |
| Total | 1033 | 5.74 |
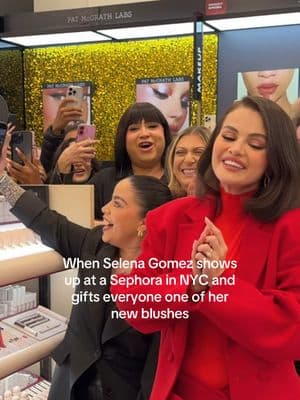
Top Posts
Rare Beauty TikTok

Jan 6, 2025
4.9M followers
Engagement Rate
28.275%
Rare Beauty TikTok
Mar 26, 2025
4.9M followers
Engagement Rate
27.488%
Rare Beauty TikTok

Jan 23, 2025
4.9M followers
Engagement Rate
20.699%
Brand Engagement Across Channels
Cross-channels analysis of the engagement
Brand Engagement Across Channels
| Channels | Engagement | Avg. Engagement |
|---|---|---|
| YouTube | 784K | 4307 |
| TikTok | 13M | 70K |
| Facebook | 249K | 708.65 |
| Instagram | 25M | 79K |
| Average | 9.7M | 38K |
Brand Video Views Across Channels
Cross-channels analysis of the engagement
Brand Video Views Across Channels
| Channels | Video Views | Avg. Video Views |
|---|---|---|
| YouTube | 22M | 118K |
| TikTok | 160M | 867K |
| Facebook | 7.0M | 37K |
| Instagram | 39M | 303K |
| Average | 57M | 332K |
Similar Brands
Explore top-performing brands from the Beauty & Cosmetics Industry


Ready to improve your social media strategy with real-time insights
Get strategic insights, analyze the social performance across all channels, compare metrics from different periods and download reports in seconds.