Fenty Beauty Brand Overview
See social media performance data for Fenty Beauty

Fenty Beauty
0.25%
Brand Avg Engagement RatePhoto
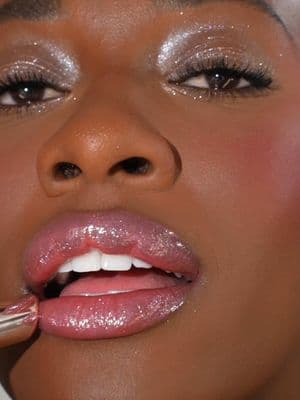
Top Content (By Eng. Rate)90K
Avg. Brand Video ViewsBrand Posts Across Channels
Cross-channels analysis of the post
Brand Posts Across Channels
| Channels | Posts | Avg. Posts/Day |
|---|---|---|
 YouTube YouTube | 71 | 0.39 |
 Twitter Twitter | 0 | 0 |
 TikTok TikTok | 270 | 1.5 |
 Facebook Facebook | 205 | 1.14 |
 Instagram Instagram | 391 | 2.17 |
| Total | 937 | 5.21 |
Top Posts
Fenty Beauty TikTok

Feb 1, 2025
3.4M followers
Engagement Rate
11.696%
Fenty Beauty TikTok
Mar 17, 2025
3.4M followers
Engagement Rate
6.621%
 Fenty Beauty
 YouTube

Jan 18, 2025
1.1M followers
Engagement Rate
6.597%
Brand Engagement Across Channels
Cross-channels analysis of the engagement
Brand Engagement Across Channels
| Channels | Engagement | Avg. Engagement |
|---|---|---|
| YouTube | 290K | 4079 |
| Twitter | 0 | 0 |
| TikTok | 5.1M | 19K |
| Facebook | 166K | 808.34 |
| Instagram | 12M | 32K |
| Average | 3.6M | 11K |
Brand Video Views Across Channels
Cross-channels analysis of the engagement
Brand Video Views Across Channels
| Channels | Video Views | Avg. Video Views |
|---|---|---|
| YouTube | 6.7M | 94K |
| Twitter | 0 | 0 |
| TikTok | 62M | 229K |
| Facebook | 2.0M | 16K |
| Instagram | 31M | 110K |
| Average | 20M | 90K |
Similar Brands
Explore top-performing brands from the Beauty & Cosmetics Industry


Ready to improve your social media strategy with real-time insights
Get strategic insights, analyze the social performance across all channels, compare metrics from different periods and download reports in seconds.