Toyota Brand Overview
See social media performance data for Toyota

Toyota
0.37%
Brand Avg Engagement RateVideo
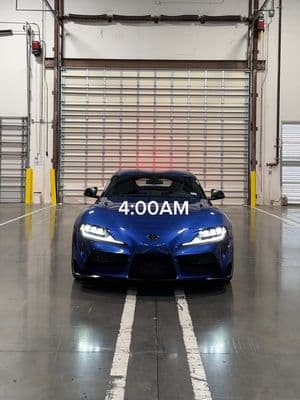
Top Content (By Eng. Rate)129K
Avg. Brand Video ViewsBrand Posts Across Channels
Cross-channels analysis of the post
Brand Posts Across Channels
| Channels | Posts | Avg. Posts/Day |
|---|---|---|
 YouTube YouTube | 271 | 1.51 |
 Twitter Twitter | 0 | 0 |
 TikTok TikTok | 29 | 0.16 |
 Facebook Facebook | 102 | 0.57 |
 Instagram Instagram | 108 | 0.6 |
| Total | 510 | 2.83 |
Top Posts
 Toyota
 Instagram

Jun 20, 2025
3.1M followers
Engagement Rate
17.567%
Toyota TikTok

Jun 20, 2025
1.1M followers
Engagement Rate
15.716%
Toyota TikTok
Apr 8, 2025
1.1M followers
Engagement Rate
4.629%
Brand Engagement Across Channels
Cross-channels analysis of the engagement
Brand Engagement Across Channels
| Channels | Engagement | Avg. Engagement |
|---|---|---|
| YouTube | 91K | 336.16 |
| Twitter | 0 | 0 |
| TikTok | 424K | 15K |
| Facebook | 203K | 1994 |
| Instagram | 1.4M | 13K |
| Average | 423K | 5973 |
Brand Video Views Across Channels
Cross-channels analysis of the engagement
Brand Video Views Across Channels
| Channels | Video Views | Avg. Video Views |
|---|---|---|
| YouTube | 29M | 105K |
| Twitter | 0 | 0 |
| TikTok | 6.0M | 208K |
| Facebook | 5.7M | 174K |
| Instagram | 6.5M | 155K |
| Average | 9.4M | 129K |
Similar Brands
Explore top-performing brands from the Automotive Industry


Ready to improve your social media strategy with real-time insights
Get strategic insights, analyze the social performance across all channels, compare metrics from different periods and download reports in seconds.