Chrysler Brand Overview
See social media performance data for Chrysler
C
Chrysler
0.07%
Brand Avg Engagement RatePhoto
Top Content (By Eng. Rate)14K
Avg. Brand Video ViewsBrand Posts Across Channels
Cross-channels analysis of the post
Brand Posts Across Channels
| Channels | Posts | Avg. Posts/Day |
|---|---|---|
 YouTube YouTube | 7 | 0.04 |
 Twitter Twitter | 0 | 0 |
 Facebook Facebook | 50 | 0.28 |
 Instagram Instagram | 70 | 0.39 |
| Total | 127 | 0.71 |
Top Posts
 Chrysler
 Instagram
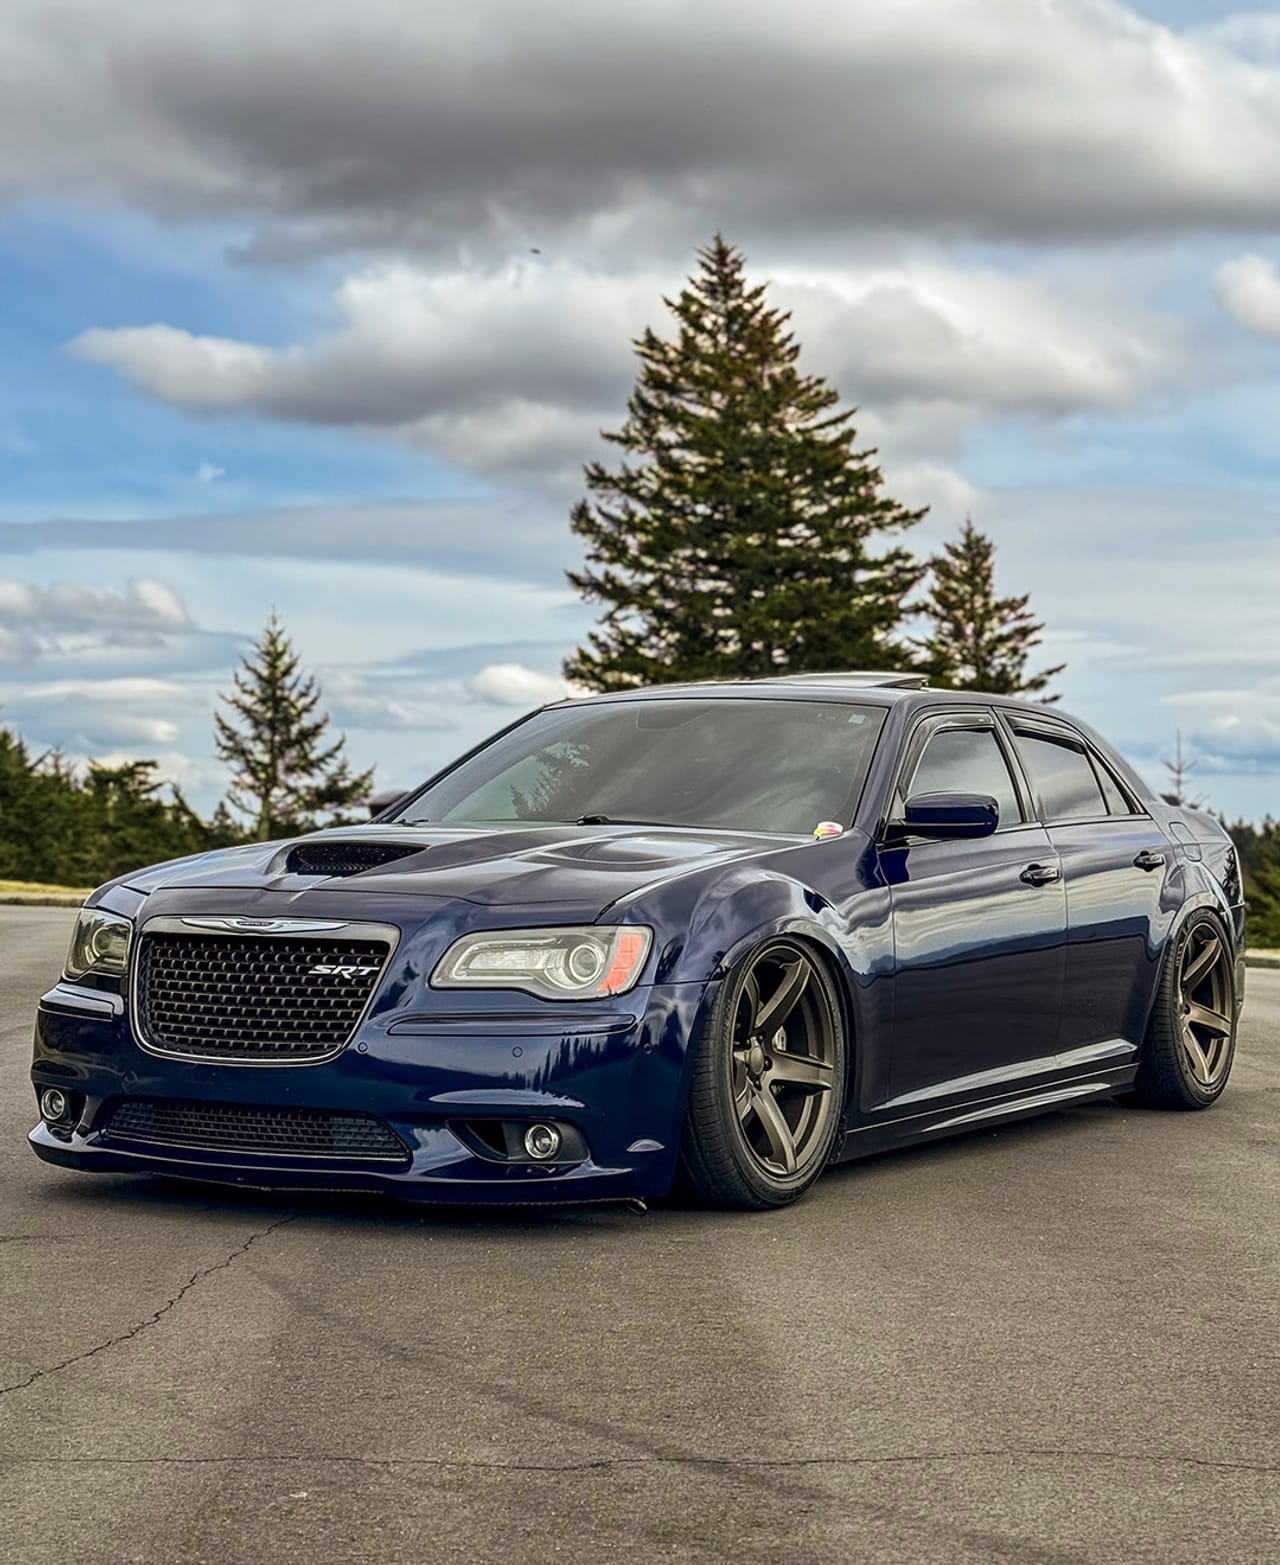
Feb 5, 2025
1.2M followers
Engagement Rate
0.5%
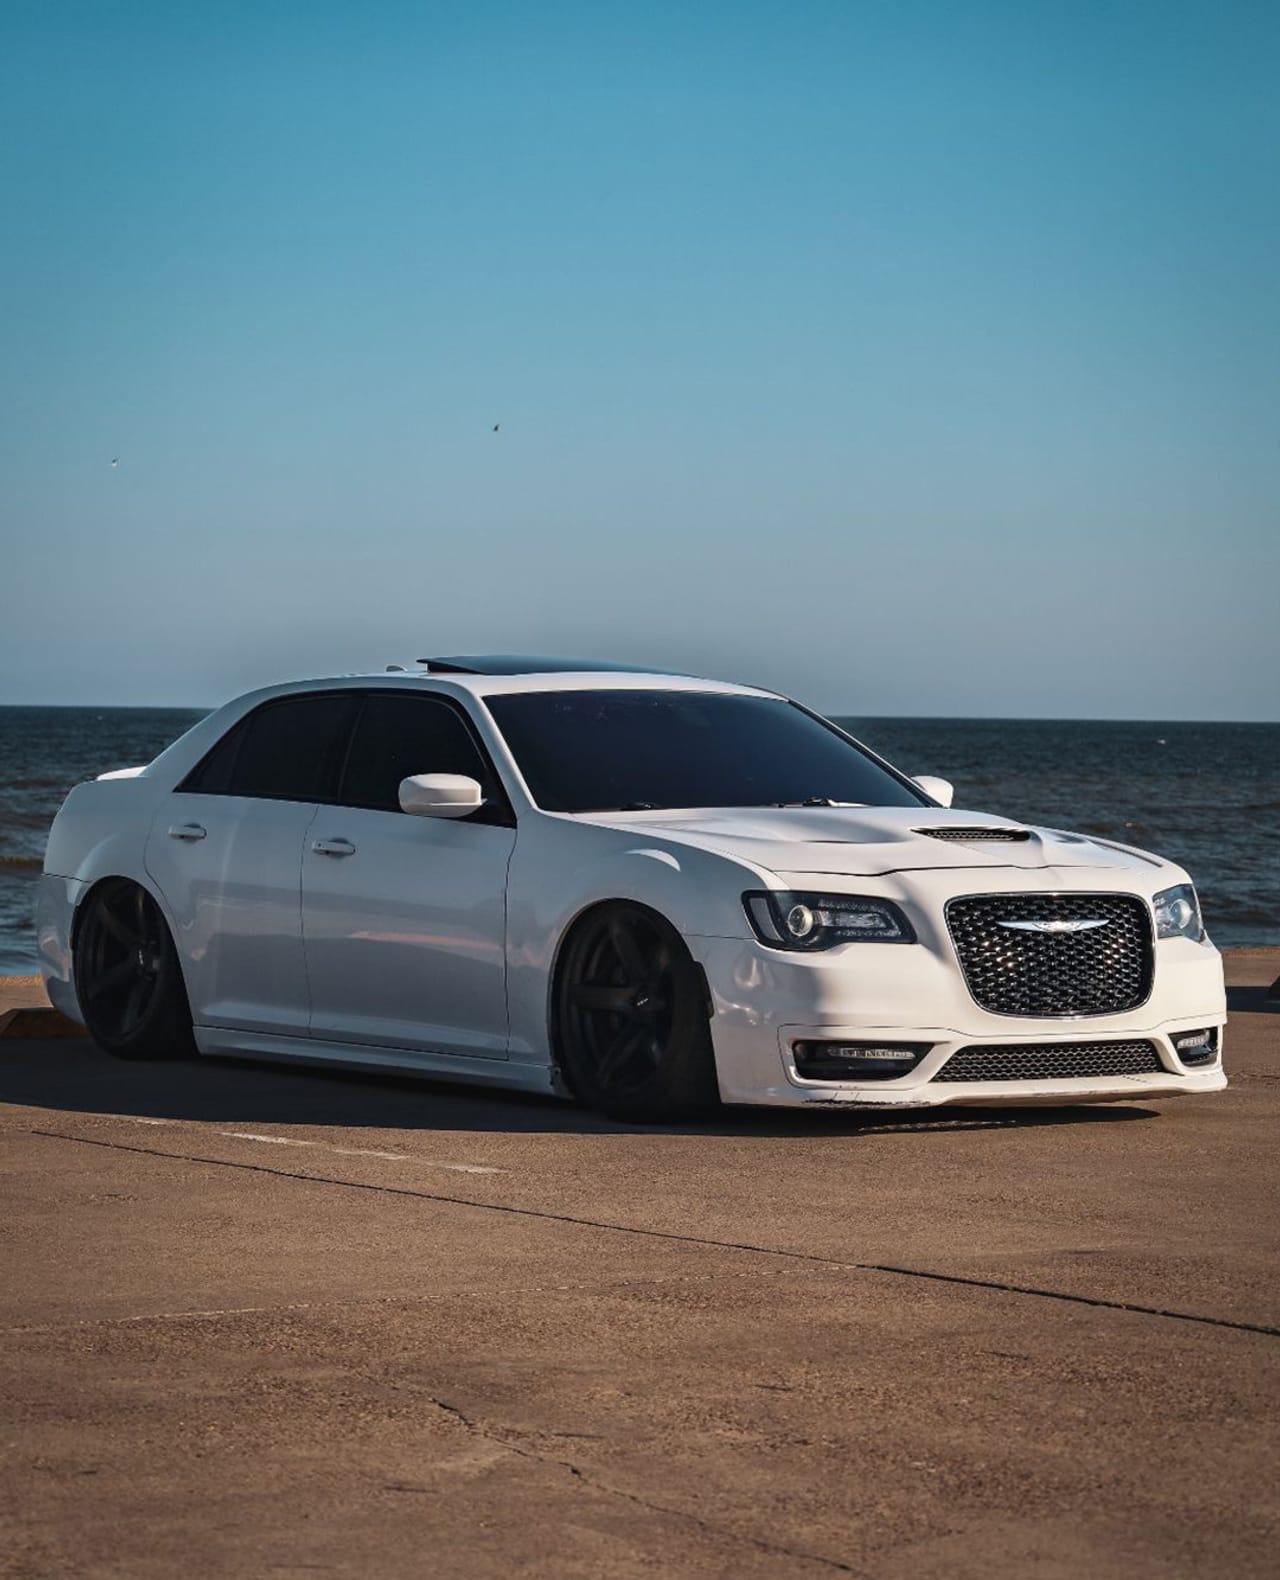
Chrysler Instagram

Jun 7, 2025
1.2M followers
Engagement Rate
0.41%
Chrysler Instagram
Mar 4, 2025
1.2M followers
Engagement Rate
0.399%
Brand Engagement Across Channels
Cross-channels analysis of the engagement
Brand Engagement Across Channels
| Channels | Engagement | Avg. Engagement |
|---|---|---|
| YouTube | 466 | 66.57 |
| Twitter | 0 | 0 |
| Facebook | 30K | 605.66 |
| Instagram | 86K | 1226 |
| Average | 29K | 474.51 |
Brand Video Views Across Channels
Cross-channels analysis of the engagement
Brand Video Views Across Channels
| Channels | Video Views | Avg. Video Views |
|---|---|---|
| YouTube | 52K | 7437 |
| Twitter | 0 | 0 |
| Facebook | 34K | 34K |
| Instagram | 369K | 16K |
| Average | 114K | 14K |
Similar Brands
Explore top-performing brands from the Automotive Industry


Ready to improve your social media strategy with real-time insights
Get strategic insights, analyze the social performance across all channels, compare metrics from different periods and download reports in seconds.