British Cycling Brand Overview
See social media performance data for British Cycling
British Cycling
0.07%
Brand Avg Engagement RateReel
Top Content (By Eng. Rate)24K
Avg. Brand Video ViewsBrand Posts Across Channels
Cross-channels analysis of the post
Brand Posts Across Channels
| Channels | Posts | Avg. Posts/Day |
|---|---|---|
 Twitter Twitter | 320 | 1.78 |
 Facebook Facebook | 161 | 0.89 |
| Total | 481 | 2.67 |
Top Posts
British Cycling Facebook
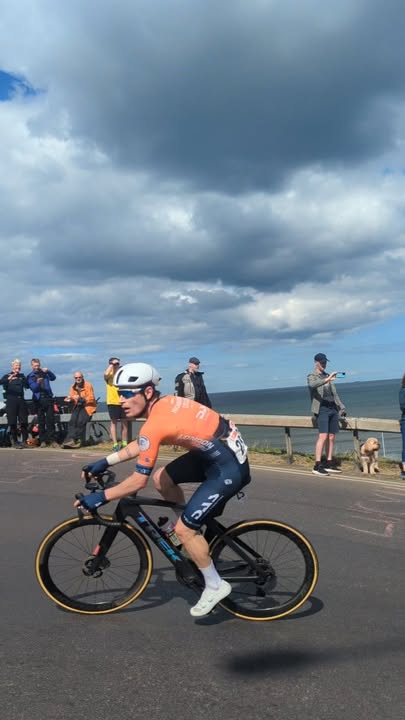
Apr 13, 2025
249K followers
Engagement Rate
3.239%
British Cycling Facebook
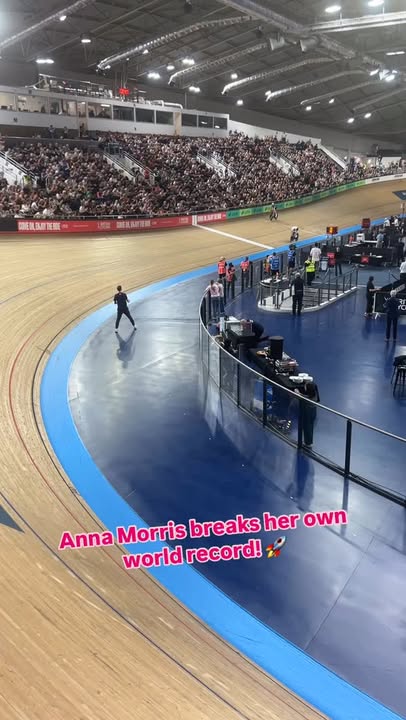
Feb 22, 2025
249K followers
Engagement Rate
1.025%
British Cycling Facebook
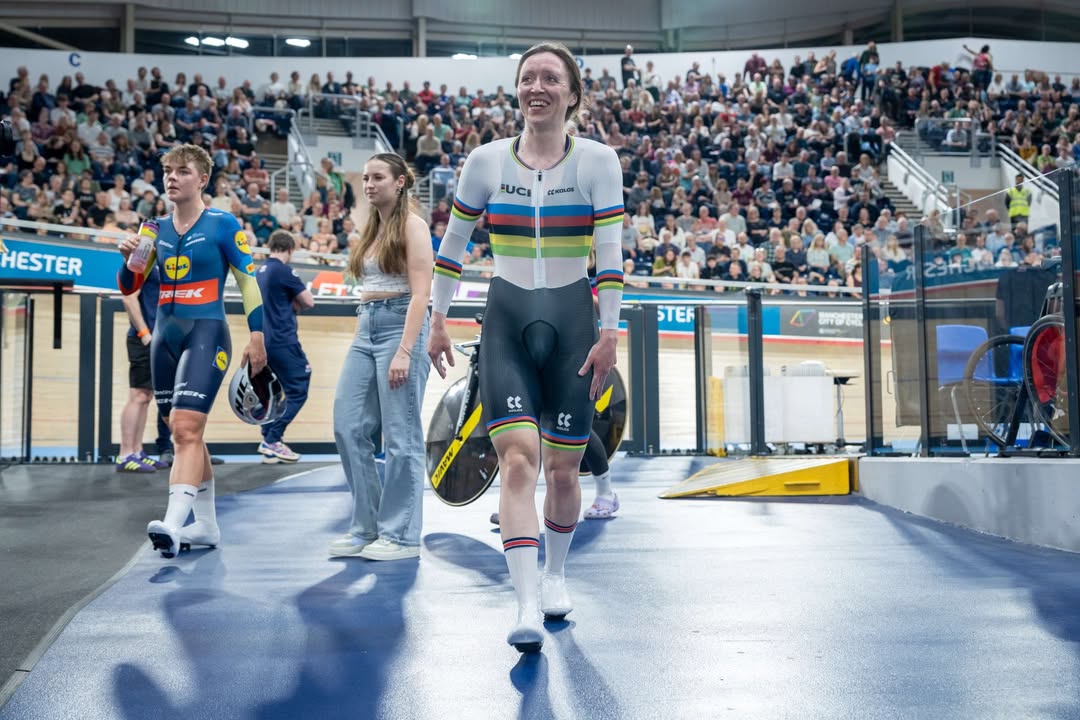
Feb 22, 2025
249K followers
Engagement Rate
1.011%
Brand Engagement Across Channels
Cross-channels analysis of the engagement
Brand Engagement Across Channels
| Channels | Engagement | Avg. Engagement |
|---|---|---|
| Twitter | 20K | 61.04 |
| Facebook | 47K | 290.55 |
| Average | 33K | 175.8 |
Brand Video Views Across Channels
Cross-channels analysis of the engagement
Brand Video Views Across Channels
| Channels | Video Views | Avg. Video Views |
|---|---|---|
| Twitter | 571K | 8923 |
| Facebook | 2.5M | 38K |
| Average | 1.5M | 24K |
Similar Brands
Explore top-performing brands from the Sports Industry


Ready to improve your social media strategy with real-time insights
Get strategic insights, analyze the social performance across all channels, compare metrics from different periods and download reports in seconds.