Zinda Foods Brand Overview
See social media performance data for Zinda Foods
Zinda Foods
0.58%
Brand Avg Engagement RatePhoto
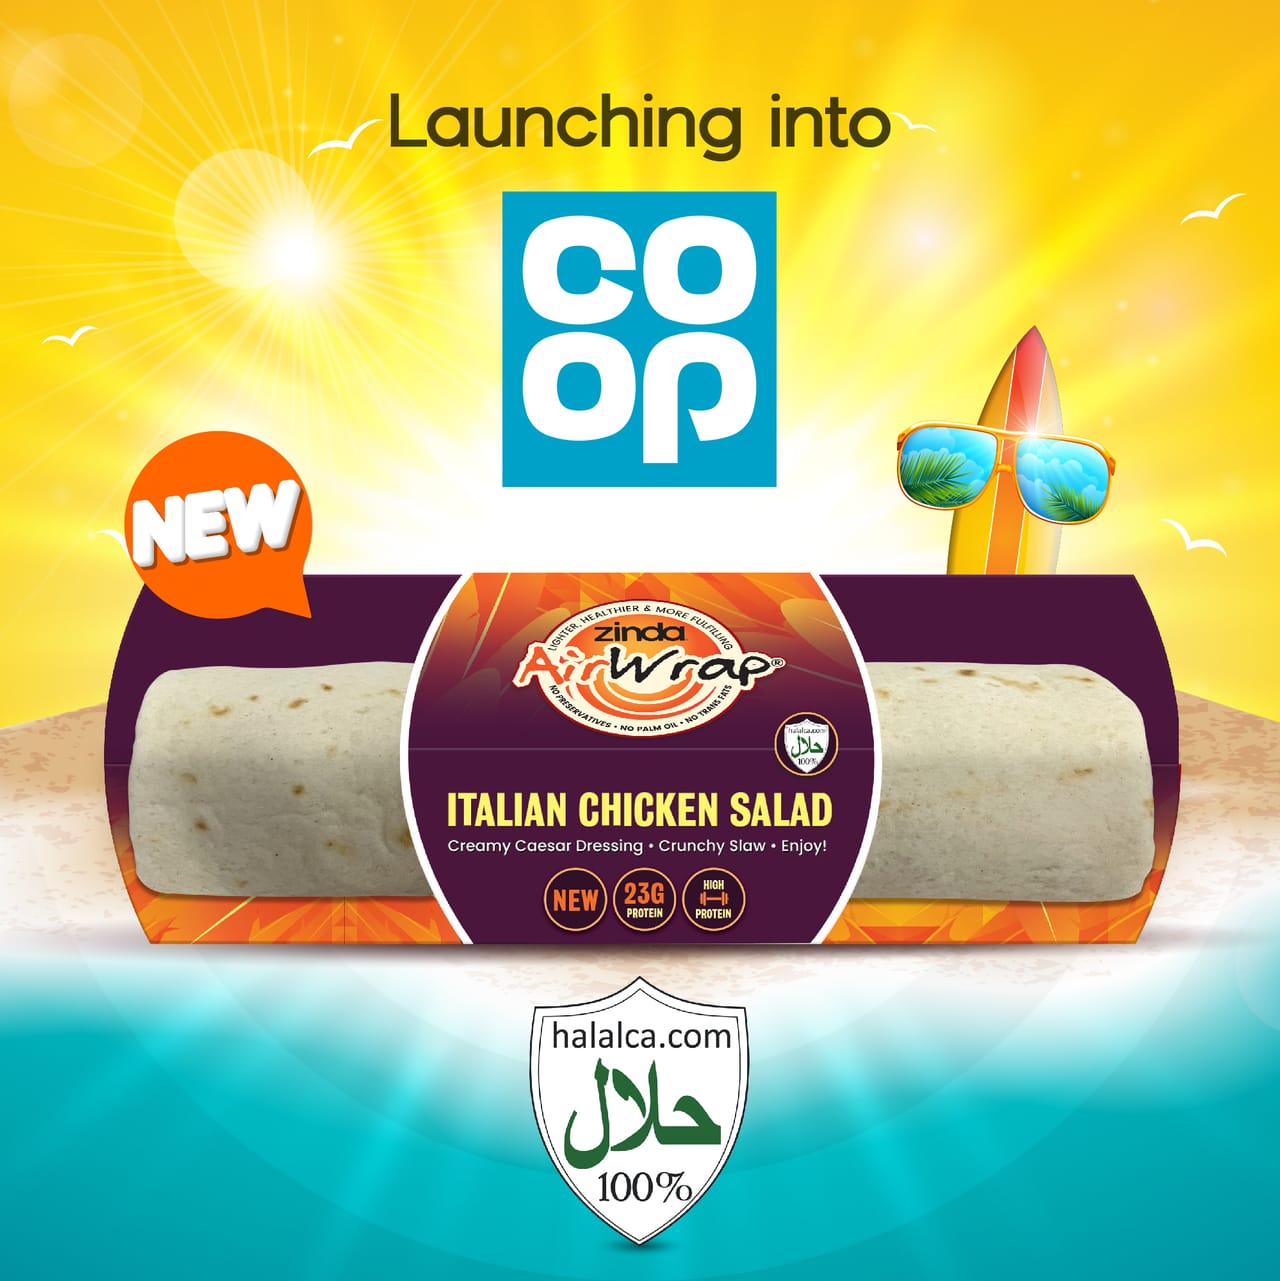
Top Content (By Eng. Rate)365.22
Avg. Brand Video ViewsBrand Posts Across Channels
Cross-channels analysis of the post
Brand Posts Across Channels
| Channels | Posts | Avg. Posts/Day |
|---|---|---|
 Twitter Twitter | 0 | 0 |
 Facebook Facebook | 0 | 0 |
 Instagram Instagram | 7 | 0.04 |
| Total | 7 | 0.04 |
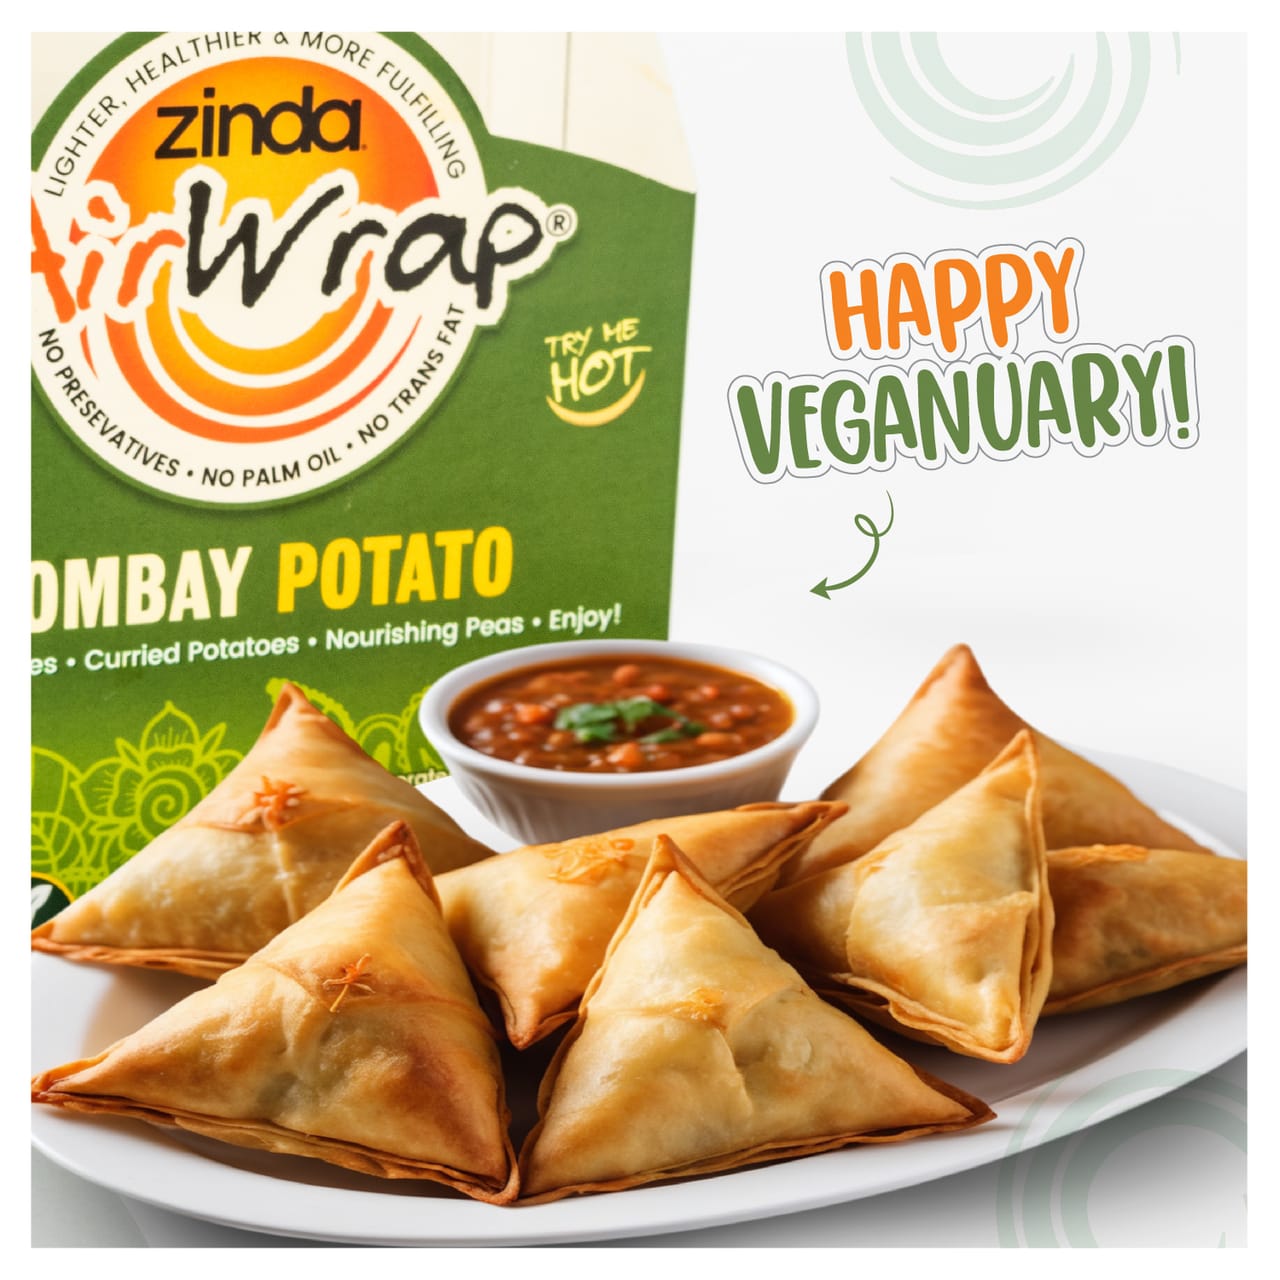
Top Posts
Zinda Foods Instagram

Mar 22, 2025
2949 followers
Engagement Rate
8.647%
Zinda Foods Instagram
Apr 2, 2025
2949 followers
Engagement Rate
0.848%
Zinda Foods Instagram
Jan 10, 2025
2949 followers
Engagement Rate
0.678%
Brand Engagement Across Channels
Cross-channels analysis of the engagement
Brand Engagement Across Channels
| Channels | Engagement | Avg. Engagement |
|---|---|---|
| Twitter | 0 | 0 |
| Facebook | 0 | 0 |
| Instagram | 362 | 51.71 |
| Average | 120.67 | 17.24 |
Brand Video Views Across Channels
Cross-channels analysis of the engagement
Brand Video Views Across Channels
| Channels | Video Views | Avg. Video Views |
|---|---|---|
| Twitter | 0 | 0 |
| Facebook | 0 | 0 |
| Instagram | 3287 | 1096 |
| Average | 1096 | 365.22 |
Similar Brands
Explore top-performing brands from the FMCG — Food Industry


Ready to improve your social media strategy with real-time insights
Get strategic insights, analyze the social performance across all channels, compare metrics from different periods and download reports in seconds.