Weetabix Food Company Brand Overview
See social media performance data for Weetabix Food Company
Weetabix Food Company
0.3%
Brand Avg Engagement RateReel
Top Content (By Eng. Rate)1252
Avg. Brand Video ViewsBrand Posts Across Channels
Cross-channels analysis of the post
Brand Posts Across Channels
| Channels | Posts | Avg. Posts/Day |
|---|---|---|
 Facebook Facebook | 0 | 0 |
 Instagram Instagram | 46 | 0.26 |
| Total | 46 | 0.26 |
Top Posts
Weetabix Food Co... Instagram
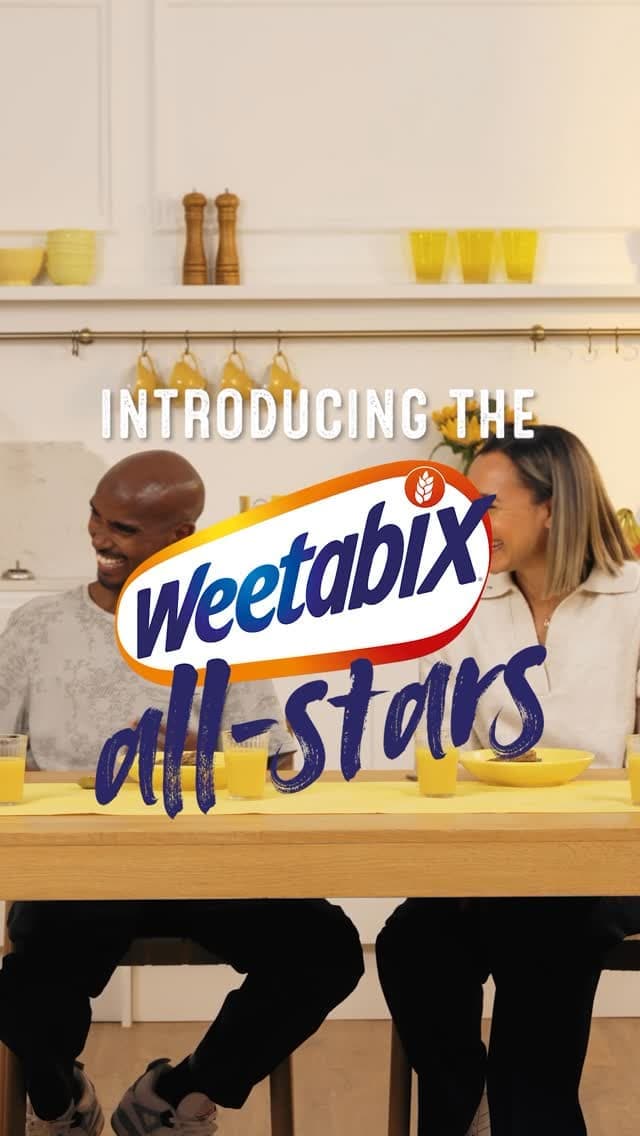
Jun 14, 2025
50K followers
Engagement Rate
8.495%
Weetabix Food Co... Instagram
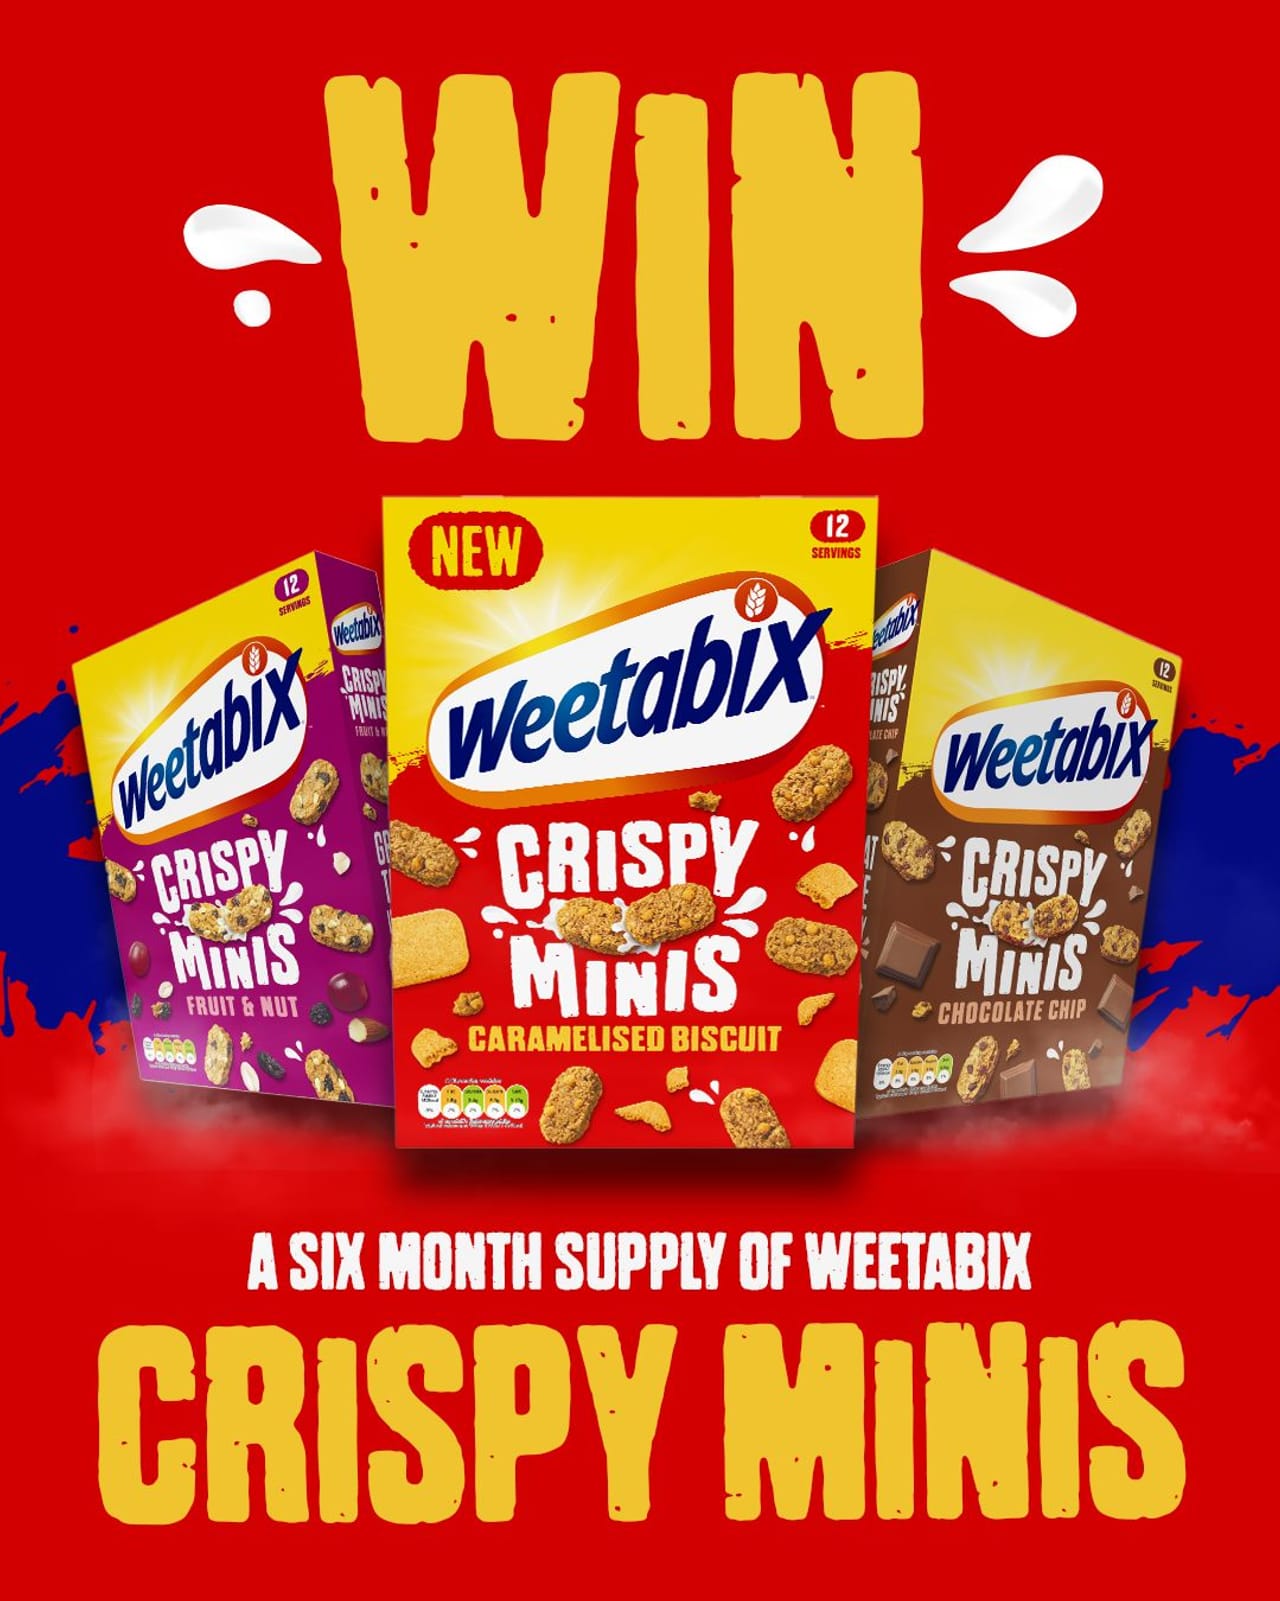
Apr 4, 2025
50K followers
Engagement Rate
7.275%
Weetabix Food Co... Instagram

Apr 17, 2025
50K followers
Engagement Rate
2.725%
Brand Engagement Across Channels
Cross-channels analysis of the engagement
Brand Engagement Across Channels
| Channels | Engagement | Avg. Engagement |
|---|---|---|
| Facebook | 0 | 0 |
| Instagram | 14K | 297.93 |
| Average | 6853 | 148.97 |
Brand Video Views Across Channels
Cross-channels analysis of the engagement
Brand Video Views Across Channels
| Channels | Video Views | Avg. Video Views |
|---|---|---|
| Facebook | 0 | 0 |
| Instagram | 50K | 2503 |
| Average | 25K | 1252 |
Similar Brands
Explore top-performing brands from the FMCG — Food Industry


Ready to improve your social media strategy with real-time insights
Get strategic insights, analyze the social performance across all channels, compare metrics from different periods and download reports in seconds.