University of Oxford Brand Overview
See social media performance data for University of Oxford

University of Oxford
0.74%
Brand Avg Engagement RateVideo
Top Content (By Eng. Rate)158K
Avg. Brand Video ViewsBrand Posts Across Channels
Cross-channels analysis of the post
Brand Posts Across Channels
| Channels | Posts | Avg. Posts/Day |
|---|---|---|
 Twitter Twitter | 566 | 3.14 |
 TikTok TikTok | 120 | 0.67 |
 Facebook Facebook | 221 | 1.23 |
 Instagram Instagram | 240 | 1.33 |
| Total | 1147 | 6.37 |
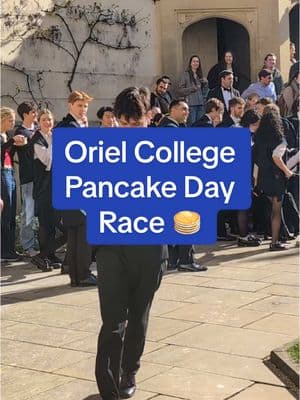
Top Posts
University of Ox... TikTok

Jan 16, 2025
789K followers
Engagement Rate
148.822%
University of Ox... TikTok

Mar 25, 2025
789K followers
Engagement Rate
45.334%
University of Ox... TikTok
Mar 4, 2025
789K followers
Engagement Rate
35.029%
Brand Engagement Across Channels
Cross-channels analysis of the engagement
Brand Engagement Across Channels
| Channels | Engagement | Avg. Engagement |
|---|---|---|
| Twitter | 153K | 269.81 |
| TikTok | 2.8M | 24K |
| Facebook | 669K | 3028 |
| Instagram | 3.0M | 13K |
| Average | 1.7M | 9873 |
Brand Video Views Across Channels
Cross-channels analysis of the engagement
Brand Video Views Across Channels
| Channels | Video Views | Avg. Video Views |
|---|---|---|
| Twitter | 504K | 17K |
| TikTok | 23M | 193K |
| Facebook | 19M | 228K |
| Instagram | 40M | 352K |
| Average | 21M | 198K |
Similar Brands
Explore top-performing brands from the Education Industry


Ready to improve your social media strategy with real-time insights
Get strategic insights, analyze the social performance across all channels, compare metrics from different periods and download reports in seconds.