Imperial College London Brand Overview
See social media performance data for Imperial College London

Imperial College London
0.96%
Brand Avg Engagement RateVideo
Top Content (By Eng. Rate)13K
Avg. Brand Video ViewsBrand Posts Across Channels
Cross-channels analysis of the post
Brand Posts Across Channels
| Channels | Posts | Avg. Posts/Day |
|---|---|---|
 YouTube YouTube | 109 | 0.61 |
 Twitter Twitter | 346 | 1.92 |
 TikTok TikTok | 119 | 0.66 |
 Facebook Facebook | 240 | 1.33 |
 Instagram Instagram | 110 | 0.61 |
| Total | 924 | 5.13 |
Top Posts
Imperial College... TikTok
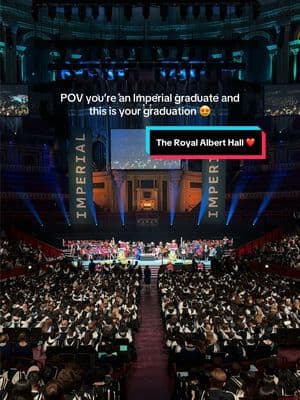
Jun 2, 2025
25K followers
Engagement Rate
131.806%
Imperial College... TikTok

Jun 30, 2025
26K followers
Engagement Rate
99.359%
Imperial College... TikTok

May 31, 2025
25K followers
Engagement Rate
62.771%
Brand Engagement Across Channels
Cross-channels analysis of the engagement
Brand Engagement Across Channels
| Channels | Engagement | Avg. Engagement |
|---|---|---|
| YouTube | 2555 | 23.44 |
| Twitter | 6190 | 17.89 |
| TikTok | 127K | 1069 |
| Facebook | 5633 | 23.47 |
| Instagram | 124K | 1124 |
| Average | 53K | 451.59 |
Brand Video Views Across Channels
Cross-channels analysis of the engagement
Brand Video Views Across Channels
| Channels | Video Views | Avg. Video Views |
|---|---|---|
| YouTube | 3.2M | 29K |
| Twitter | 84K | 4663 |
| TikTok | 1.6M | 14K |
| Facebook | 129K | 2308 |
| Instagram | 1.1M | 14K |
| Average | 1.2M | 13K |
Similar Brands
Explore top-performing brands from the Education Industry


Ready to improve your social media strategy with real-time insights
Get strategic insights, analyze the social performance across all channels, compare metrics from different periods and download reports in seconds.