Pai Skincare Brand Overview
See social media performance data for Pai Skincare

Pai Skincare
0.1%
Brand Avg Engagement RateVideo
Top Content (By Eng. Rate)1703
Avg. Brand Video ViewsBrand Posts Across Channels
Cross-channels analysis of the post
Brand Posts Across Channels
| Channels | Posts | Avg. Posts/Day |
|---|---|---|
 Twitter Twitter | 0 | 0 |
 TikTok TikTok | 99 | 0.55 |
 Facebook Facebook | 162 | 0.9 |
 Instagram Instagram | 113 | 0.63 |
| Total | 374 | 2.08 |
Top Posts
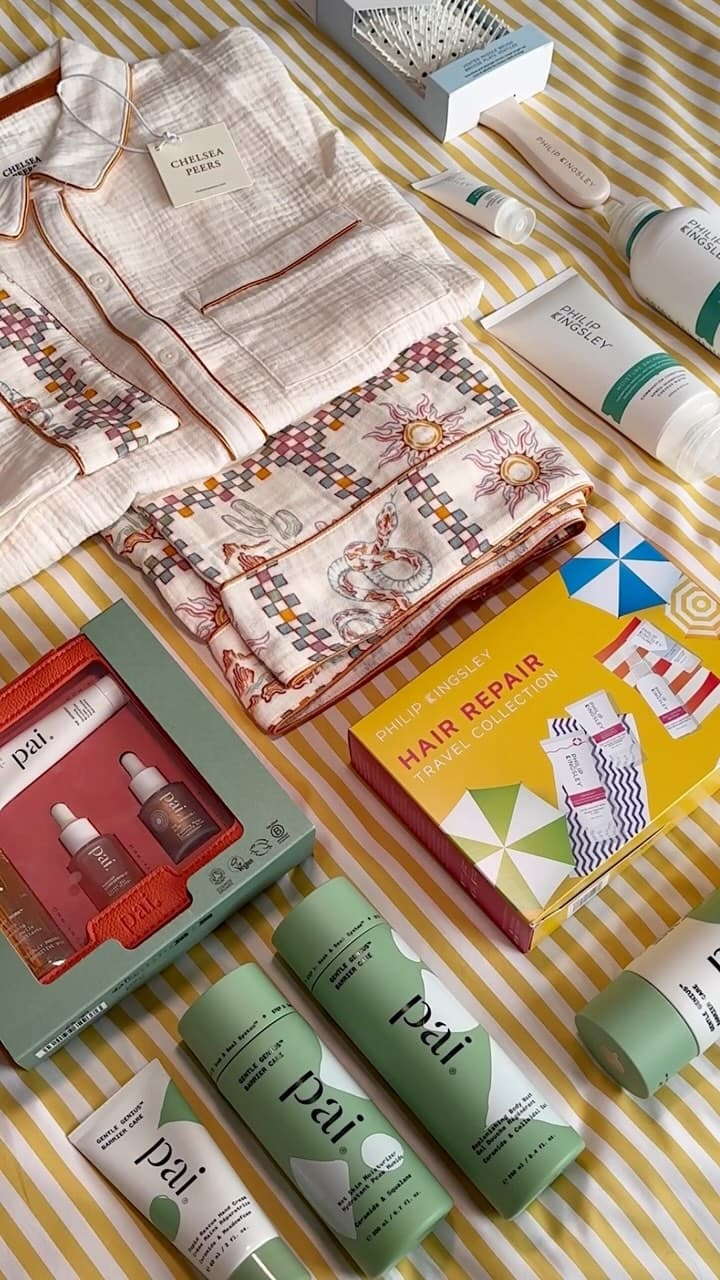
Pai Skincare TikTok
Feb 20, 2025
13K followers
Engagement Rate
2.812%
Pai Skincare TikTok
Feb 27, 2025
13K followers
Engagement Rate
1.692%
 Pai Skincare
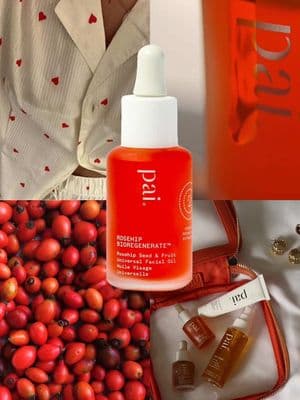
 Instagram
Jun 23, 2025
162K followers
Engagement Rate
1.604%
Brand Engagement Across Channels
Cross-channels analysis of the engagement
Brand Engagement Across Channels
| Channels | Engagement | Avg. Engagement |
|---|---|---|
| Twitter | 0 | 0 |
| TikTok | 4612 | 46.59 |
| Facebook | 994 | 6.14 |
| Instagram | 23K | 200.88 |
| Average | 7076 | 63.4 |
Brand Video Views Across Channels
Cross-channels analysis of the engagement
Brand Video Views Across Channels
| Channels | Video Views | Avg. Video Views |
|---|---|---|
| Twitter | 0 | 0 |
| TikTok | 586K | 5914 |
| Facebook | 33K | 543.07 |
| Instagram | 210K | 2057 |
| Average | 207K | 2129 |
Similar Brands
Explore top-performing brands from the Beauty & Cosmetics Industry


Ready to improve your social media strategy with real-time insights
Get strategic insights, analyze the social performance across all channels, compare metrics from different periods and download reports in seconds.