H10 Hotels Brand Overview
See social media performance data for H10 Hotels

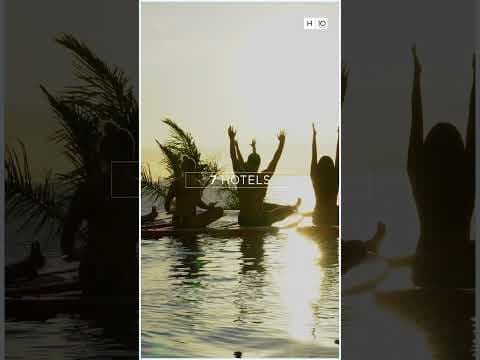
H10 Hotels
0.25%
Brand Avg Engagement RateVideo
Top Content (By Eng. Rate)45K
Avg. Brand Video ViewsBrand Posts Across Channels
Cross-channels analysis of the post
Brand Posts Across Channels
| Channels | Posts | Avg. Posts/Day |
|---|---|---|
 YouTube YouTube | 72 | 0.4 |
 TikTok TikTok | 22 | 0.12 |
 Facebook Facebook | 31 | 0.17 |
 Instagram Instagram | 56 | 0.31 |
| Total | 181 | 1.01 |
Top Posts
 H10 Hotels
 YouTube
Apr 29, 2025
5050 followers
Engagement Rate
2.317%
H10 Hotels YouTube

Jun 23, 2025
5050 followers
Engagement Rate
2.139%
H10 Hotels TikTok

Jan 28, 2025
5109 followers
Engagement Rate
1.448%
Brand Engagement Across Channels
Cross-channels analysis of the engagement
Brand Engagement Across Channels
| Channels | Engagement | Avg. Engagement |
|---|---|---|
| YouTube | 479 | 6.65 |
| TikTok | 735 | 33.41 |
| Facebook | 932 | 30.06 |
| Instagram | 8610 | 153.75 |
| Average | 2689 | 55.97 |
Brand Video Views Across Channels
Cross-channels analysis of the engagement
Brand Video Views Across Channels
| Channels | Video Views | Avg. Video Views |
|---|---|---|
| YouTube | 12M | 171K |
| TikTok | 48K | 2173 |
| Facebook | 4806 | 4806 |
| Instagram | 36K | 1886 |
| Average | 3.1M | 45K |
Similar Brands
Explore top-performing brands from the Hospitality & Hotels Industry


Ready to improve your social media strategy with real-time insights
Get strategic insights, analyze the social performance across all channels, compare metrics from different periods and download reports in seconds.