Kia Brand Overview
See social media performance data for Kia

Kia
0.37%
Brand Avg Engagement RateVideo
Top Content (By Eng. Rate)104K
Avg. Brand Video ViewsBrand Posts Across Channels
Cross-channels analysis of the post
Brand Posts Across Channels
| Channels | Posts | Avg. Posts/Day |
|---|---|---|
 Twitter Twitter | 137 | 0.76 |
 TikTok TikTok | 113 | 0.63 |
 Facebook Facebook | 102 | 0.57 |
 Instagram Instagram | 137 | 0.76 |
| Total | 489 | 2.72 |
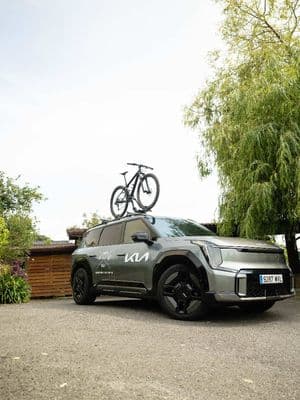
Top Posts
Kia TikTok

Feb 11, 2025
43K followers
Engagement Rate
14.549%
Kia TikTok
Jun 20, 2025
43K followers
Engagement Rate
9.77%
Kia TikTok

Mar 10, 2025
43K followers
Engagement Rate
7.197%
Brand Engagement Across Channels
Cross-channels analysis of the engagement
Brand Engagement Across Channels
| Channels | Engagement | Avg. Engagement |
|---|---|---|
| Twitter | 1425 | 10.4 |
| TikTok | 66K | 584.12 |
| Facebook | 27K | 263.38 |
| Instagram | 2039 | 14.88 |
| Average | 24K | 218.2 |
Brand Video Views Across Channels
Cross-channels analysis of the engagement
Brand Video Views Across Channels
| Channels | Video Views | Avg. Video Views |
|---|---|---|
| Twitter | 31K | 562.56 |
| TikTok | 32M | 280K |
| Facebook | 8.4M | 135K |
| Instagram | 16K | 162.67 |
| Average | 10M | 104K |
Similar Brands
Explore top-performing brands from the Automotive Industry


Ready to improve your social media strategy with real-time insights
Get strategic insights, analyze the social performance across all channels, compare metrics from different periods and download reports in seconds.