Esselunga Brand Overview
See social media performance data for Esselunga
Esselunga
0.24%
Brand Avg Engagement RateCarousel Album
Top Content (By Eng. Rate)33K
Avg. Brand Video ViewsBrand Posts Across Channels
Cross-channels analysis of the post
Brand Posts Across Channels
| Channels | Posts | Avg. Posts/Day |
|---|---|---|
 Facebook Facebook | 89 | 0.49 |
 Instagram Instagram | 55 | 0.31 |
| Total | 144 | 0.8 |
Top Posts
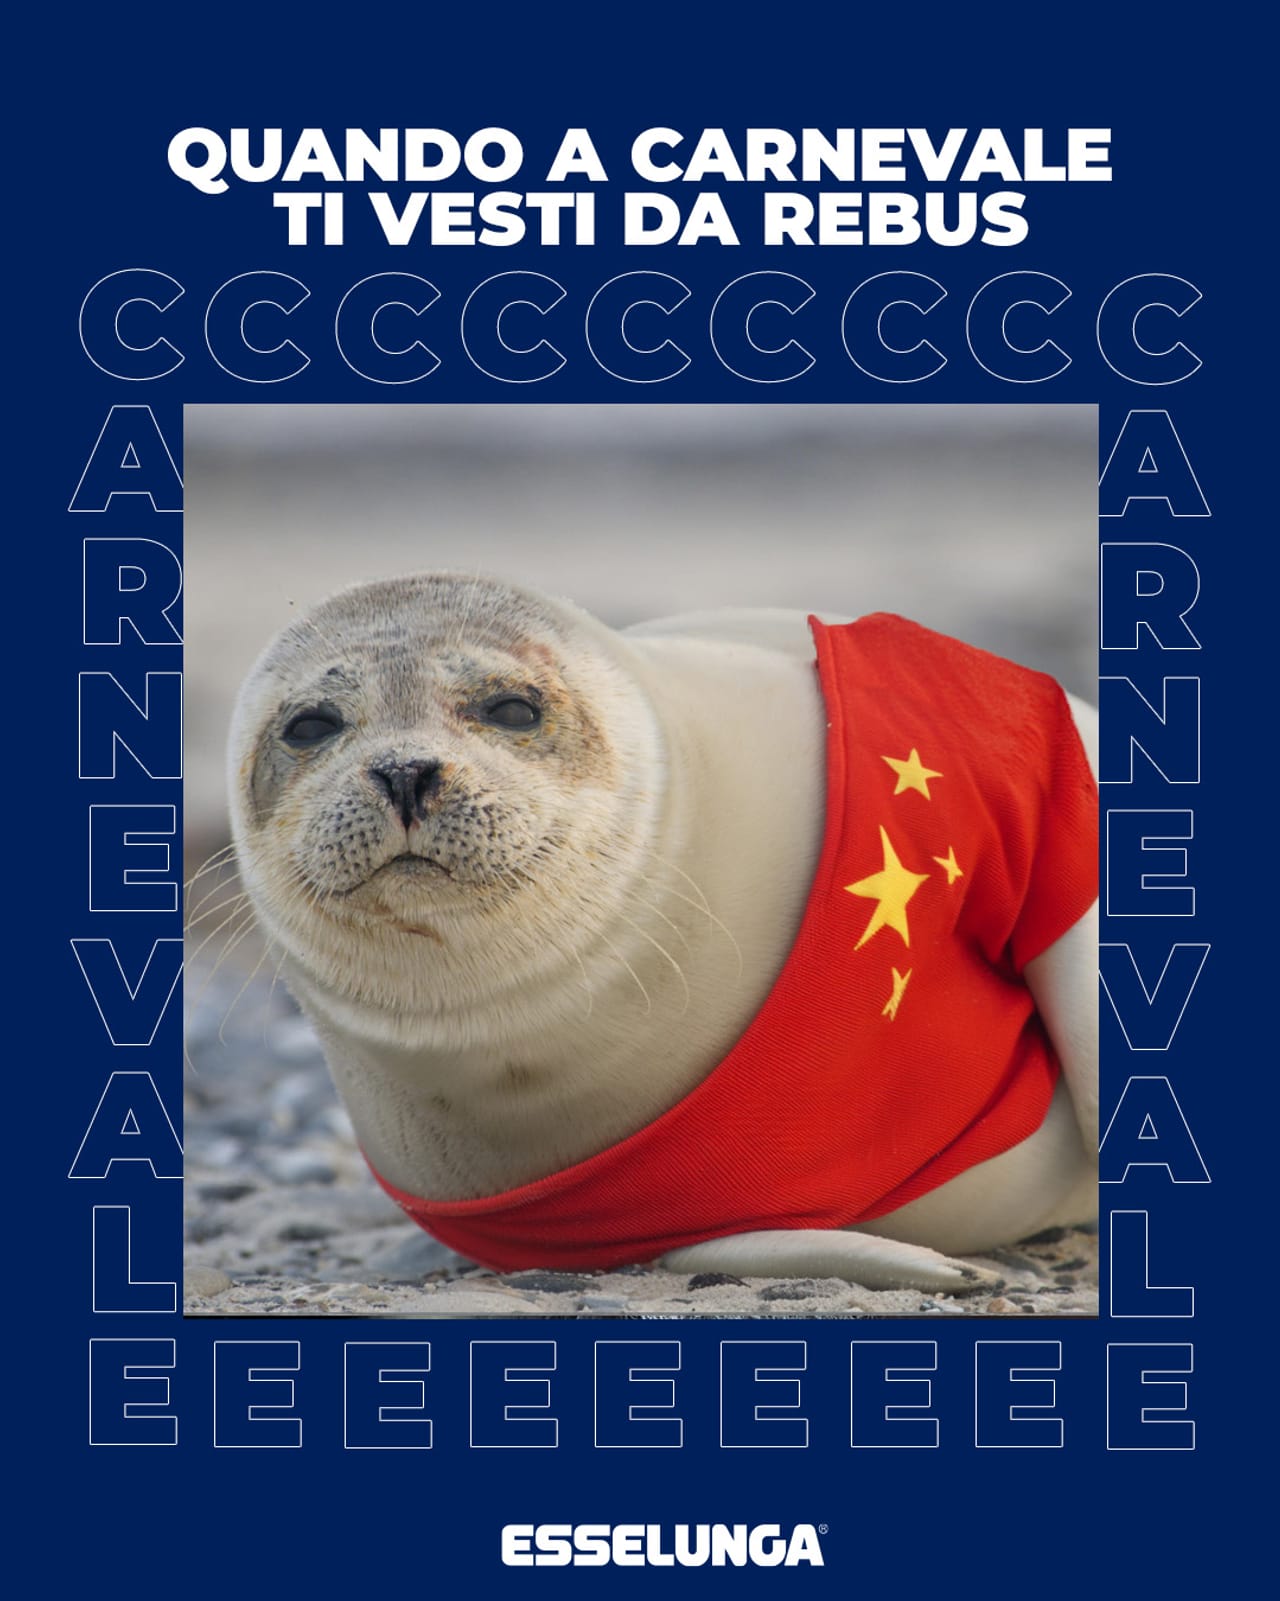
Esselunga Instagram

Mar 28, 2025
277K followers
Engagement Rate
3.636%
Esselunga Instagram

Mar 28, 2025
265K followers
Engagement Rate
1.488%
Esselunga Instagram
Mar 4, 2025
277K followers
Engagement Rate
1.435%
Brand Engagement Across Channels
Cross-channels analysis of the engagement
Brand Engagement Across Channels
| Channels | Engagement | Avg. Engagement |
|---|---|---|
| Facebook | 48K | 541.12 |
| Instagram | 65K | 1177 |
| Average | 56K | 859.26 |
Brand Video Views Across Channels
Cross-channels analysis of the engagement
Brand Video Views Across Channels
| Channels | Video Views | Avg. Video Views |
|---|---|---|
| Facebook | 458K | 57K |
| Instagram | 155K | 8599 |
| Average | 307K | 33K |
Similar Brands
Explore top-performing brands from the Retail Industry


Ready to improve your social media strategy with real-time insights
Get strategic insights, analyze the social performance across all channels, compare metrics from different periods and download reports in seconds.