Coop Brand Overview
See social media performance data for Coop
Coop
0.15%
Brand Avg Engagement RatePhoto
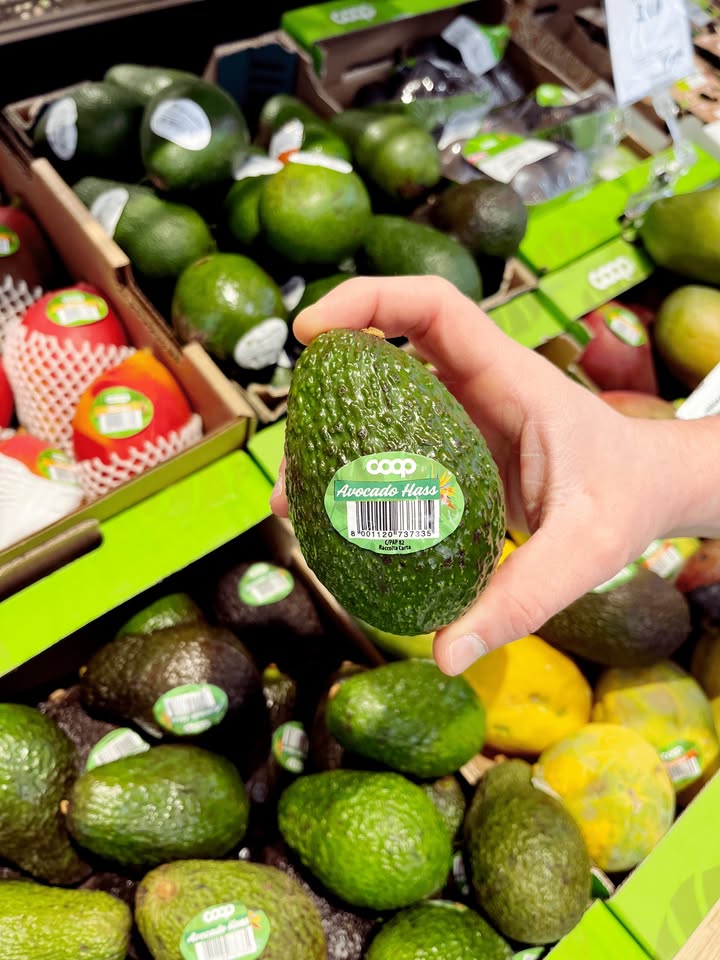
Top Content (By Eng. Rate)16K
Avg. Brand Video ViewsBrand Posts Across Channels
Cross-channels analysis of the post
Brand Posts Across Channels
| Channels | Posts | Avg. Posts/Day |
|---|---|---|
 YouTube YouTube | 28 | 0.16 |
 Facebook Facebook | 115 | 0.64 |
 Instagram Instagram | 88 | 0.49 |
| Total | 231 | 1.28 |
Top Posts
Coop Facebook

Mar 14, 2025
376K followers
Engagement Rate
2.465%
Coop Facebook
Apr 23, 2025
376K followers
Engagement Rate
2.26%
Coop Facebook

Mar 12, 2025
376K followers
Engagement Rate
1.753%
Brand Engagement Across Channels
Cross-channels analysis of the engagement
Brand Engagement Across Channels
| Channels | Engagement | Avg. Engagement |
|---|---|---|
| YouTube | 111 | 3.96 |
| Facebook | 113K | 983.62 |
| Instagram | 13K | 145.83 |
| Average | 42K | 377.8 |
Brand Video Views Across Channels
Cross-channels analysis of the engagement
Brand Video Views Across Channels
| Channels | Video Views | Avg. Video Views |
|---|---|---|
| YouTube | 557K | 20K |
| Facebook | 425K | 24K |
| Instagram | 131K | 5678 |
| Average | 371K | 16K |
Similar Brands
Explore top-performing brands from the Retail Industry


Ready to improve your social media strategy with real-time insights
Get strategic insights, analyze the social performance across all channels, compare metrics from different periods and download reports in seconds.