Barilla Brand Overview
See social media performance data for Barilla
Barilla
0.32%
Brand Avg Engagement RatePhoto
Top Content (By Eng. Rate)98K
Avg. Brand Video ViewsBrand Posts Across Channels
Cross-channels analysis of the post
Brand Posts Across Channels
| Channels | Posts | Avg. Posts/Day |
|---|---|---|
 YouTube YouTube | 4 | 0.02 |
 Twitter Twitter | 18 | 0.1 |
 Facebook Facebook | 9 | 0.05 |
 Instagram Instagram | 47 | 0.26 |
| Total | 78 | 0.43 |
Top Posts
Barilla Instagram
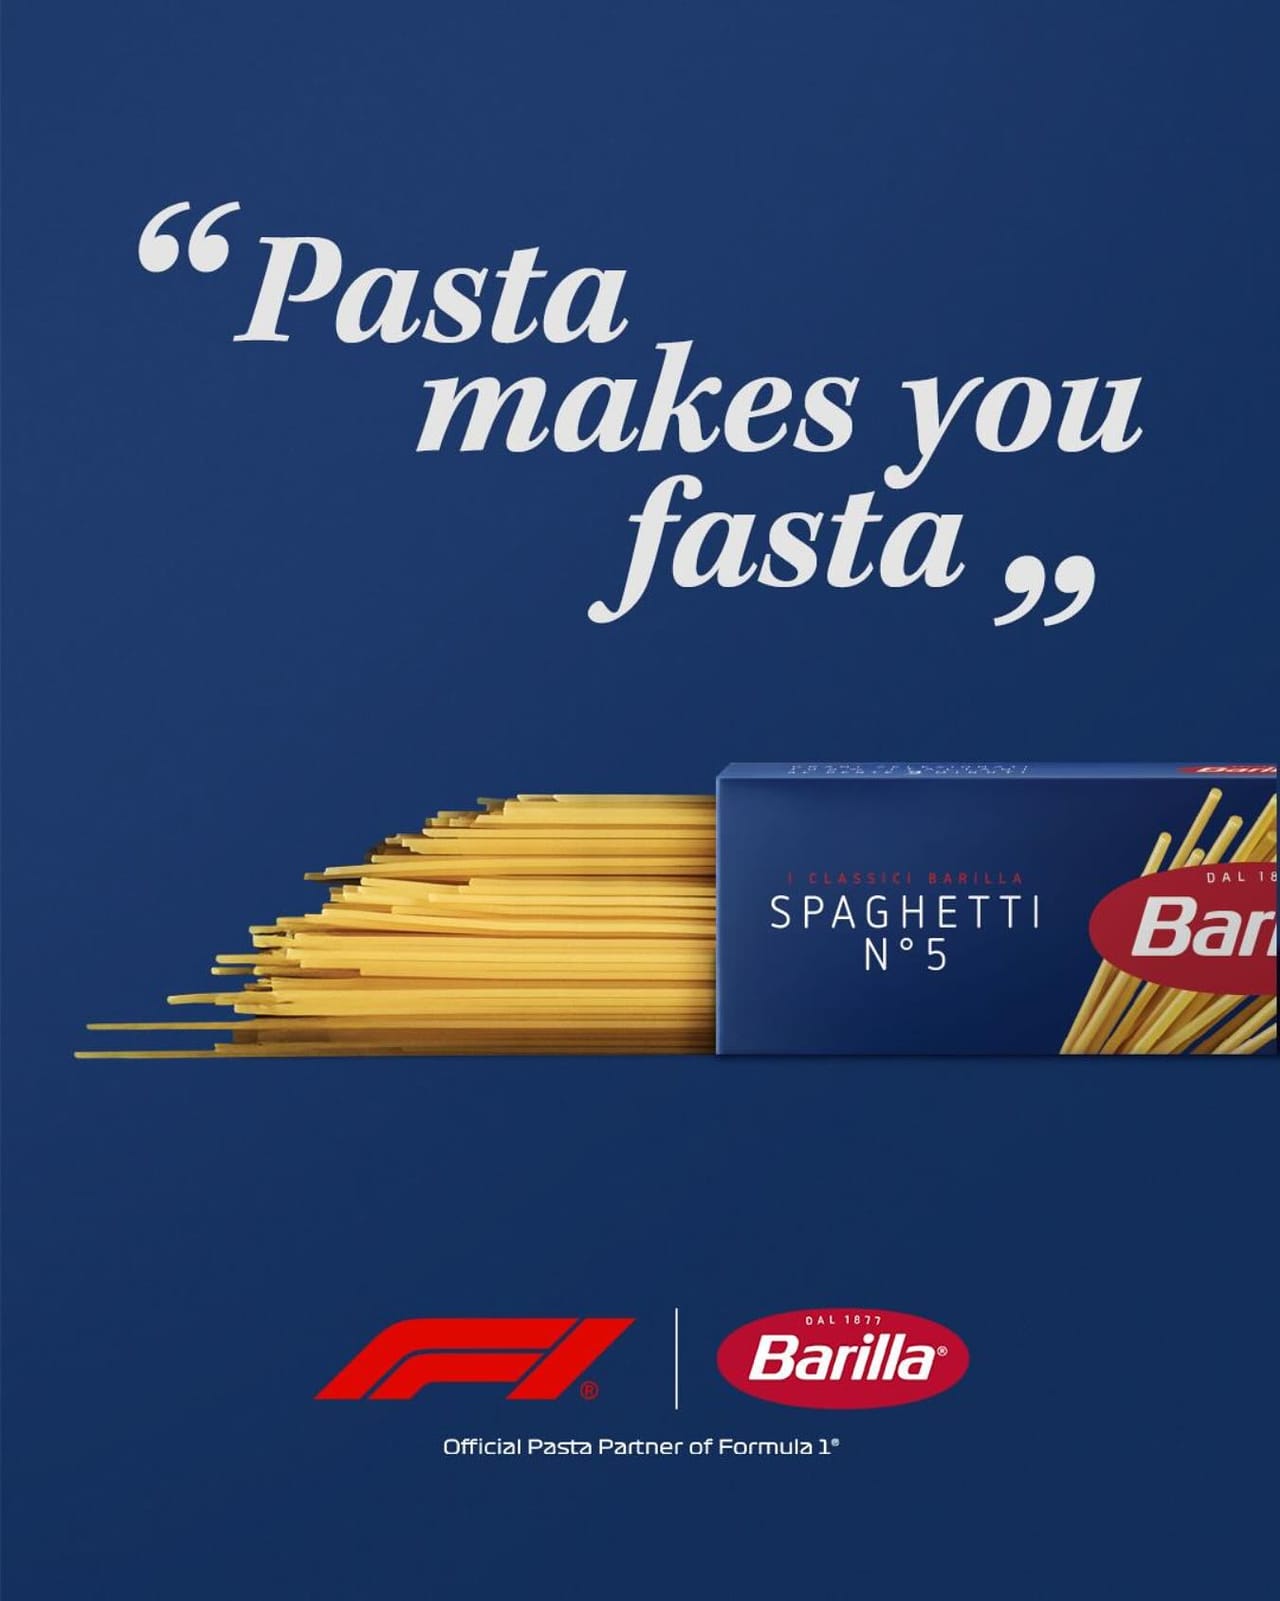
Apr 13, 2025
201K followers
Engagement Rate
24.257%
Barilla Instagram
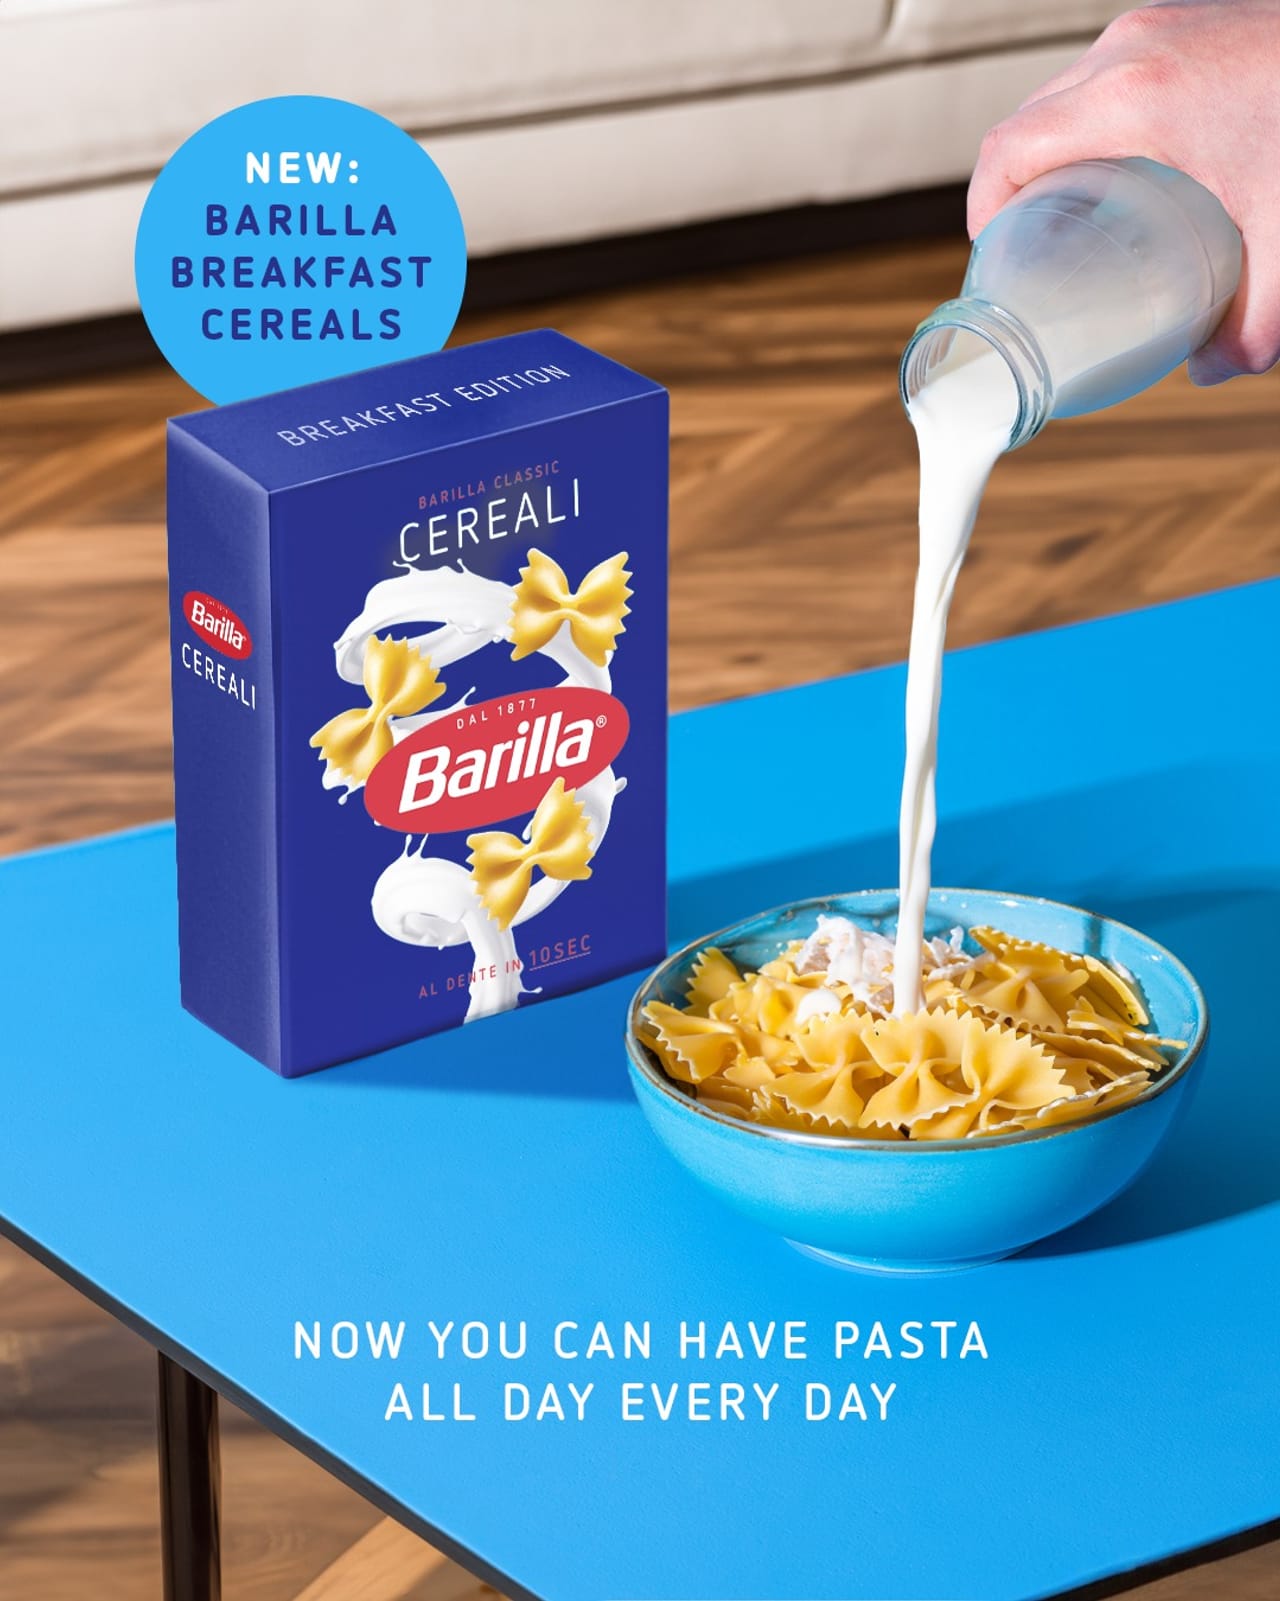
Apr 1, 2025
201K followers
Engagement Rate
11.1%
Barilla Instagram
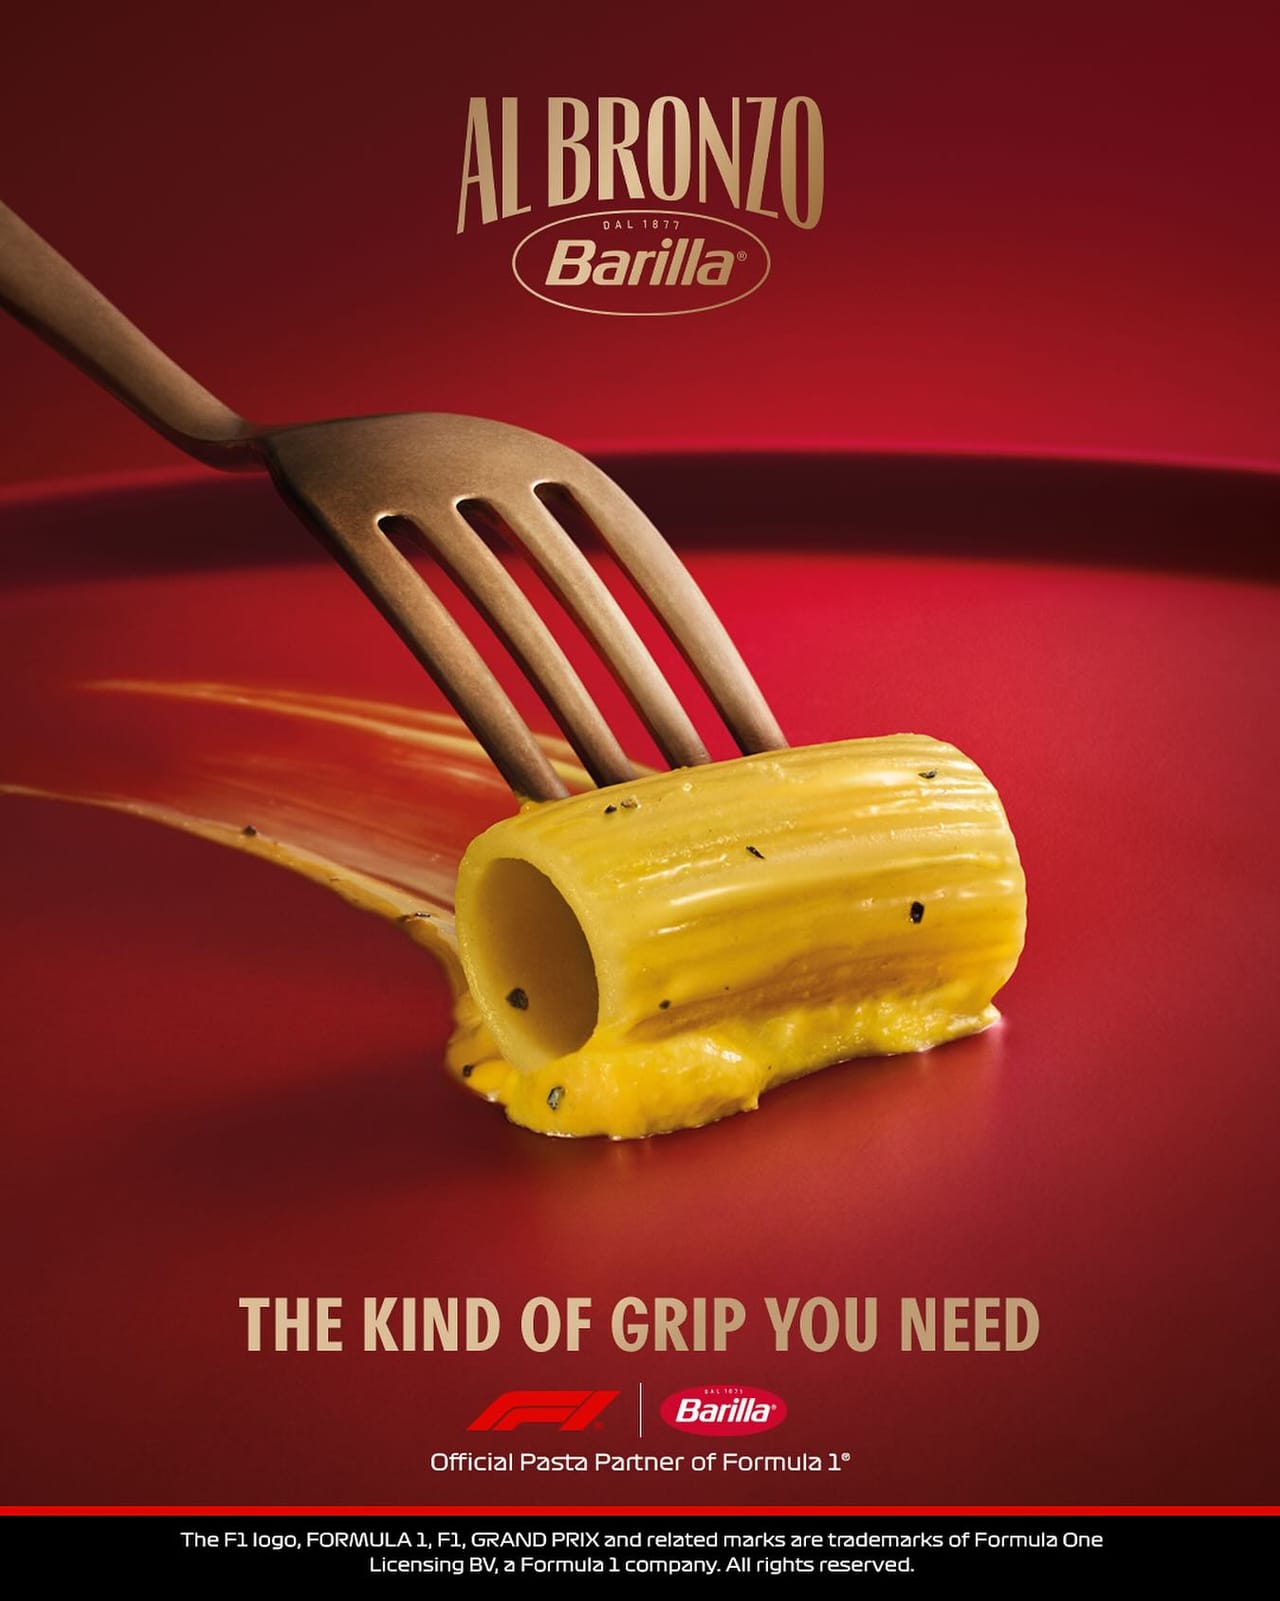
May 25, 2025
201K followers
Engagement Rate
3.662%
Brand Engagement Across Channels
Cross-channels analysis of the engagement
Brand Engagement Across Channels
| Channels | Engagement | Avg. Engagement |
|---|---|---|
| YouTube | 3 | 0.75 |
| Twitter | 182 | 10.11 |
| Facebook | 222 | 24.67 |
| Instagram | 114K | 2426 |
| Average | 29K | 615.46 |
Brand Video Views Across Channels
Cross-channels analysis of the engagement
Brand Video Views Across Channels
| Channels | Video Views | Avg. Video Views |
|---|---|---|
| YouTube | 1.5M | 379K |
| Twitter | 668 | 334 |
| Facebook | 0 | 0 |
| Instagram | 416K | 11K |
| Average | 483K | 98K |
Similar Brands
Explore top-performing brands from the FMCG — Food Industry


Ready to improve your social media strategy with real-time insights
Get strategic insights, analyze the social performance across all channels, compare metrics from different periods and download reports in seconds.