Tomarchio Bibite Brand Overview
See social media performance data for Tomarchio Bibite

Tomarchio Bibite
0.27%
Brand Avg Engagement RateReel
Top Content (By Eng. Rate)363.84
Avg. Brand Video ViewsBrand Posts Across Channels
Cross-channels analysis of the post
Brand Posts Across Channels
| Channels | Posts | Avg. Posts/Day |
|---|---|---|
 YouTube YouTube | 0 | 0 |
 Facebook Facebook | 21 | 0.12 |
 Instagram Instagram | 44 | 0.24 |
| Total | 65 | 0.36 |
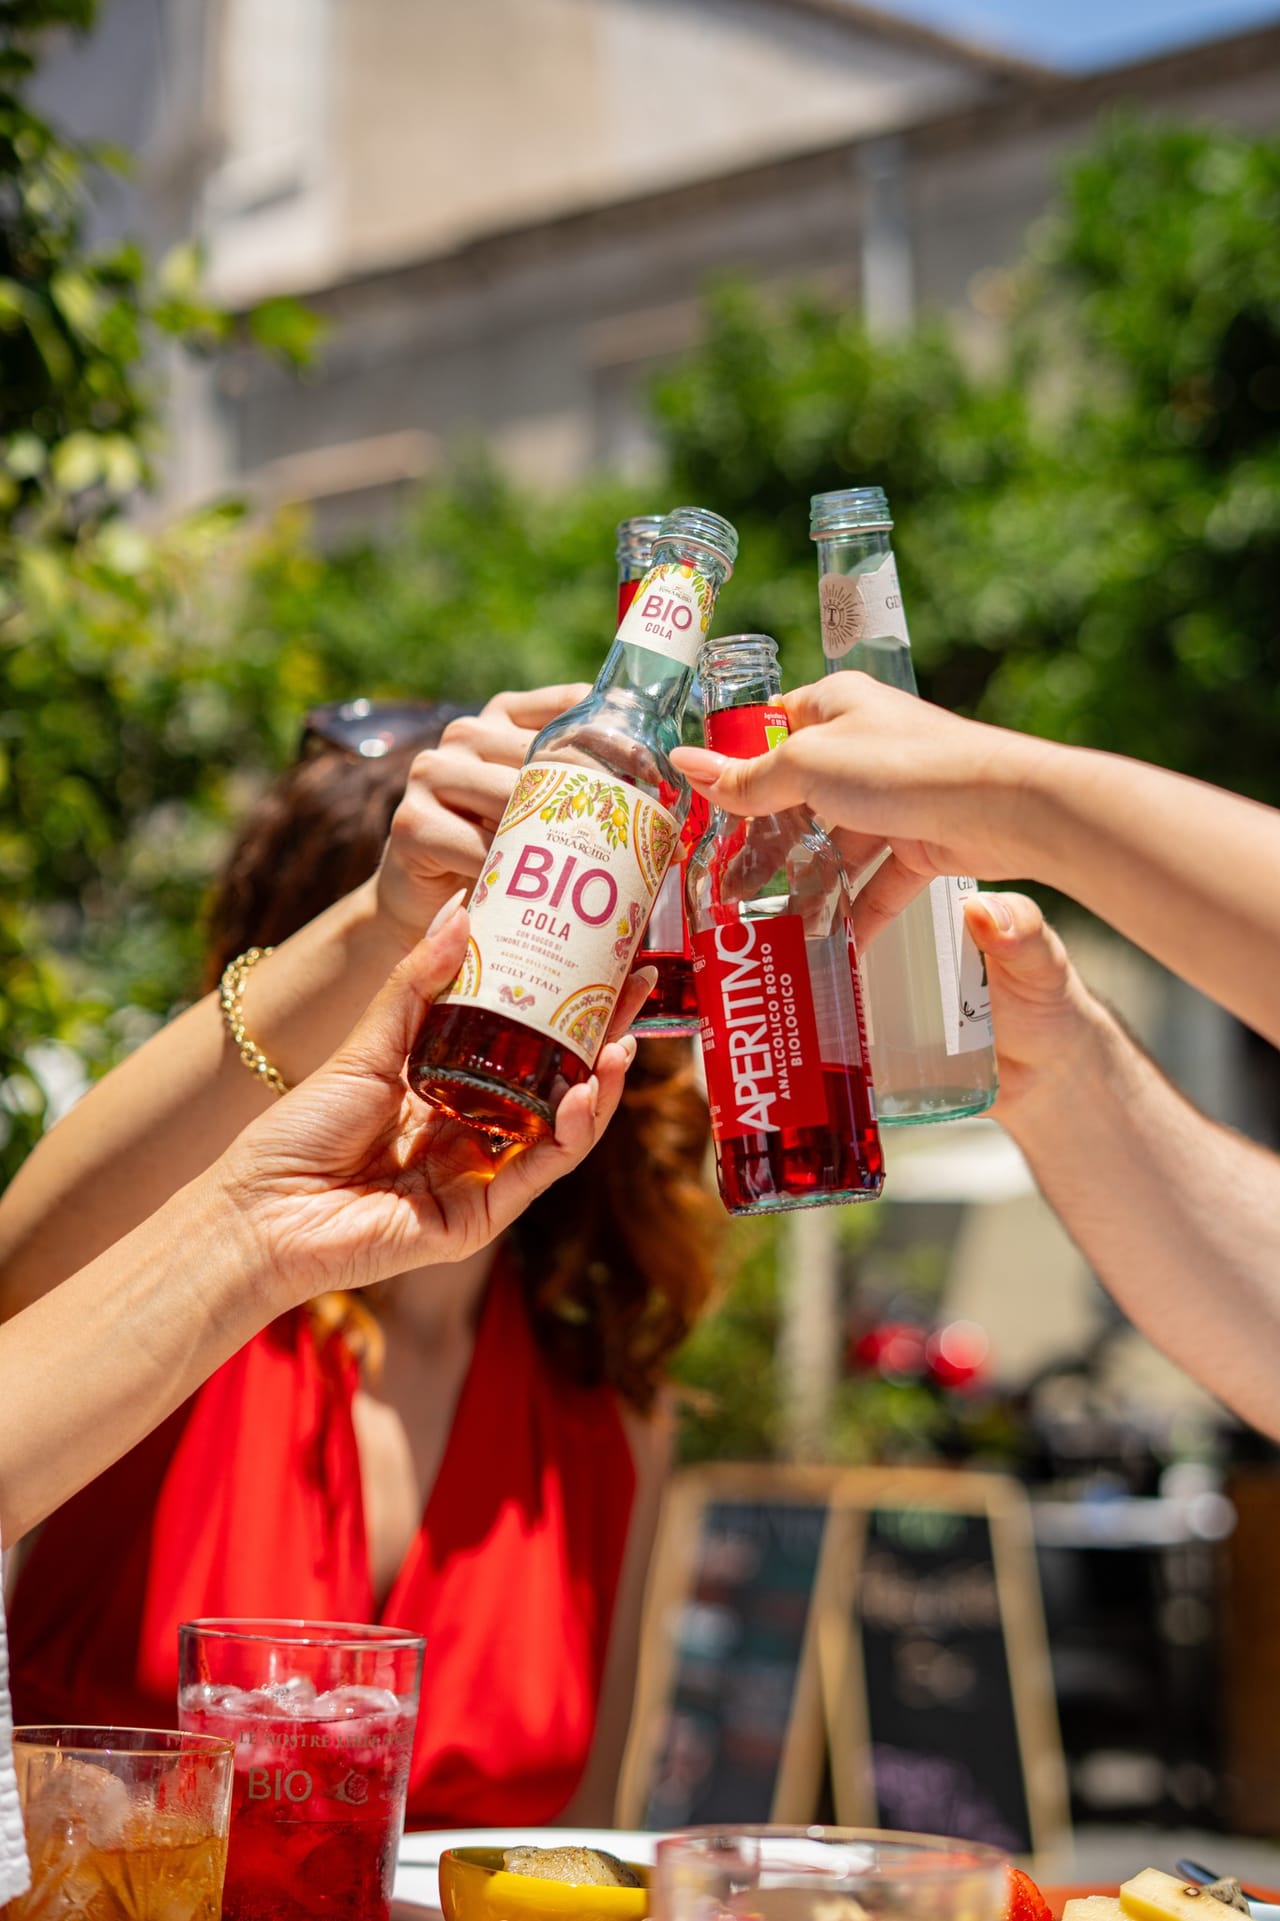
Top Posts
Tomarchio Bibite Instagram

Jun 10, 2025
4145 followers
Engagement Rate
3.064%
Tomarchio Bibite Instagram
Jun 18, 2025
4145 followers
Engagement Rate
2.123%
Tomarchio Bibite Instagram

Feb 11, 2025
4145 followers
Engagement Rate
1.785%
Brand Engagement Across Channels
Cross-channels analysis of the engagement
Brand Engagement Across Channels
| Channels | Engagement | Avg. Engagement |
|---|---|---|
| YouTube | 0 | 0 |
| Facebook | 171 | 8.14 |
| Instagram | 1387 | 31.52 |
| Average | 519.33 | 13.22 |
Brand Video Views Across Channels
Cross-channels analysis of the engagement
Brand Video Views Across Channels
| Channels | Video Views | Avg. Video Views |
|---|---|---|
| YouTube | 0 | 0 |
| Facebook | 3242 | 540.33 |
| Instagram | 6063 | 551.18 |
| Average | 3102 | 363.84 |
Similar Brands
Explore top-performing brands from the FMCG — Beverages Industry


Ready to improve your social media strategy with real-time insights
Get strategic insights, analyze the social performance across all channels, compare metrics from different periods and download reports in seconds.