Anex Tour GmbH Brand Overview
See social media performance data for Anex Tour GmbH
Anex Tour GmbH
0.92%
Brand Avg Engagement RatePhoto
Top Content (By Eng. Rate)1717
Avg. Brand Video ViewsBrand Posts Across Channels
Cross-channels analysis of the post
Brand Posts Across Channels
| Channels | Posts | Avg. Posts/Day |
|---|---|---|
 Facebook Facebook | 29 | 0.16 |
 Instagram Instagram | 37 | 0.21 |
| Total | 66 | 0.37 |
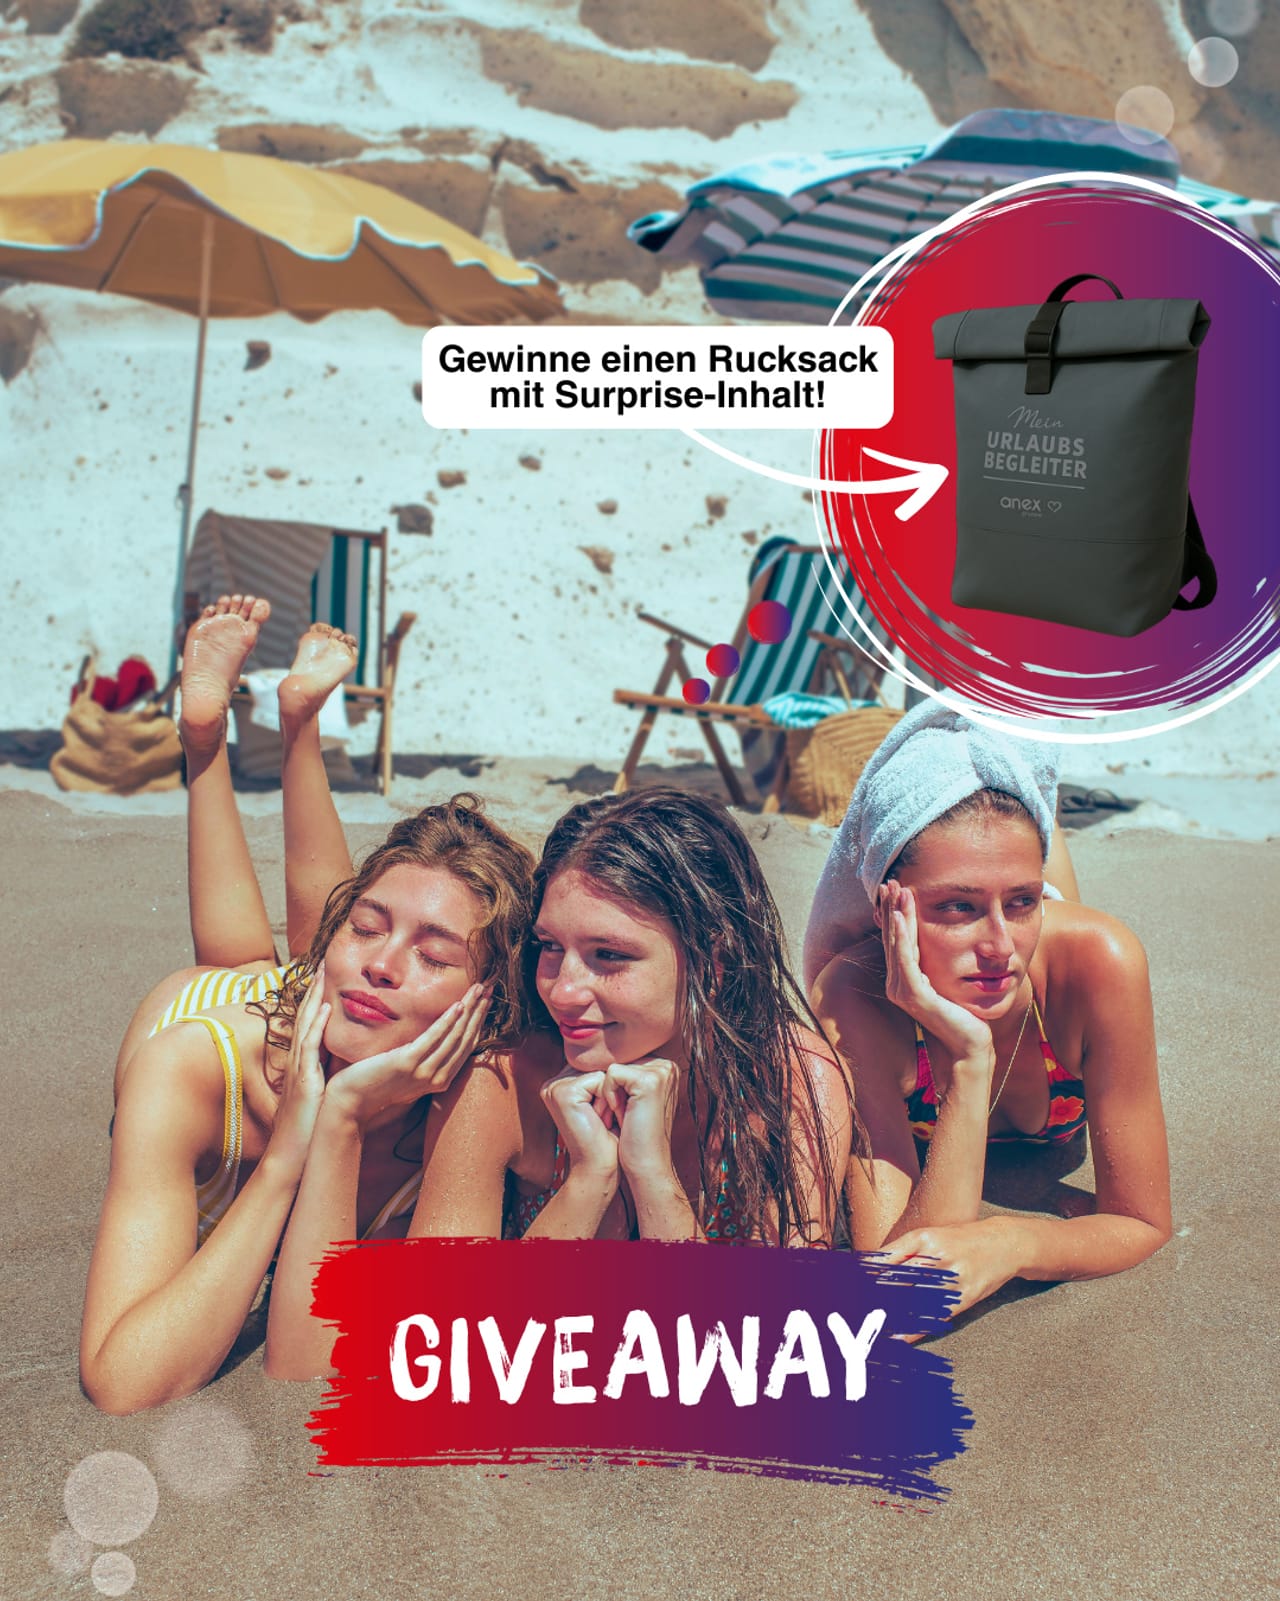
Top Posts
Anex Tour GmbH Instagram

Mar 7, 2025
8909 followers
Engagement Rate
38.579%
Anex Tour GmbH Instagram
Apr 29, 2025
8928 followers
Engagement Rate
12.242%
Anex Tour GmbH Instagram

Mar 5, 2025
8909 followers
Engagement Rate
1.089%
Brand Engagement Across Channels
Cross-channels analysis of the engagement
Brand Engagement Across Channels
| Channels | Engagement | Avg. Engagement |
|---|---|---|
| Facebook | 282 | 9.72 |
| Instagram | 5854 | 158.22 |
| Average | 3068 | 83.97 |
Brand Video Views Across Channels
Cross-channels analysis of the engagement
Brand Video Views Across Channels
| Channels | Video Views | Avg. Video Views |
|---|---|---|
| Facebook | 2686 | 671.5 |
| Instagram | 39K | 2763 |
| Average | 21K | 1717 |
Similar Brands
Explore top-performing brands from the Travel Industry


Ready to improve your social media strategy with real-time insights
Get strategic insights, analyze the social performance across all channels, compare metrics from different periods and download reports in seconds.