Alltours Brand Overview
See social media performance data for Alltours

Alltours
0.31%
Brand Avg Engagement RateVideo
Top Content (By Eng. Rate)59K
Avg. Brand Video ViewsBrand Posts Across Channels
Cross-channels analysis of the post
Brand Posts Across Channels
| Channels | Posts | Avg. Posts/Day |
|---|---|---|
 Twitter Twitter | 0 | 0 |
 TikTok TikTok | 54 | 0.3 |
 Facebook Facebook | 28 | 0.16 |
| Total | 82 | 0.46 |
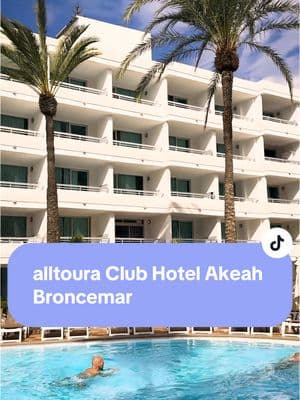
Top Posts
Alltours TikTok

Jan 3, 2025
85K followers
Engagement Rate
15.198%
Alltours TikTok

Jun 3, 2025
85K followers
Engagement Rate
6.297%
Alltours TikTok
Jan 21, 2025
85K followers
Engagement Rate
5.707%
Brand Engagement Across Channels
Cross-channels analysis of the engagement
Brand Engagement Across Channels
| Channels | Engagement | Avg. Engagement |
|---|---|---|
| Twitter | 0 | 0 |
| TikTok | 55K | 1011 |
| Facebook | 1004 | 35.86 |
| Average | 19K | 349.08 |
Brand Video Views Across Channels
Cross-channels analysis of the engagement
Brand Video Views Across Channels
| Channels | Video Views | Avg. Video Views |
|---|---|---|
| Twitter | 0 | 0 |
| TikTok | 13M | 237K |
| Facebook | 0 | 0 |
| Average | 4.3M | 79K |
Similar Brands
Explore top-performing brands from the Travel Industry


Ready to improve your social media strategy with real-time insights
Get strategic insights, analyze the social performance across all channels, compare metrics from different periods and download reports in seconds.