Robert Bosch GmbH Brand Overview
See social media performance data for Robert Bosch GmbH
Robert Bosch GmbH
0.39%
Brand Avg Engagement RatePhoto
Top Content (By Eng. Rate)379K
Avg. Brand Video ViewsBrand Posts Across Channels
Cross-channels analysis of the post
Brand Posts Across Channels
| Channels | Posts | Avg. Posts/Day |
|---|---|---|
 Twitter Twitter | 4 | 0.02 |
 Facebook Facebook | 83 | 0.46 |
 Instagram Instagram | 81 | 0.45 |
| Total | 168 | 0.93 |
Top Posts
 Robert Bosch Gmb...
 Instagram
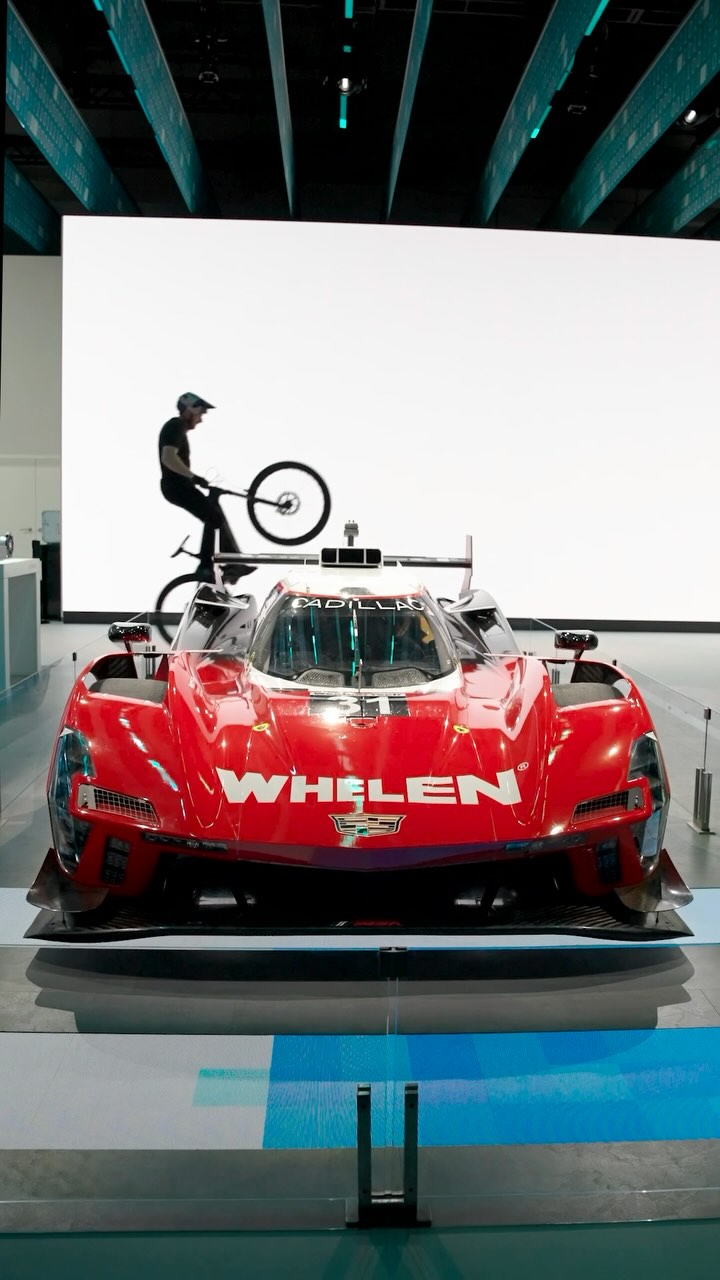
Jan 9, 2025
99K followers
Engagement Rate
6.623%
Robert Bosch Gmb... Facebook

Mar 17, 2025
1.3M followers
Engagement Rate
5.362%
Robert Bosch Gmb... Facebook

Jun 20, 2025
1.3M followers
Engagement Rate
3.997%
Brand Engagement Across Channels
Cross-channels analysis of the engagement
Brand Engagement Across Channels
| Channels | Engagement | Avg. Engagement |
|---|---|---|
| Twitter | 151 | 37.75 |
| Facebook | 766K | 9228 |
| Instagram | 35K | 430.38 |
| Average | 267K | 3232 |
Brand Video Views Across Channels
Cross-channels analysis of the engagement
Brand Video Views Across Channels
| Channels | Video Views | Avg. Video Views |
|---|---|---|
| Twitter | 0 | 0 |
| Facebook | 62M | 1.1M |
| Instagram | 295K | 5362 |
| Average | 21M | 379K |
Similar Brands
Explore top-performing brands from the Industrial & Manufacturing Industry


Ready to improve your social media strategy with real-time insights
Get strategic insights, analyze the social performance across all channels, compare metrics from different periods and download reports in seconds.