Haribo Brand Overview
See social media performance data for Haribo

Haribo
1.27%
Brand Avg Engagement RateVideo
Top Content (By Eng. Rate)26K
Avg. Brand Video ViewsBrand Posts Across Channels
Cross-channels analysis of the post
Brand Posts Across Channels
| Channels | Posts | Avg. Posts/Day |
|---|---|---|
 YouTube YouTube | 32 | 0.18 |
 Facebook Facebook | 84 | 0.47 |
 Instagram Instagram | 87 | 0.48 |
| Total | 203 | 1.13 |
Top Posts
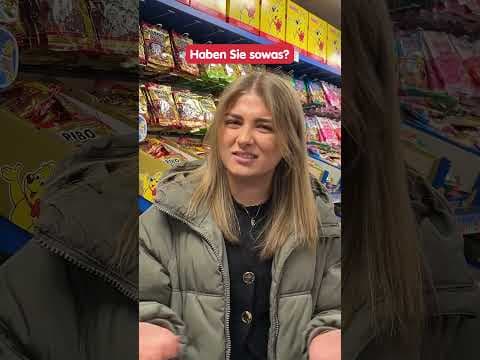
Haribo YouTube

Apr 2, 2025
13K followers
Engagement Rate
32.756%
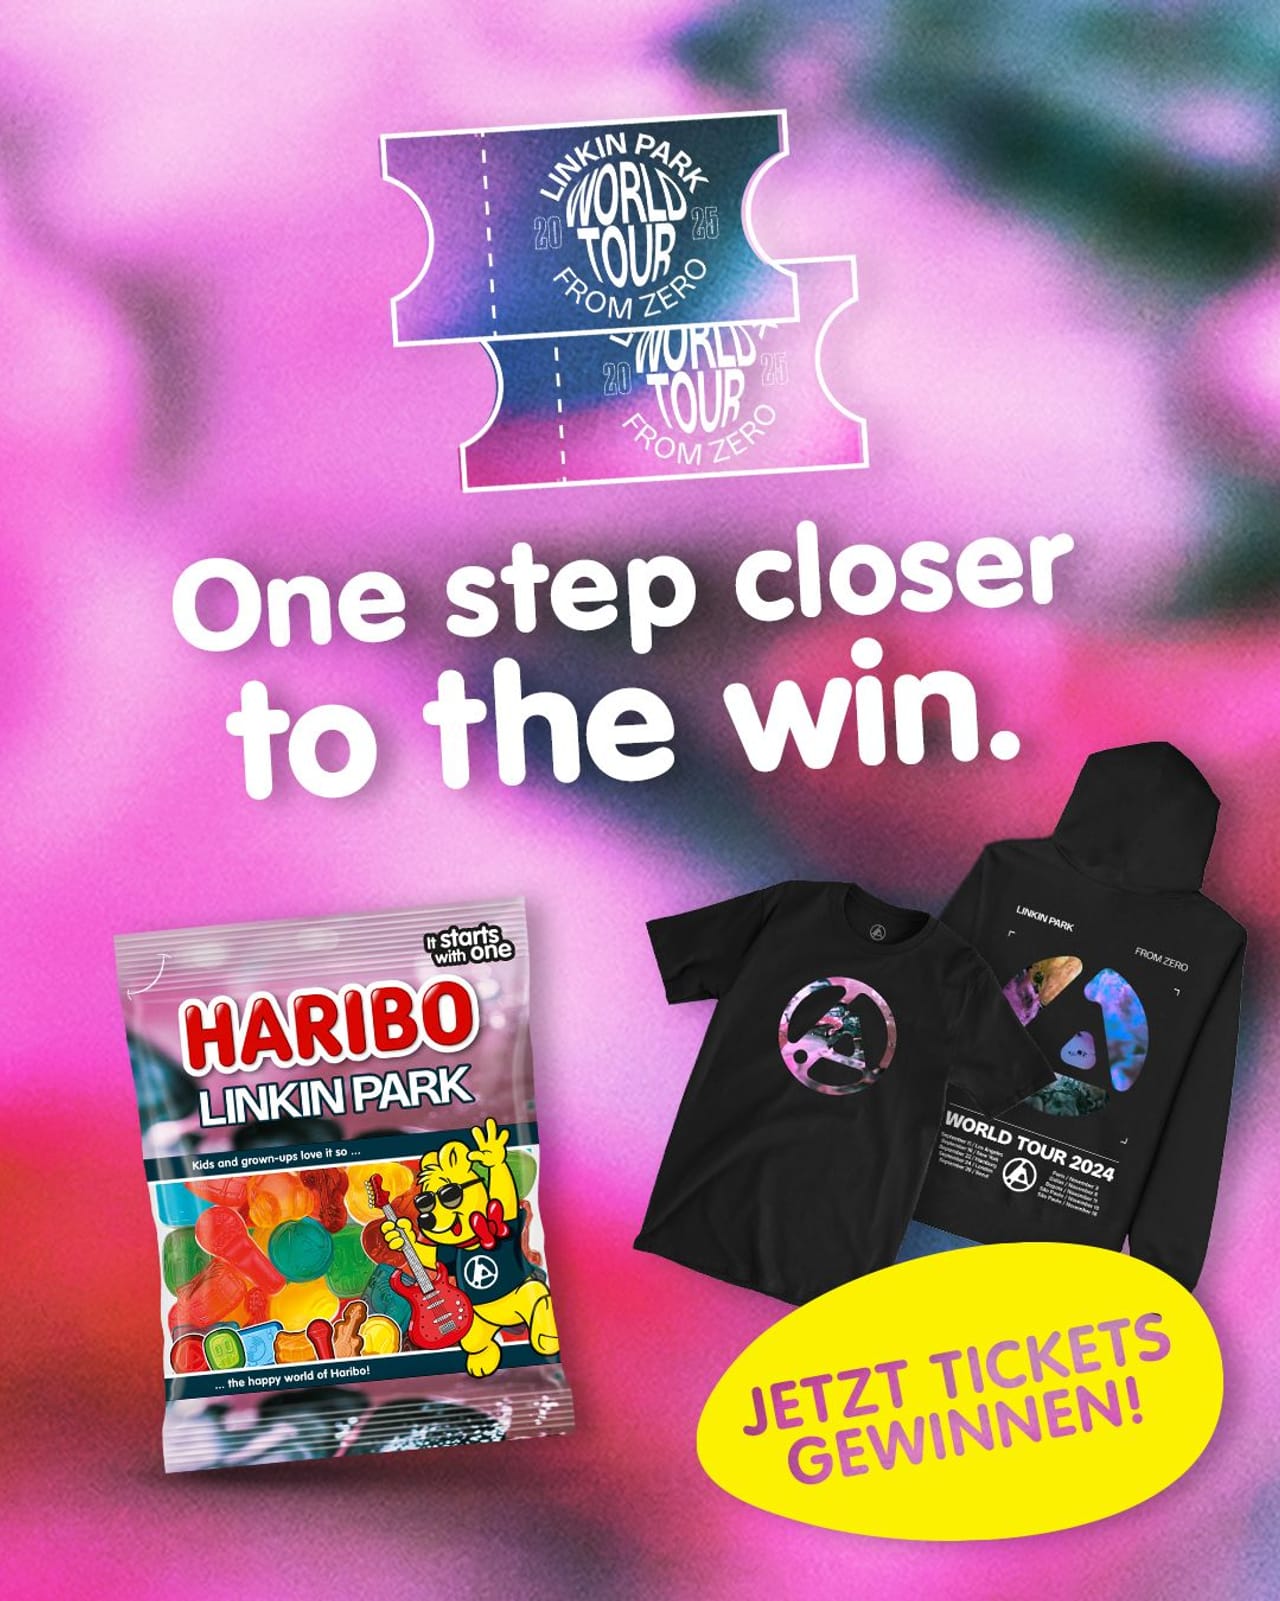
Haribo YouTube
Feb 18, 2025
13K followers
Engagement Rate
15.874%
 Haribo
 Instagram
Jun 15, 2025
180K followers
Engagement Rate
13.574%
Brand Engagement Across Channels
Cross-channels analysis of the engagement
Brand Engagement Across Channels
| Channels | Engagement | Avg. Engagement |
|---|---|---|
| YouTube | 12K | 385.66 |
| Facebook | 20K | 235.99 |
| Instagram | 120K | 1377 |
| Average | 51K | 666.31 |
Brand Video Views Across Channels
Cross-channels analysis of the engagement
Brand Video Views Across Channels
| Channels | Video Views | Avg. Video Views |
|---|---|---|
| YouTube | 900K | 28K |
| Facebook | 1.3M | 39K |
| Instagram | 501K | 12K |
| Average | 884K | 26K |
Similar Brands
Explore top-performing brands from the FMCG — Food Industry


Ready to improve your social media strategy with real-time insights
Get strategic insights, analyze the social performance across all channels, compare metrics from different periods and download reports in seconds.