Dr. Oetker Brand Overview
See social media performance data for Dr. Oetker
Dr. Oetker
0.47%
Brand Avg Engagement RateReel
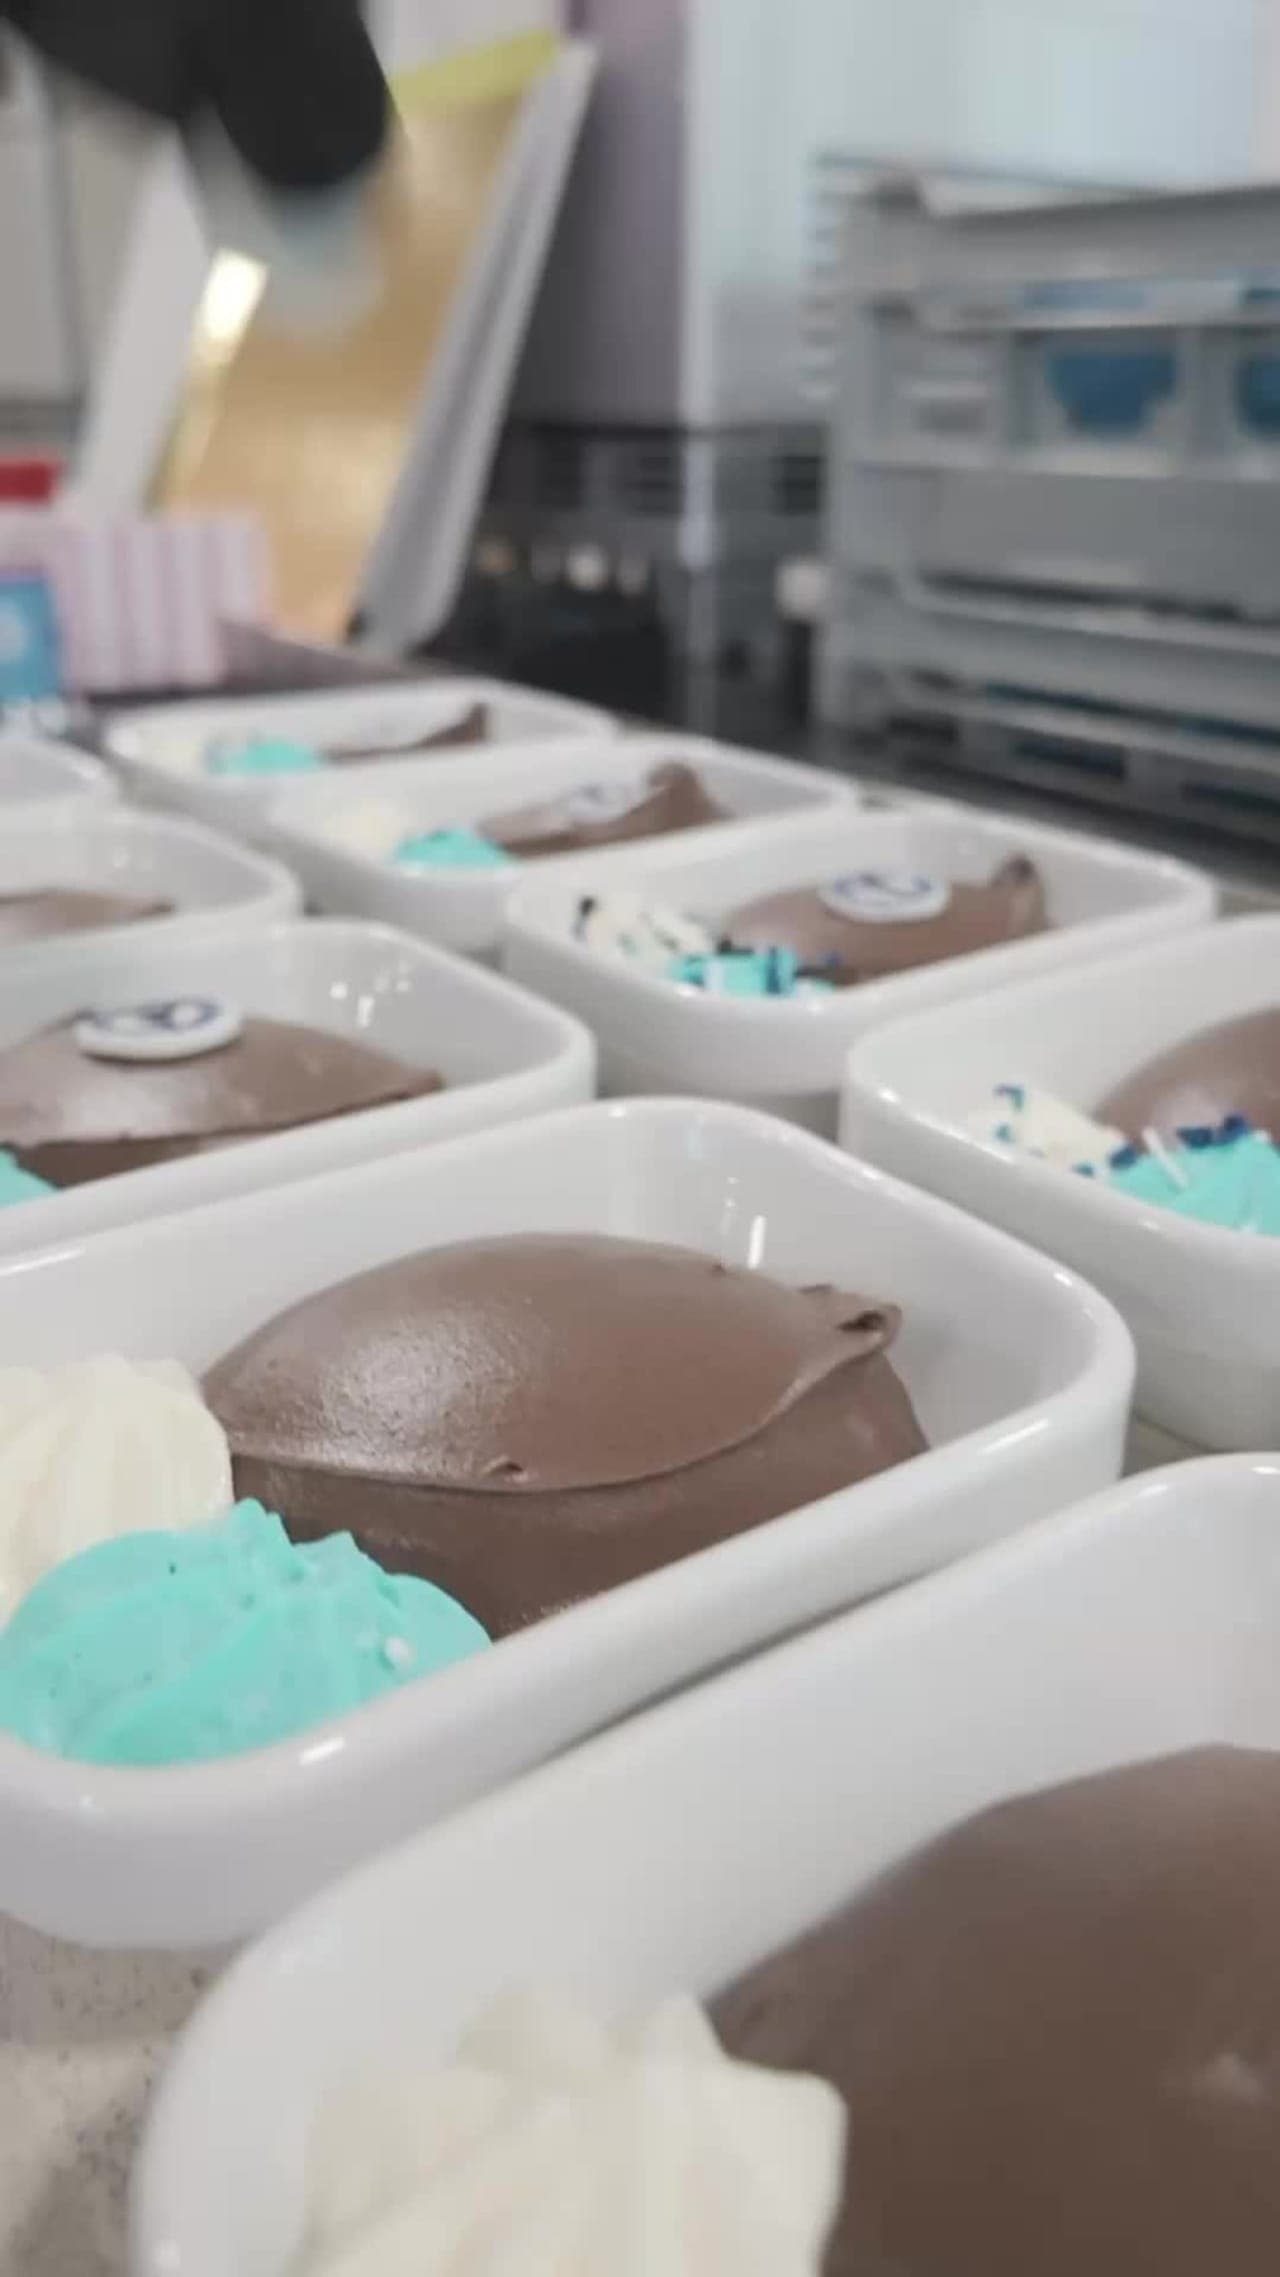
Top Content (By Eng. Rate)1644
Avg. Brand Video ViewsBrand Posts Across Channels
Cross-channels analysis of the post
Brand Posts Across Channels
| Channels | Posts | Avg. Posts/Day |
|---|---|---|
 YouTube YouTube | 41 | 0.23 |
 Twitter Twitter | 3 | 0.02 |
 Facebook Facebook | 32 | 0.18 |
 Instagram Instagram | 72 | 0.4 |
| Total | 148 | 0.82 |
Top Posts
Dr. Oetker YouTube

Mar 10, 2025
752 followers
Engagement Rate
12.101%
Dr. Oetker YouTube

May 5, 2025
771 followers
Engagement Rate
6.355%
 Dr. Oetker
 Instagram
May 21, 2025
6327 followers
Engagement Rate
4.599%
Brand Engagement Across Channels
Cross-channels analysis of the engagement
Brand Engagement Across Channels
| Channels | Engagement | Avg. Engagement |
|---|---|---|
| YouTube | 328 | 8 |
| Twitter | 42 | 14 |
| Facebook | 33 | 1.03 |
| Instagram | 3176 | 44.11 |
| Average | 894.75 | 16.79 |
Brand Video Views Across Channels
Cross-channels analysis of the engagement
Brand Video Views Across Channels
| Channels | Video Views | Avg. Video Views |
|---|---|---|
| YouTube | 51K | 1234 |
| Twitter | 0 | 0 |
| Facebook | 49K | 4427 |
| Instagram | 9143 | 914.3 |
| Average | 27K | 1644 |
Similar Brands
Explore top-performing brands from the FMCG — Food Industry


Ready to improve your social media strategy with real-time insights
Get strategic insights, analyze the social performance across all channels, compare metrics from different periods and download reports in seconds.