Babor Brand Overview
See social media performance data for Babor
Babor
0.13%
Brand Avg Engagement RateVideo
Top Content (By Eng. Rate)15K
Avg. Brand Video ViewsBrand Posts Across Channels
Cross-channels analysis of the post
Brand Posts Across Channels
| Channels | Posts | Avg. Posts/Day |
|---|---|---|
 TikTok TikTok | 125 | 0.69 |
 Instagram Instagram | 125 | 0.69 |
| Total | 250 | 1.39 |
Top Posts
Babor TikTok
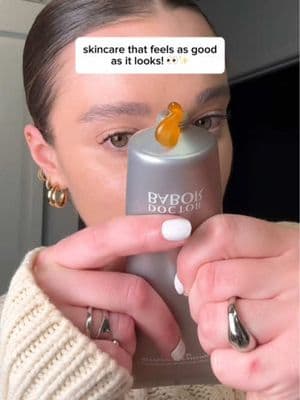
Mar 20, 2025
49K followers
Engagement Rate
5.872%
Babor TikTok
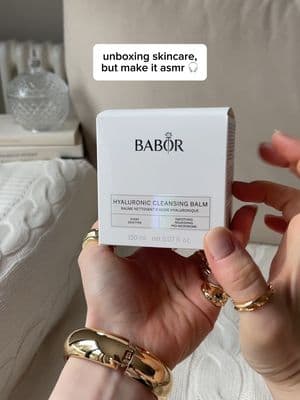
Mar 18, 2025
49K followers
Engagement Rate
5.756%
Babor TikTok

Jan 29, 2025
49K followers
Engagement Rate
4.413%
Brand Engagement Across Channels
Cross-channels analysis of the engagement
Brand Engagement Across Channels
| Channels | Engagement | Avg. Engagement |
|---|---|---|
| TikTok | 19K | 155.25 |
| Instagram | 47K | 379.57 |
| Average | 33K | 267.41 |
Brand Video Views Across Channels
Cross-channels analysis of the engagement
Brand Video Views Across Channels
| Channels | Video Views | Avg. Video Views |
|---|---|---|
| TikTok | 5.1M | 41K |
| Instagram | 474K | 5039 |
| Average | 2.8M | 23K |
Similar Brands
Explore top-performing brands from the Beauty & Cosmetics Industry


Ready to improve your social media strategy with real-time insights
Get strategic insights, analyze the social performance across all channels, compare metrics from different periods and download reports in seconds.