Hotel du Collectionneur Brand Overview
See social media performance data for Hotel du Collectionneur

Hotel du Collectionneur
0.03%
Brand Avg Engagement RatePhoto
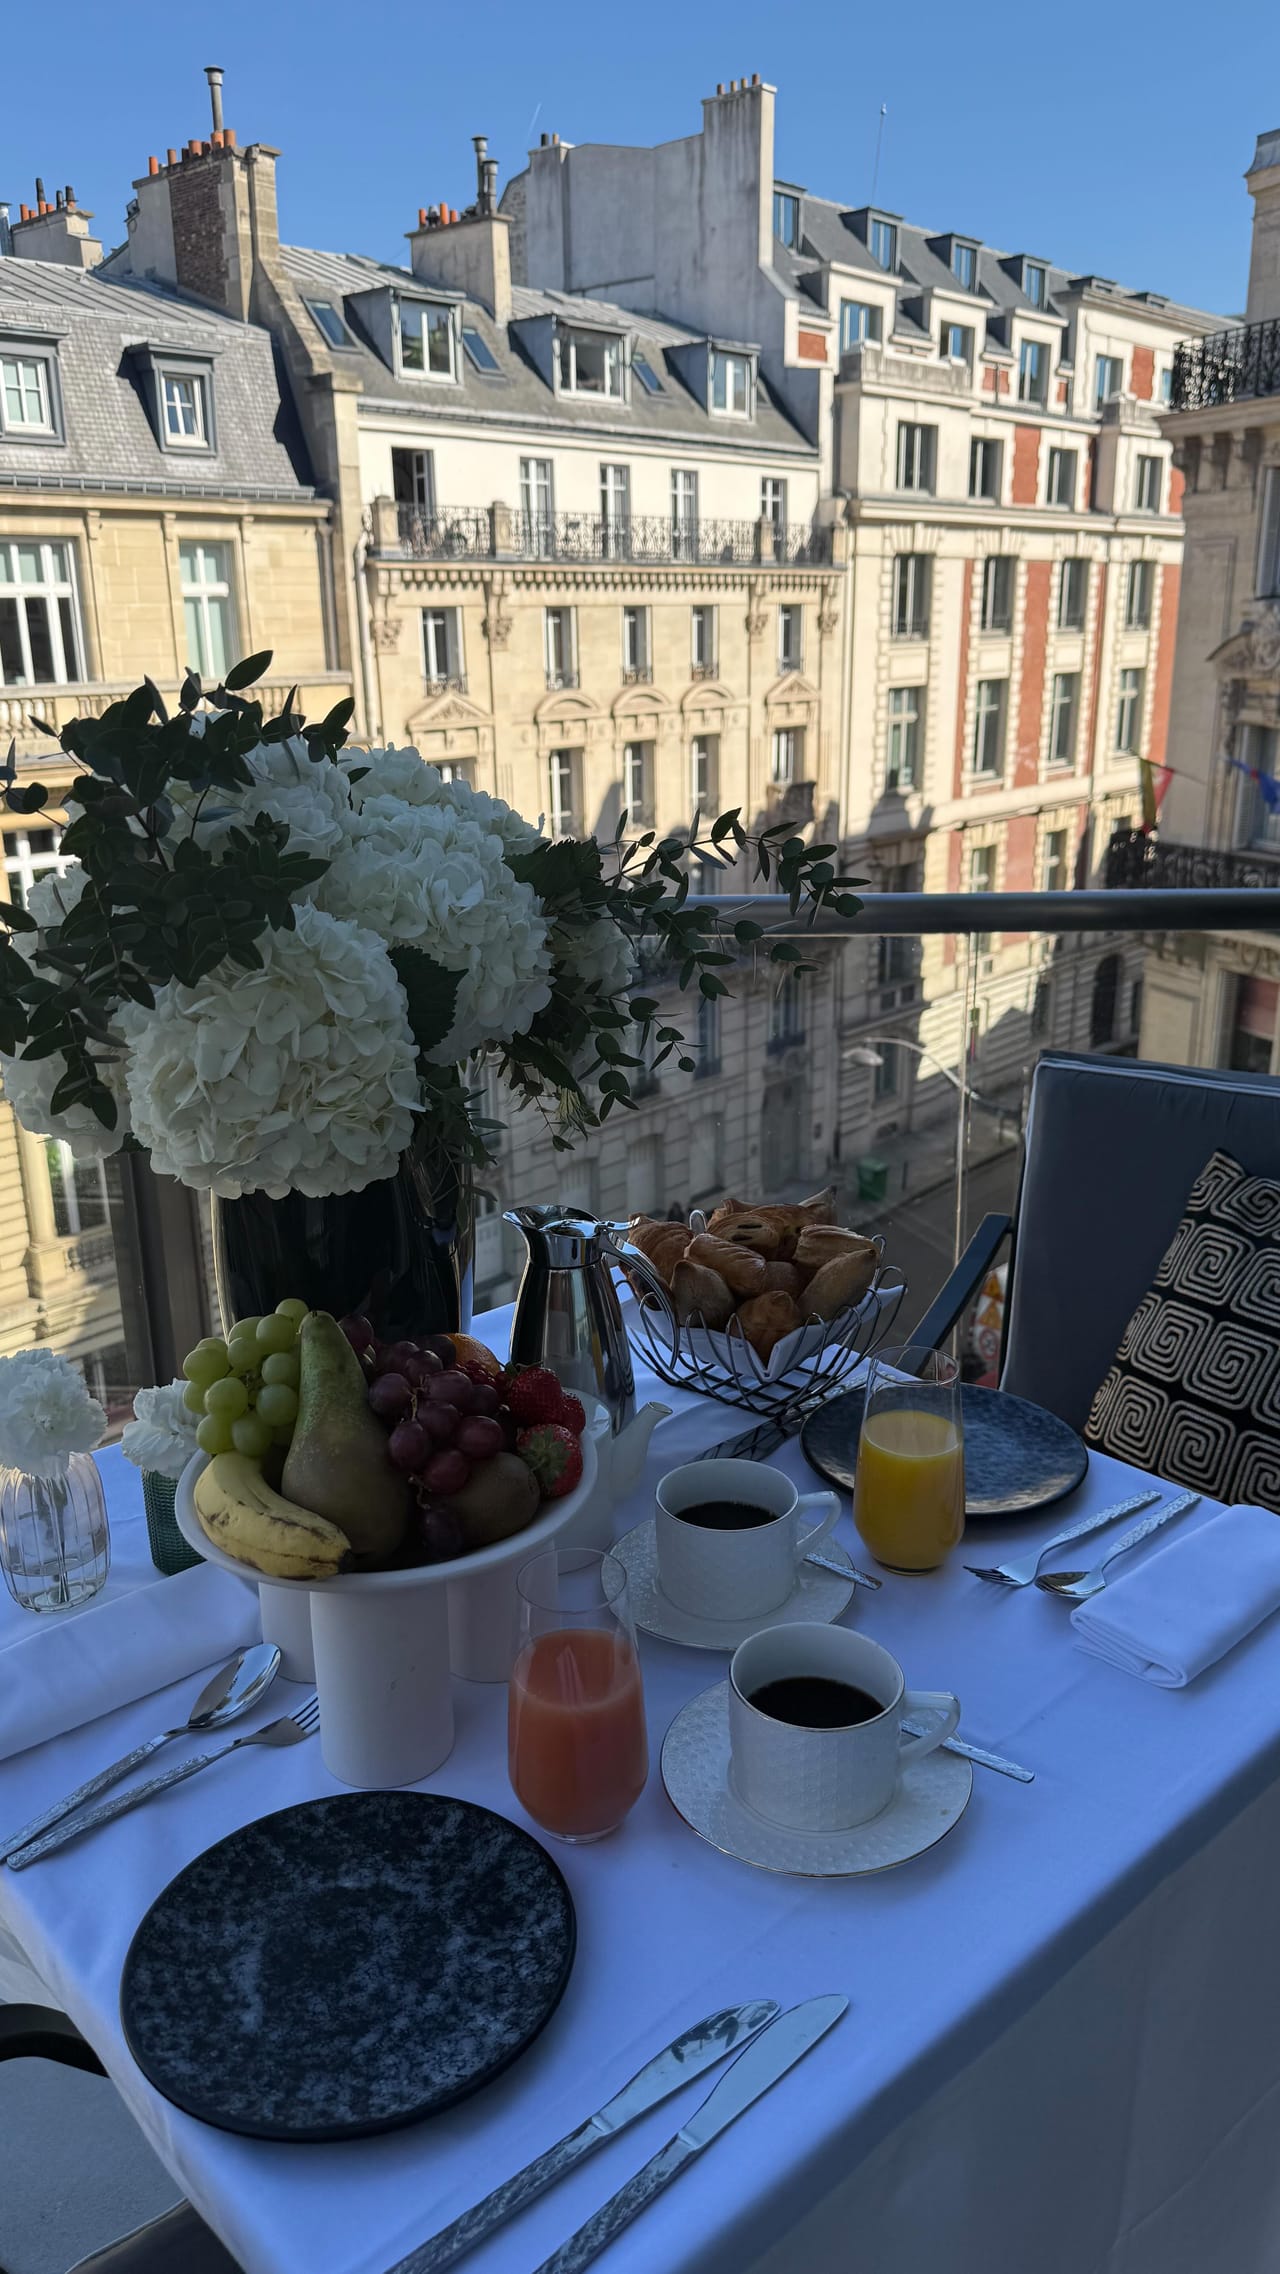
Top Content (By Eng. Rate)96.05
Avg. Brand Video ViewsBrand Posts Across Channels
Cross-channels analysis of the post
Brand Posts Across Channels
| Channels | Posts | Avg. Posts/Day |
|---|---|---|
 Facebook Facebook | 24 | 0.13 |
 Instagram Instagram | 76 | 0.42 |
| Total | 100 | 0.56 |
Top Posts
 Hotel du Collect...
 Instagram
Mar 27, 2025
39K followers
Engagement Rate
0.527%
Hotel du Collect... Instagram

May 1, 2025
40K followers
Engagement Rate
0.323%
Hotel du Collect... Facebook

Jan 14, 2025
23K followers
Engagement Rate
0.194%
Brand Engagement Across Channels
Cross-channels analysis of the engagement
Brand Engagement Across Channels
| Channels | Engagement | Avg. Engagement |
|---|---|---|
| Facebook | 279 | 11.63 |
| Instagram | 533 | 7.01 |
| Average | 406 | 9.32 |
Brand Video Views Across Channels
Cross-channels analysis of the engagement
Brand Video Views Across Channels
| Channels | Video Views | Avg. Video Views |
|---|---|---|
| Facebook | 75 | 6.25 |
| Instagram | 2416 | 185.85 |
| Average | 1246 | 96.05 |
Similar Brands
Explore top-performing brands from the Hospitality & Hotels Industry


Ready to improve your social media strategy with real-time insights
Get strategic insights, analyze the social performance across all channels, compare metrics from different periods and download reports in seconds.