La Roche-Posay Brand Overview
See social media performance data for La Roche-Posay

La Roche-Posay
0.04%
Brand Avg Engagement RatePhoto
Top Content (By Eng. Rate)55K
Avg. Brand Video ViewsBrand Posts Across Channels
Cross-channels analysis of the post
Brand Posts Across Channels
| Channels | Posts | Avg. Posts/Day |
|---|---|---|
 YouTube YouTube | 0 | 0 |
 TikTok TikTok | 390 | 2.17 |
 Facebook Facebook | 0 | 0 |
 Instagram Instagram | 83 | 0.46 |
| Total | 473 | 2.63 |
Top Posts
La Roche-Posay TikTok
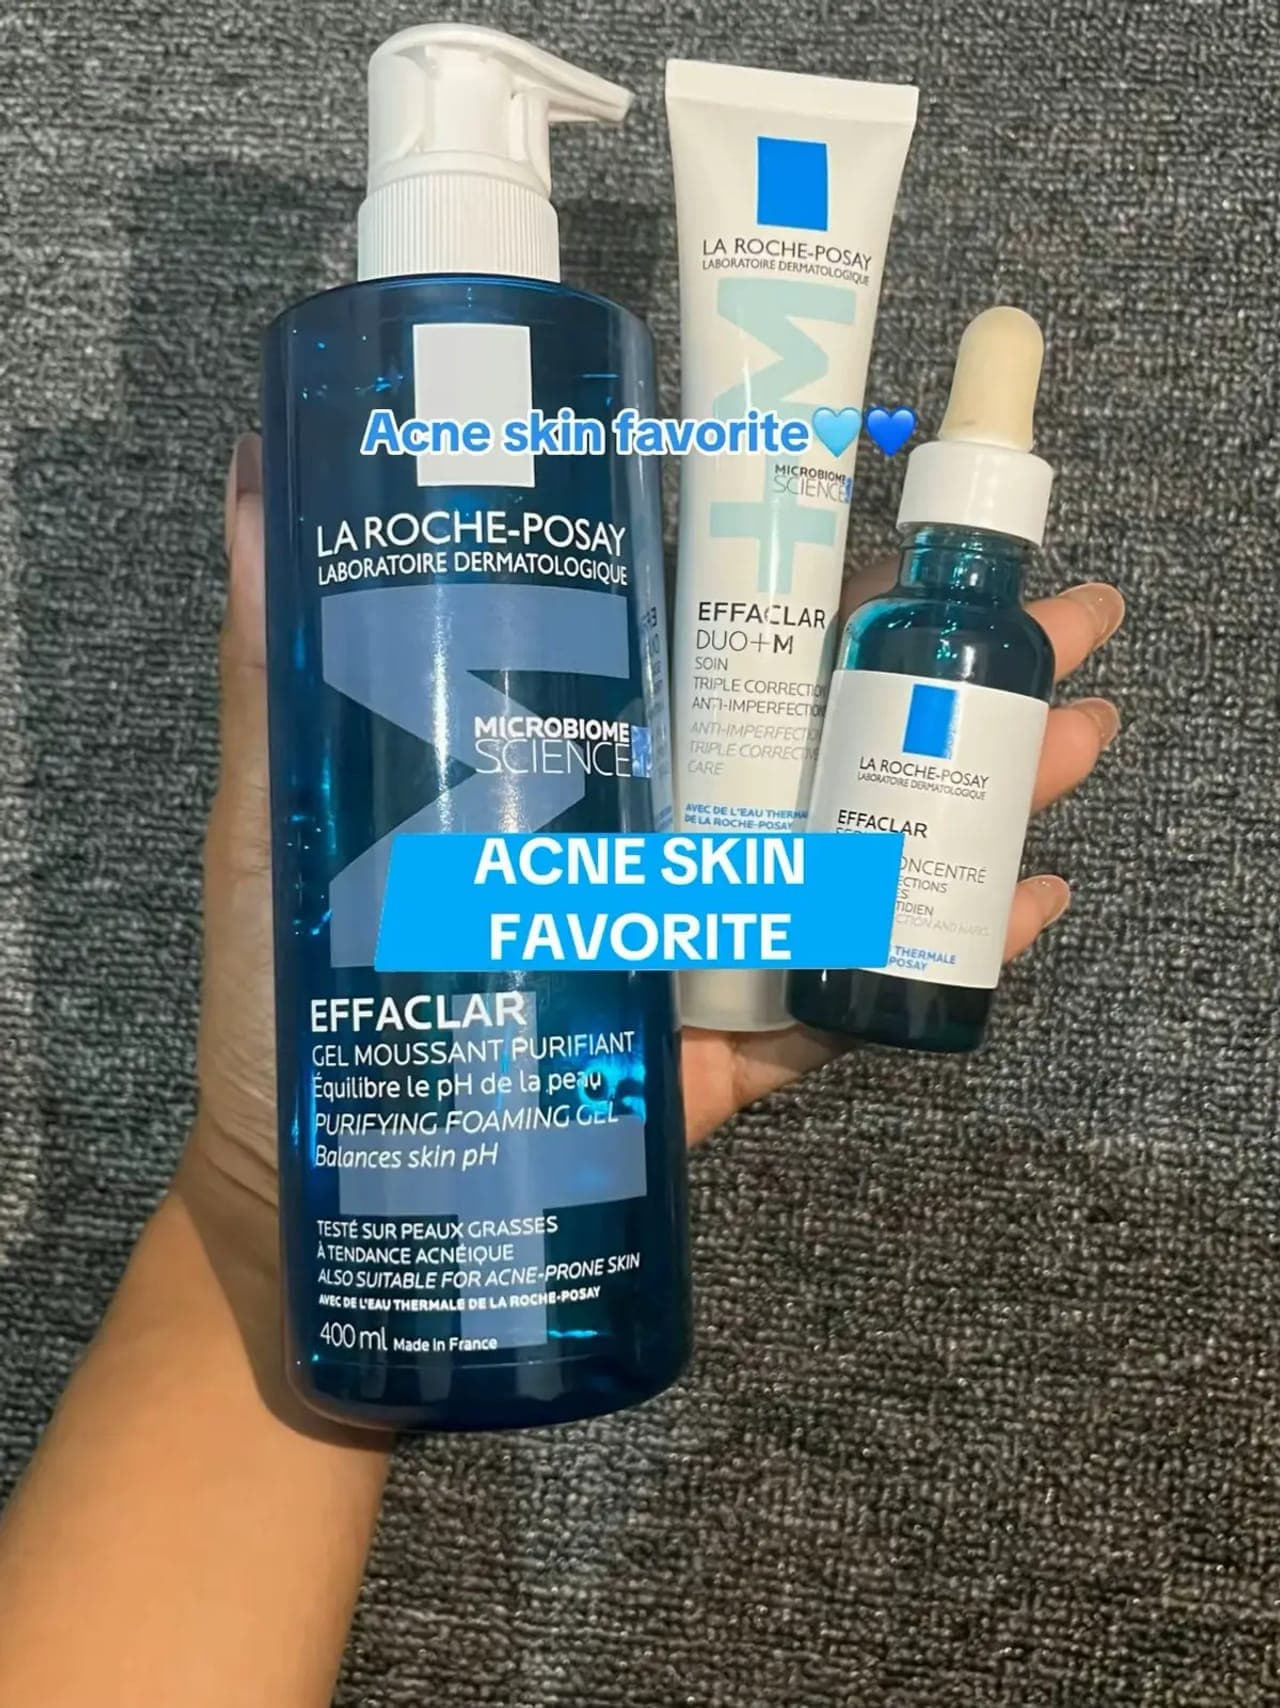
May 18, 2025
331K followers
Engagement Rate
3.402%
La Roche-Posay TikTok
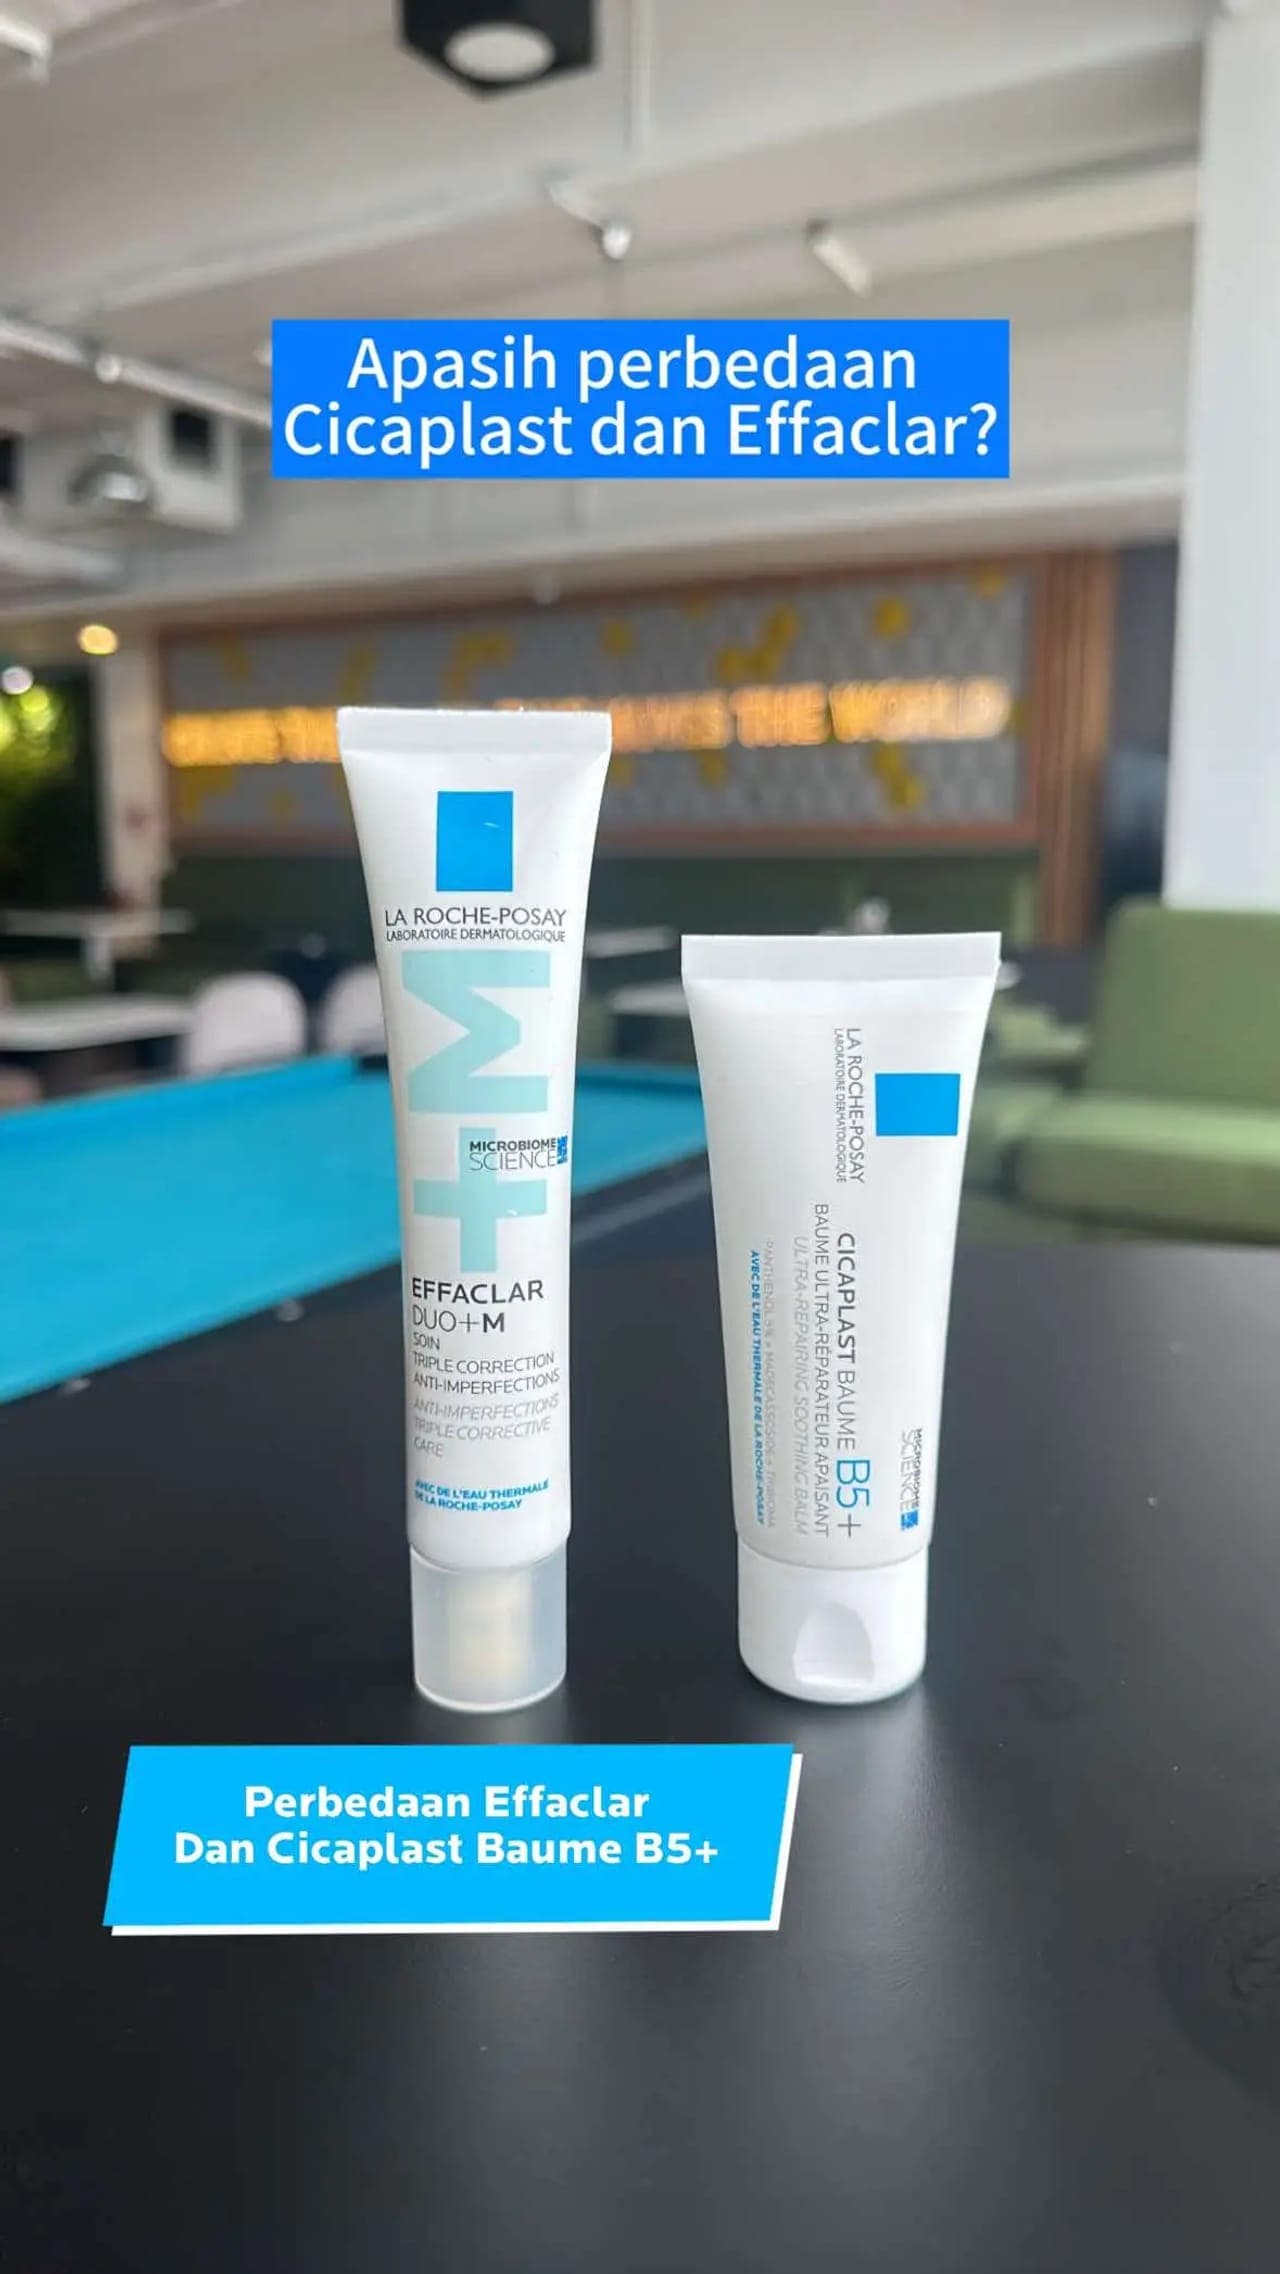
Jan 2, 2025
331K followers
Engagement Rate
2.238%
La Roche-Posay TikTok
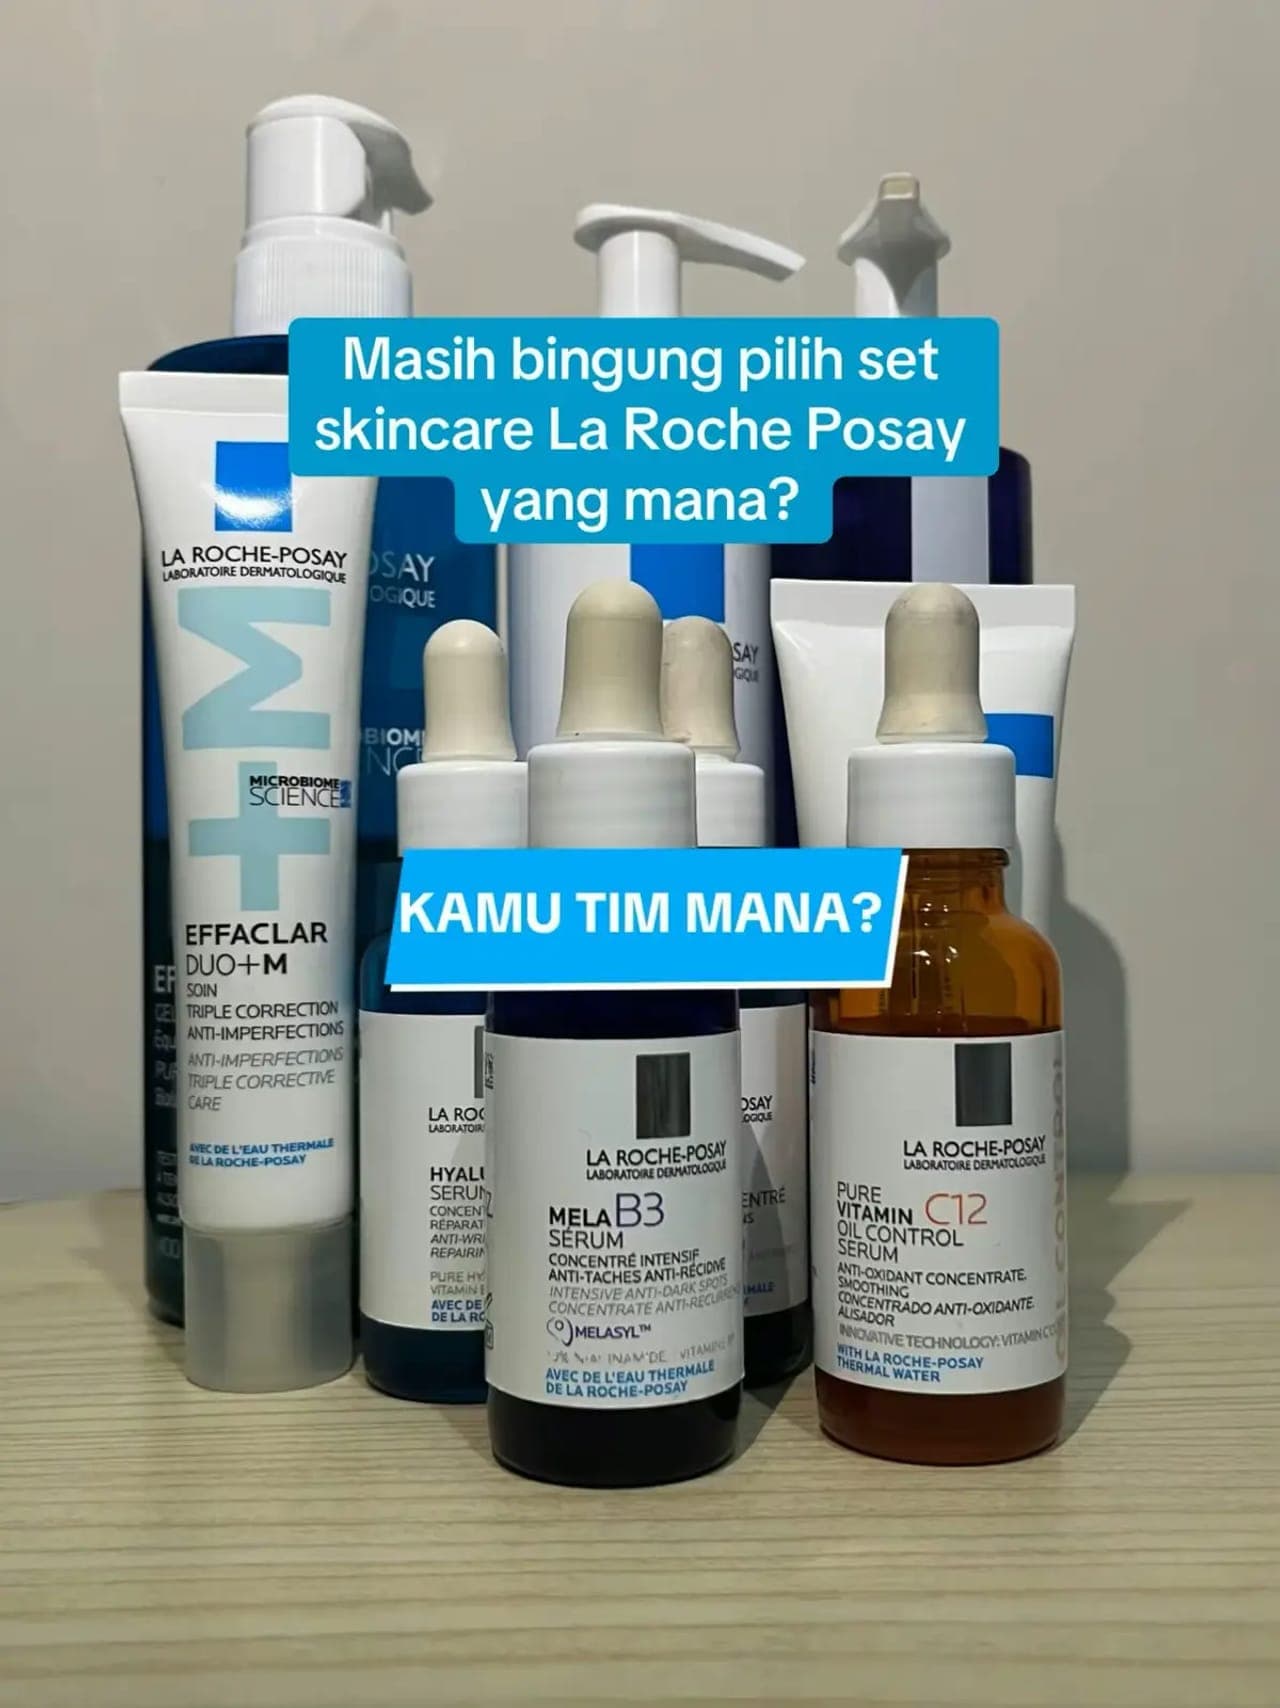
May 30, 2025
331K followers
Engagement Rate
1.433%
Brand Engagement Across Channels
Cross-channels analysis of the engagement
Brand Engagement Across Channels
| Channels | Engagement | Avg. Engagement |
|---|---|---|
| YouTube | 0 | 0 |
| TikTok | 99K | 254.38 |
| Facebook | 0 | 0 |
| Instagram | 261K | 3149 |
| Average | 90K | 850.77 |
Brand Video Views Across Channels
Cross-channels analysis of the engagement
Brand Video Views Across Channels
| Channels | Video Views | Avg. Video Views |
|---|---|---|
| YouTube | 0 | 0 |
| TikTok | 17M | 44K |
| Facebook | 0 | 0 |
| Instagram | 8.1M | 175K |
| Average | 6.3M | 55K |
Similar Brands
Explore top-performing brands from the Beauty & Cosmetics Industry


Ready to improve your social media strategy with real-time insights
Get strategic insights, analyze the social performance across all channels, compare metrics from different periods and download reports in seconds.