Renault Brand Overview
See social media performance data for Renault

Renault
0.13%
Brand Avg Engagement RatePhoto
Top Content (By Eng. Rate)6804
Avg. Brand Video ViewsBrand Posts Across Channels
Cross-channels analysis of the post
Brand Posts Across Channels
| Channels | Posts | Avg. Posts/Day |
|---|---|---|
 YouTube YouTube | 33 | 0.18 |
 Twitter Twitter | 4 | 0.02 |
 Facebook Facebook | 0 | 0 |
 Instagram Instagram | 56 | 0.31 |
| Total | 93 | 0.52 |
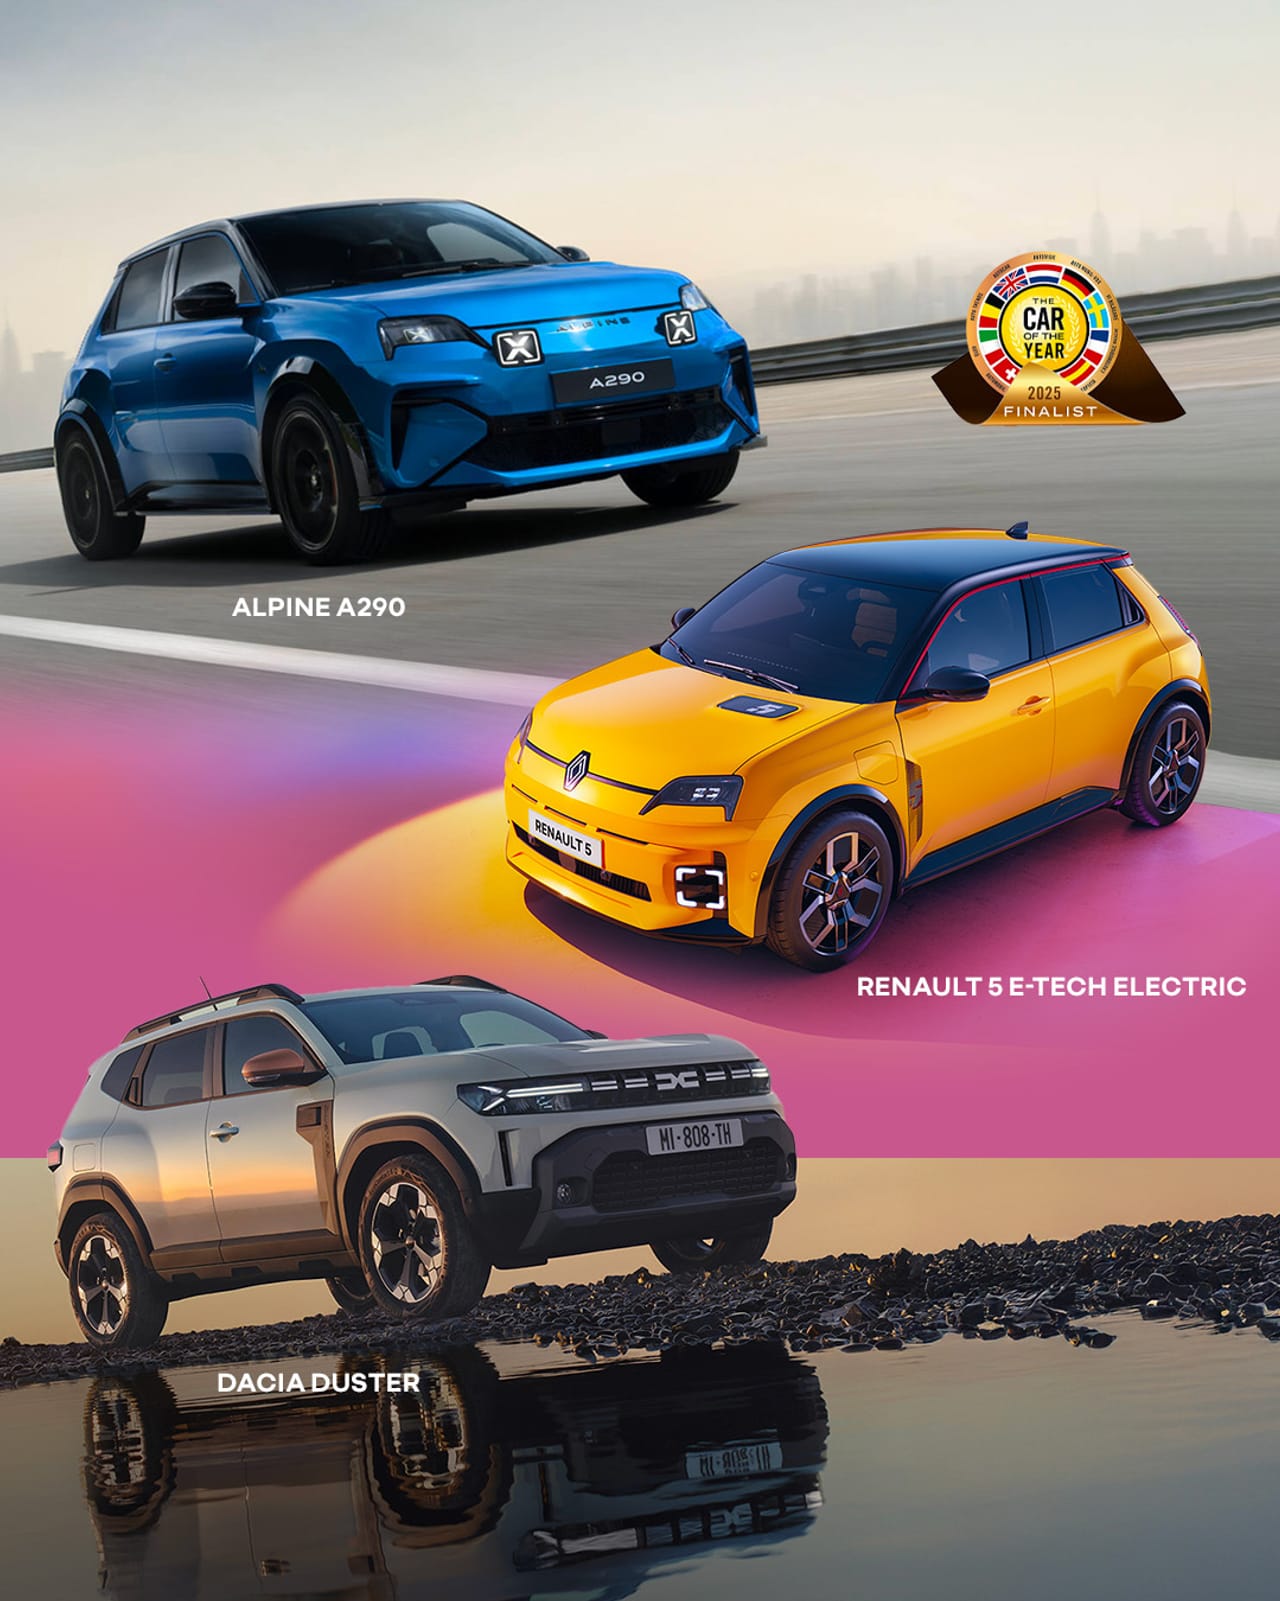
Top Posts
Renault Instagram

Mar 25, 2025
180K followers
Engagement Rate
2.034%
Renault Instagram
Jan 28, 2025
180K followers
Engagement Rate
1.314%
Renault Instagram
Jan 8, 2025
180K followers
Engagement Rate
1.071%
Brand Engagement Across Channels
Cross-channels analysis of the engagement
Brand Engagement Across Channels
| Channels | Engagement | Avg. Engagement |
|---|---|---|
| YouTube | 1948 | 59.03 |
| Twitter | 935 | 233.75 |
| Facebook | 0 | 0 |
| Instagram | 28K | 507.7 |
| Average | 7829 | 200.12 |
Brand Video Views Across Channels
Cross-channels analysis of the engagement
Brand Video Views Across Channels
| Channels | Video Views | Avg. Video Views |
|---|---|---|
| YouTube | 67K | 2022 |
| Twitter | 9624 | 9624 |
| Facebook | 0 | 0 |
| Instagram | 467K | 16K |
| Average | 136K | 6804 |
Similar Brands
Explore top-performing brands from the Automotive Industry


Ready to improve your social media strategy with real-time insights
Get strategic insights, analyze the social performance across all channels, compare metrics from different periods and download reports in seconds.