Land Rover Brand Overview
See social media performance data for Land Rover
Land Rover
3.53%
Brand Avg Engagement RateAlbum
Top Content (By Eng. Rate)14K
Avg. Brand Video ViewsBrand Posts Across Channels
Cross-channels analysis of the post
Brand Posts Across Channels
| Channels | Posts | Avg. Posts/Day |
|---|---|---|
 YouTube YouTube | 37 | 0.21 |
 Twitter Twitter | 25 | 0.14 |
 Facebook Facebook | 1 | 0.01 |
 Instagram Instagram | 4 | 0.02 |
| Total | 67 | 0.37 |
Top Posts
Land Rover Facebook
May 20, 2025
1083 followers
Engagement Rate
8.403%
 Land Rover
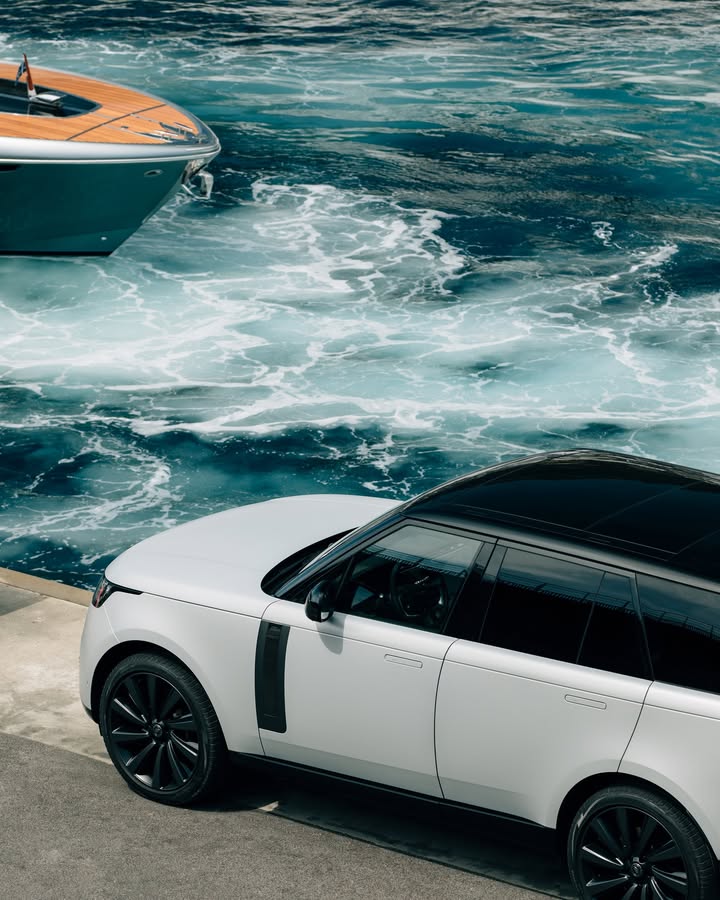
 Instagram
May 20, 2025
14K followers
Engagement Rate
8.238%
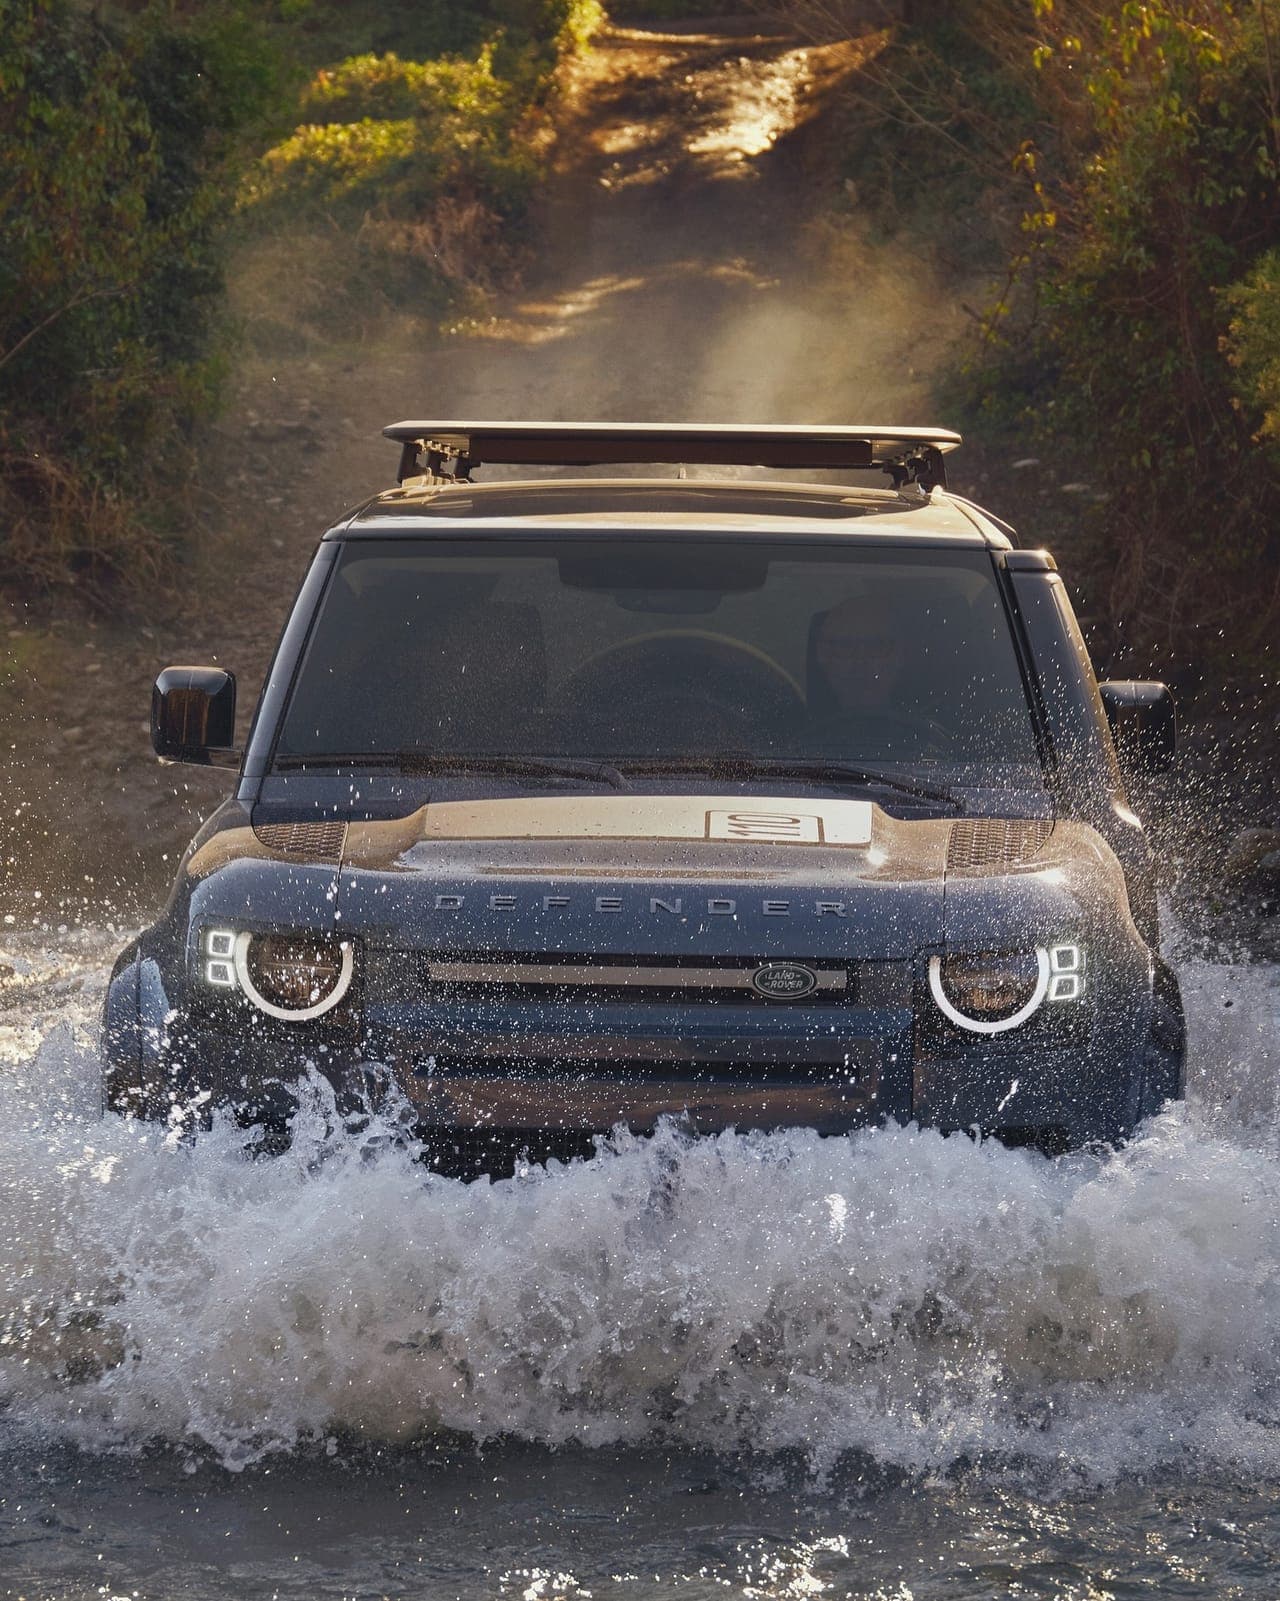
Land Rover Instagram

May 20, 2025
14K followers
Engagement Rate
7.967%
Brand Engagement Across Channels
Cross-channels analysis of the engagement
Brand Engagement Across Channels
| Channels | Engagement | Avg. Engagement |
|---|---|---|
| YouTube | 27K | 735.62 |
| Twitter | 567 | 22.68 |
| Facebook | 91 | 91 |
| Instagram | 4107 | 1027 |
| Average | 7996 | 469.01 |
Brand Video Views Across Channels
Cross-channels analysis of the engagement
Brand Video Views Across Channels
| Channels | Video Views | Avg. Video Views |
|---|---|---|
| YouTube | 1.7M | 46K |
| Twitter | 9475 | 9475 |
| Facebook | 0 | 0 |
| Instagram | 0 | 0 |
| Average | 431K | 14K |
Similar Brands
Explore top-performing brands from the Automotive Industry


Ready to improve your social media strategy with real-time insights
Get strategic insights, analyze the social performance across all channels, compare metrics from different periods and download reports in seconds.