Keurig Dr Pepper ブランド概要
ソーシャルメディアのパフォーマンスデータを表示 Keurig Dr Pepper
Keurig Dr Pepper
0.96
ブランド平均Eng率Carousel Album
トップコンテンツ(Eng.率順)508K
ブランド動画の平均再生回数ブランド投稿の全チャネル展開
投稿のクロスチャネル分析
ブランド投稿の全チャネル展開
| チャンネル | 投稿 | 平均投稿数/日 |
|---|---|---|
 YouTube YouTube | 22 | 0.12 |
 Twitter Twitter | 46 | 0.26 |
 TikTok TikTok | 38 | 0.21 |
 Facebook Facebook | 40 | 0.22 |
 Instagram Instagram | 47 | 0.26 |
| Total | 193 | 1.07 |
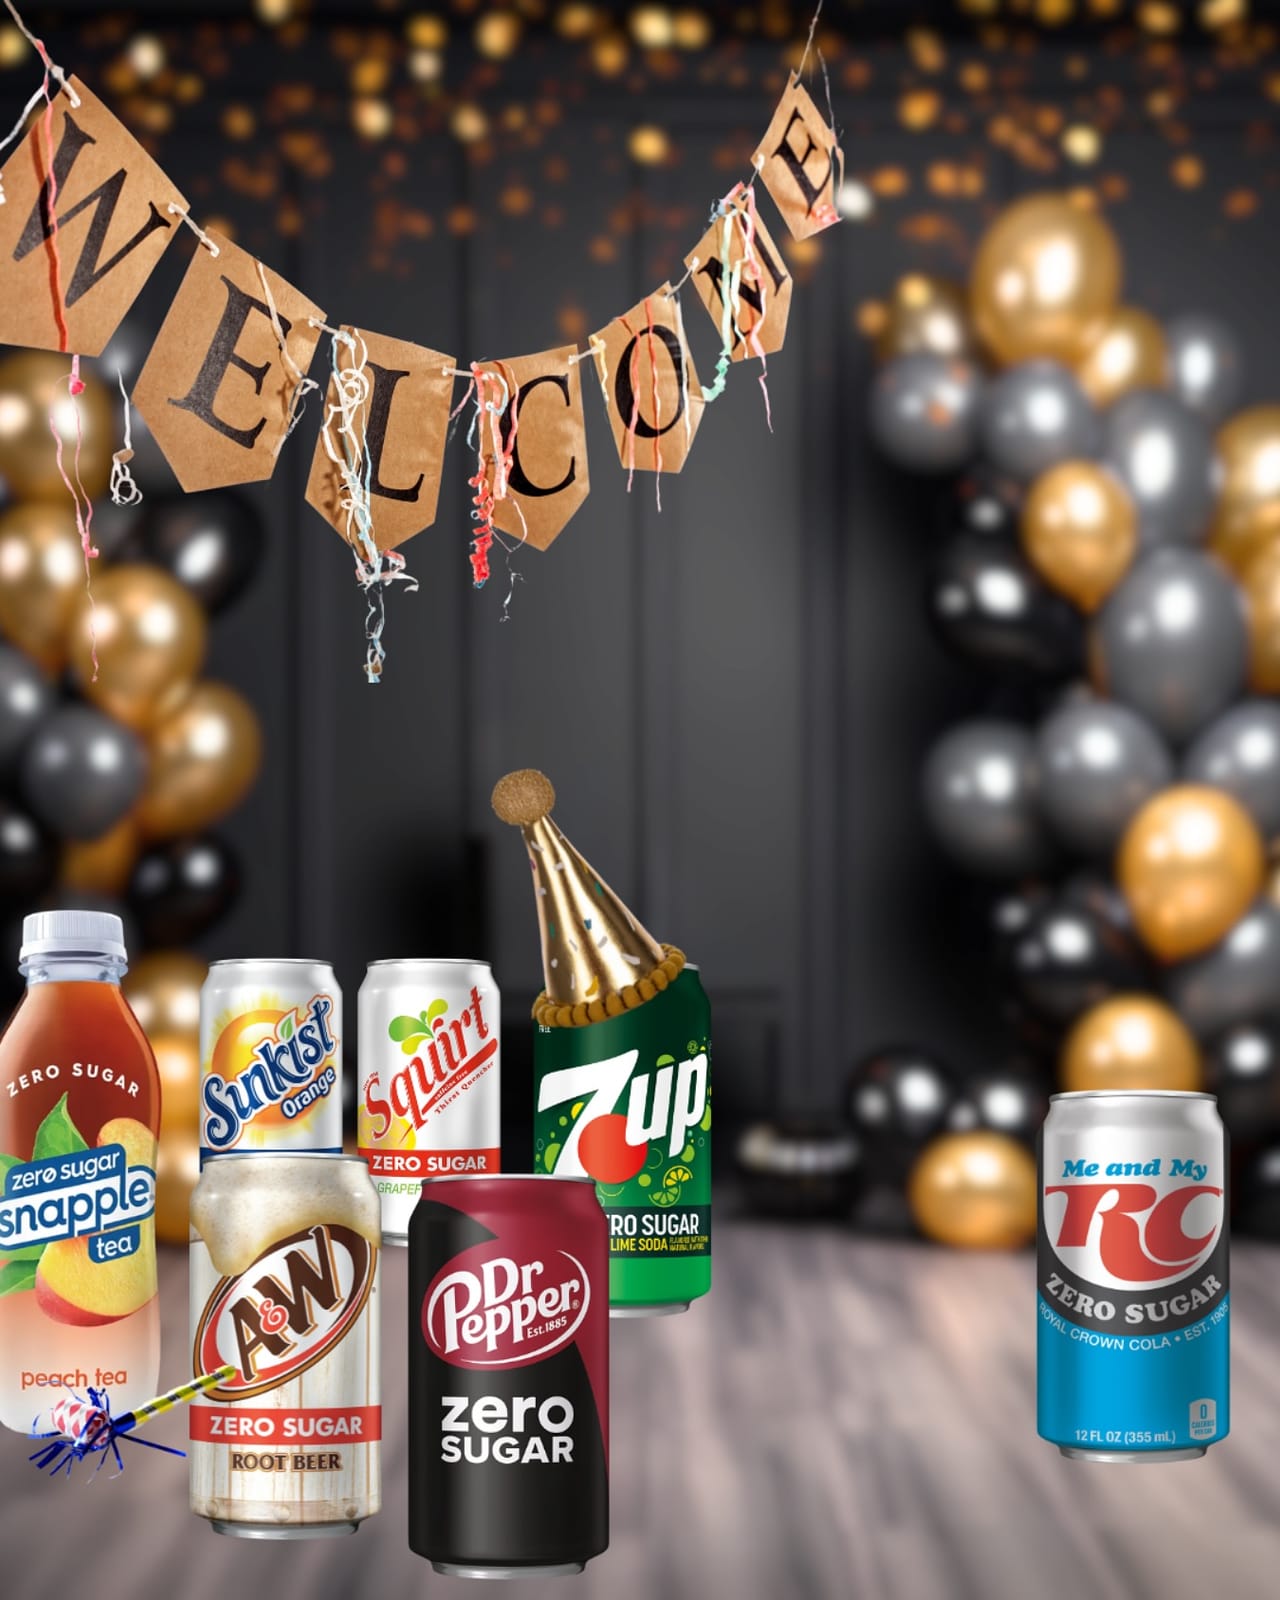
トップ投稿
 Keurig Dr Pepper
 Twitter

Jun 3, 2025
436K followers
Engagement Rate
8.448%
Keurig Dr Pepper Instagram

Feb 5, 2025
1528 followers
Engagement Rate
6.414%
Keurig Dr Pepper Instagram
Mar 6, 2025
1528 followers
Engagement Rate
5.955%
チャネル全体のブランドEng
エンゲージメントのクロスチャネル分析。
チャネル全体のブランドEng
| チャンネル | エンゲージメント | 平均エンゲージメント |
|---|---|---|
| YouTube | 7477 | 339.86 |
| Twitter | 127K | 2755 |
| TikTok | 894K | 24K |
| Facebook | 292K | 7291 |
| Instagram | 1736 | 36.94 |
| Average | 264K | 6792 |
ブランド動画の総チャンネル視聴数
エンゲージメントのクロスチャネル分析。
ブランド動画の総チャンネル視聴数
| チャンネル | 動画再生数 | 平均動画再生数 |
|---|---|---|
| YouTube | 11M | 480K |
| Twitter | 0 | 0 |
| TikTok | 78M | 2.1M |
| Facebook | 0 | 0 |
| Instagram | 4730 | 278.24 |
| Average | 18M | 508K |
類似ブランド
トップブランドを探す FMCG — Beverages 業界


リアルタイムのインサイトでソーシャルメディア戦略を改善する準備はできていますか。
戦略的なインサイトを取得し、全チャネルのソーシャルパフォーマンスを分析し、異なる期間の指標を比較して、数秒でレポートをダウンロードできます。