2026年ソーシャルメディアベンチマーク
2026年のソーシャルメディアベンチマークは、貴社の戦略強化に役立ちます。業界標準と比較して、ブランドの位置を確認しましょう。

あなたのブランドがオンラインで最も「見られている」と感じるのはどのプラットフォームでしょうか?TikTok、Instagram、Facebook、それともXですか?最新の投稿で何を起こしたいかによって、すべてかもしれません。
正直に言いましょう。オーディエンスの動きはこれまで以上に速くなっています。ときにはスクロールや無音の視聴、たまに「いいね」がつくだけの日もあります。一方で、コミュニティが盛り上がり、コメントやシェアが増え、会話が広がっていく日もあります。
プラットフォームの習慣やアルゴリズムが常に変化しているため、本当のエンゲージメントがどのようなものか把握するのは難しくなっています。
そのため、TikTok、Instagram、Facebook、Xで合計70,000,000件のソーシャルメディア投稿を分析しました。ソーシャルメディアの未来やオーディエンスとのインタラクション、ブランドが2026年のためにどのように戦略を準備すべきかを理解するためです。
このSocialinsider 2026年ソーシャルメディアベンチマークレポートは、Facebook、Instagram、TikTok、X(旧Twitter)におけるエンゲージメント率、インプレッション、いいね、コメント、シェア、投稿頻度のベンチマークを分析します。
これらのトレンドを把握することで、ブランドは新たな機会を特定できます。コンテンツ戦略を最適化し、ソーシャルメディアの投資効果(ROI)を高められます。
エグゼクティブサマリー
- In 2026, TikTok’s engagement rate by followers stands at an average of 2.60%, registering a 10% YoY decrease.
- Facebookの平均エンゲージメント率は0.15%です。2025年初頭に減少し、その後も徐々に低下しています。
- TikTokでは投稿あたりの平均コメント数が24%、Instagramでは16%減少しました。よりパッシブなエンゲージメントへのシフトが示唆されます。
- TikTokでは投稿あたりのシェア数が前年比45%増と大幅に成長しました。エンゲージメント全体の上昇トレンドを反映しています。Instagramも12%の増加を記録しました。
- TikTokとInstagramの両方で動画の視聴回数が増加しました。TikTokは3%の成長率、Instagramはより顕著な29%の前年比成長率でした。
- ブランドはInstagramとTikTokで週平均5件の投稿を行っています。
ソーシャルメディア四半期ベンチマーク
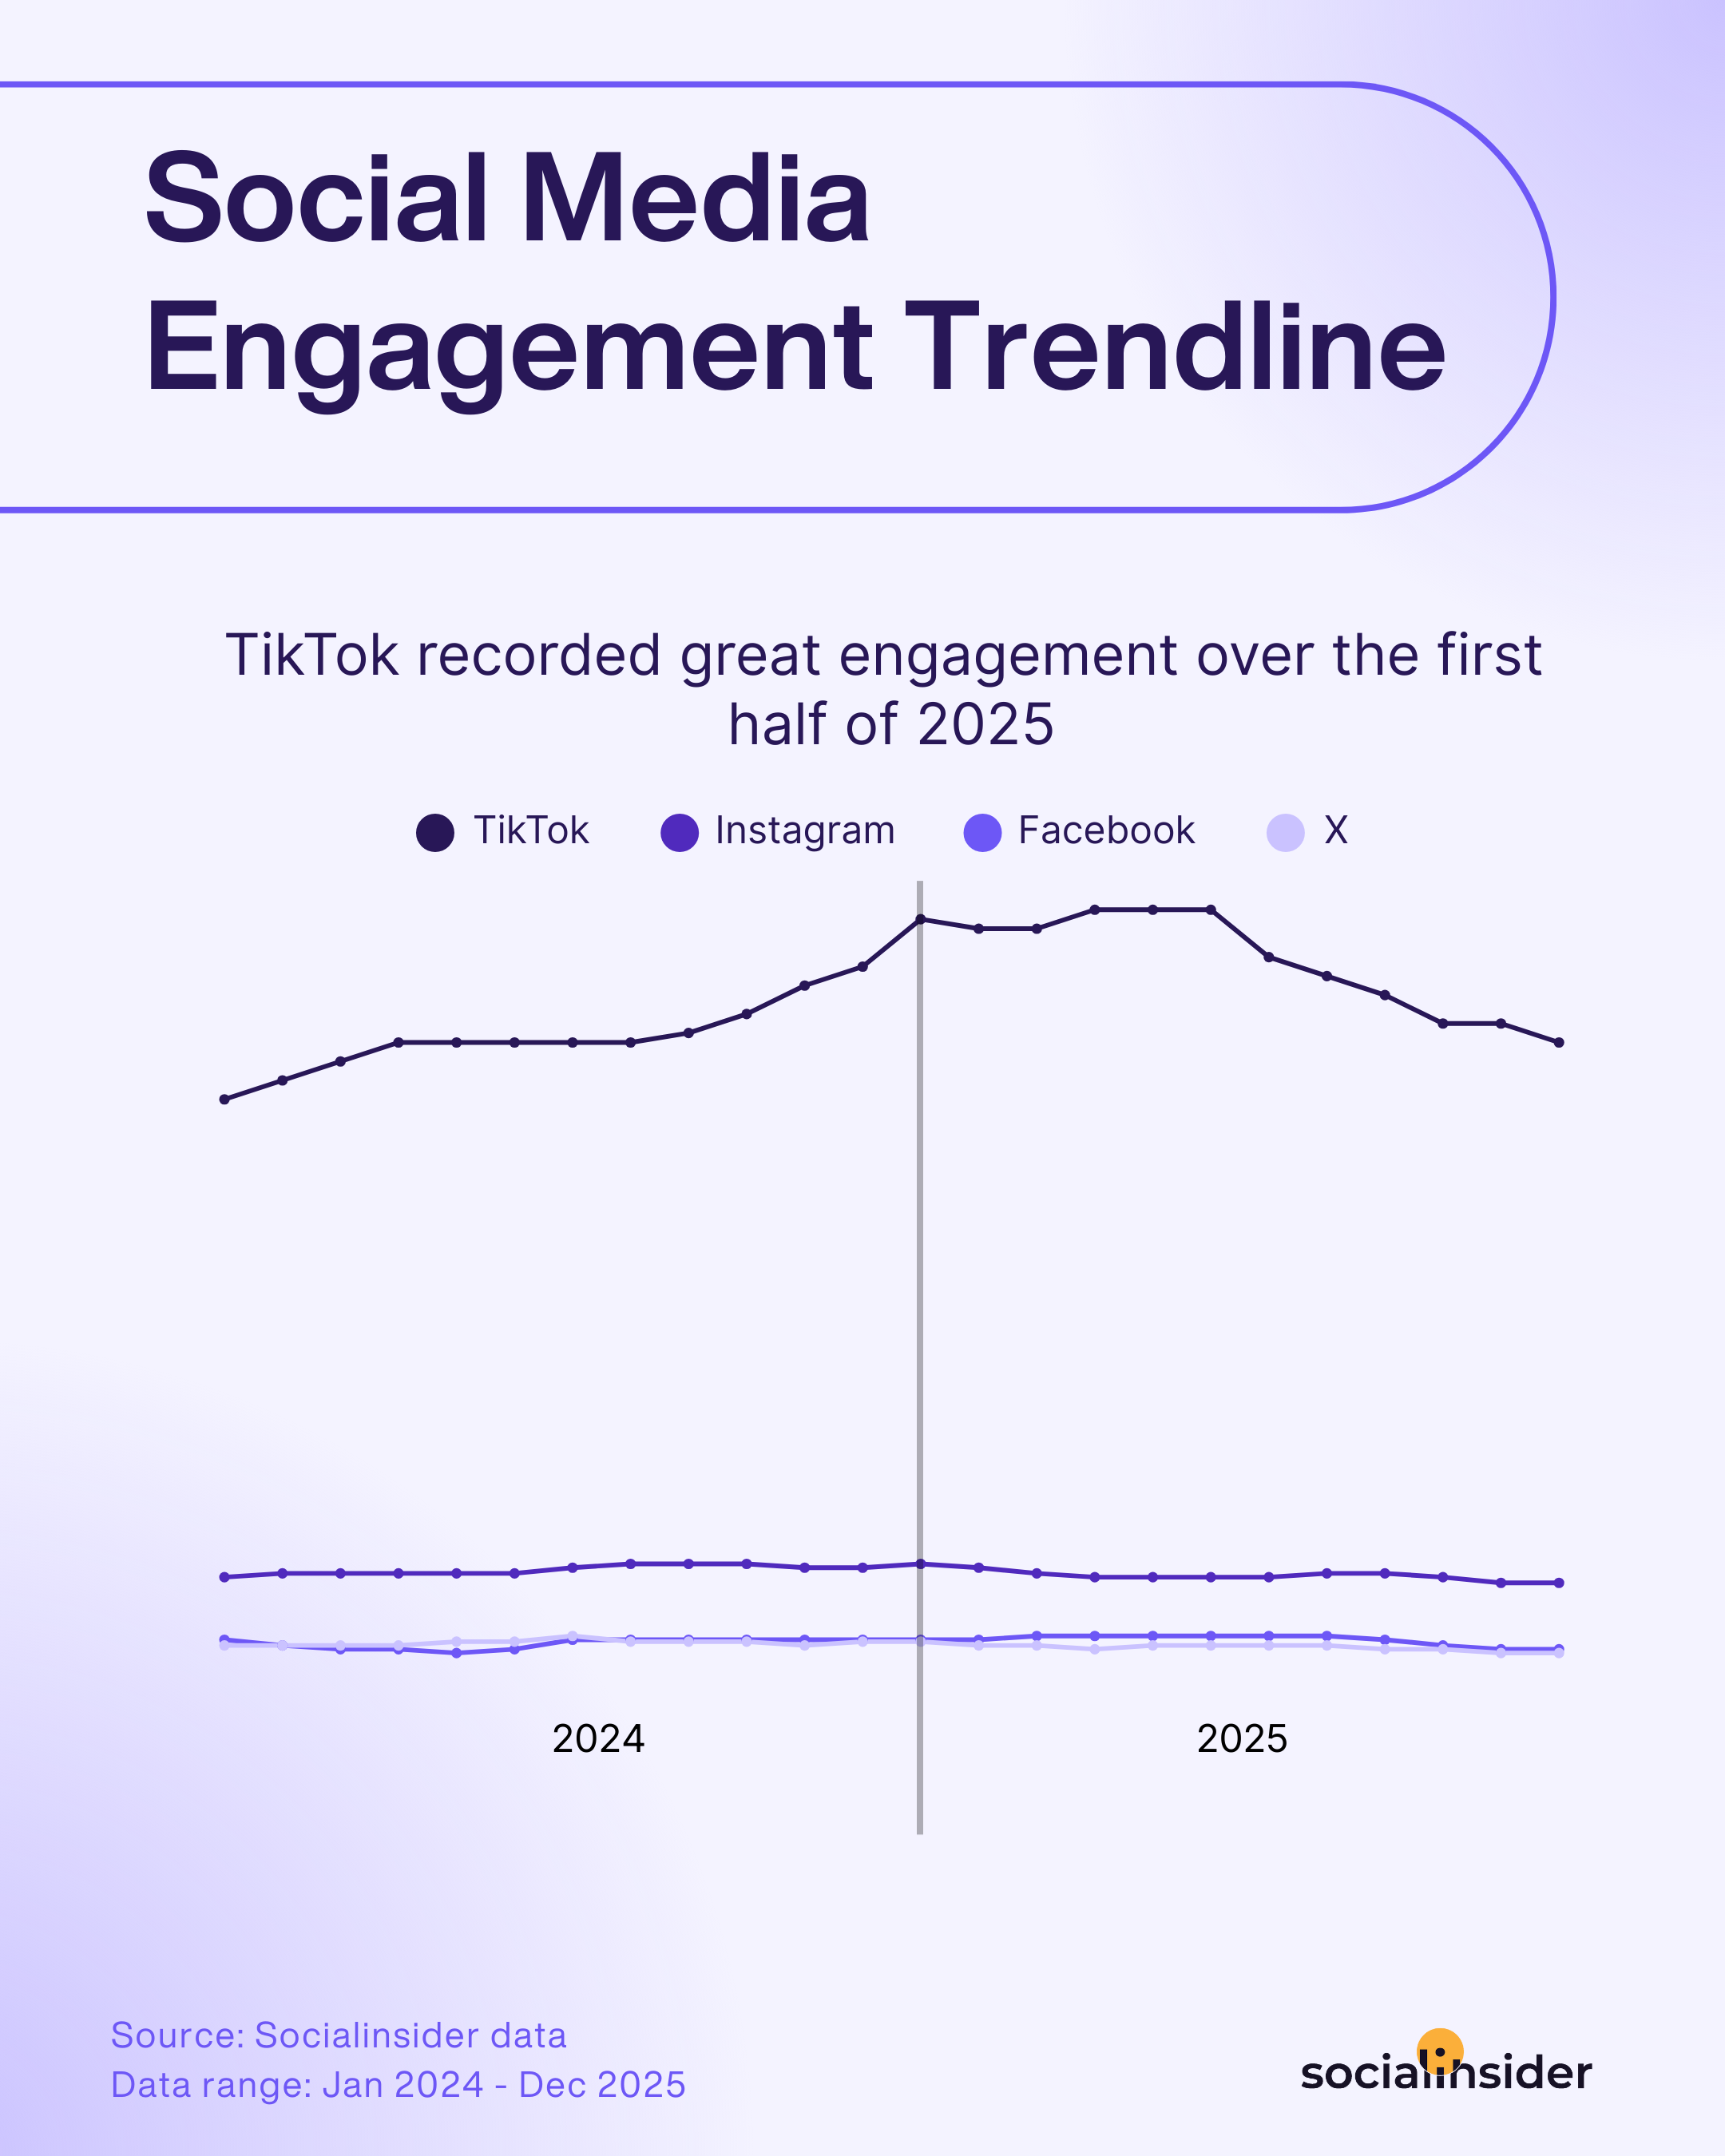
Over the past few years, I've consistently seen engagement rates decline across most social media platforms. As feeds become more crowded and brands publish more content than ever before, capturing audience attention, and more importantly, interaction, has become increasingly difficult.
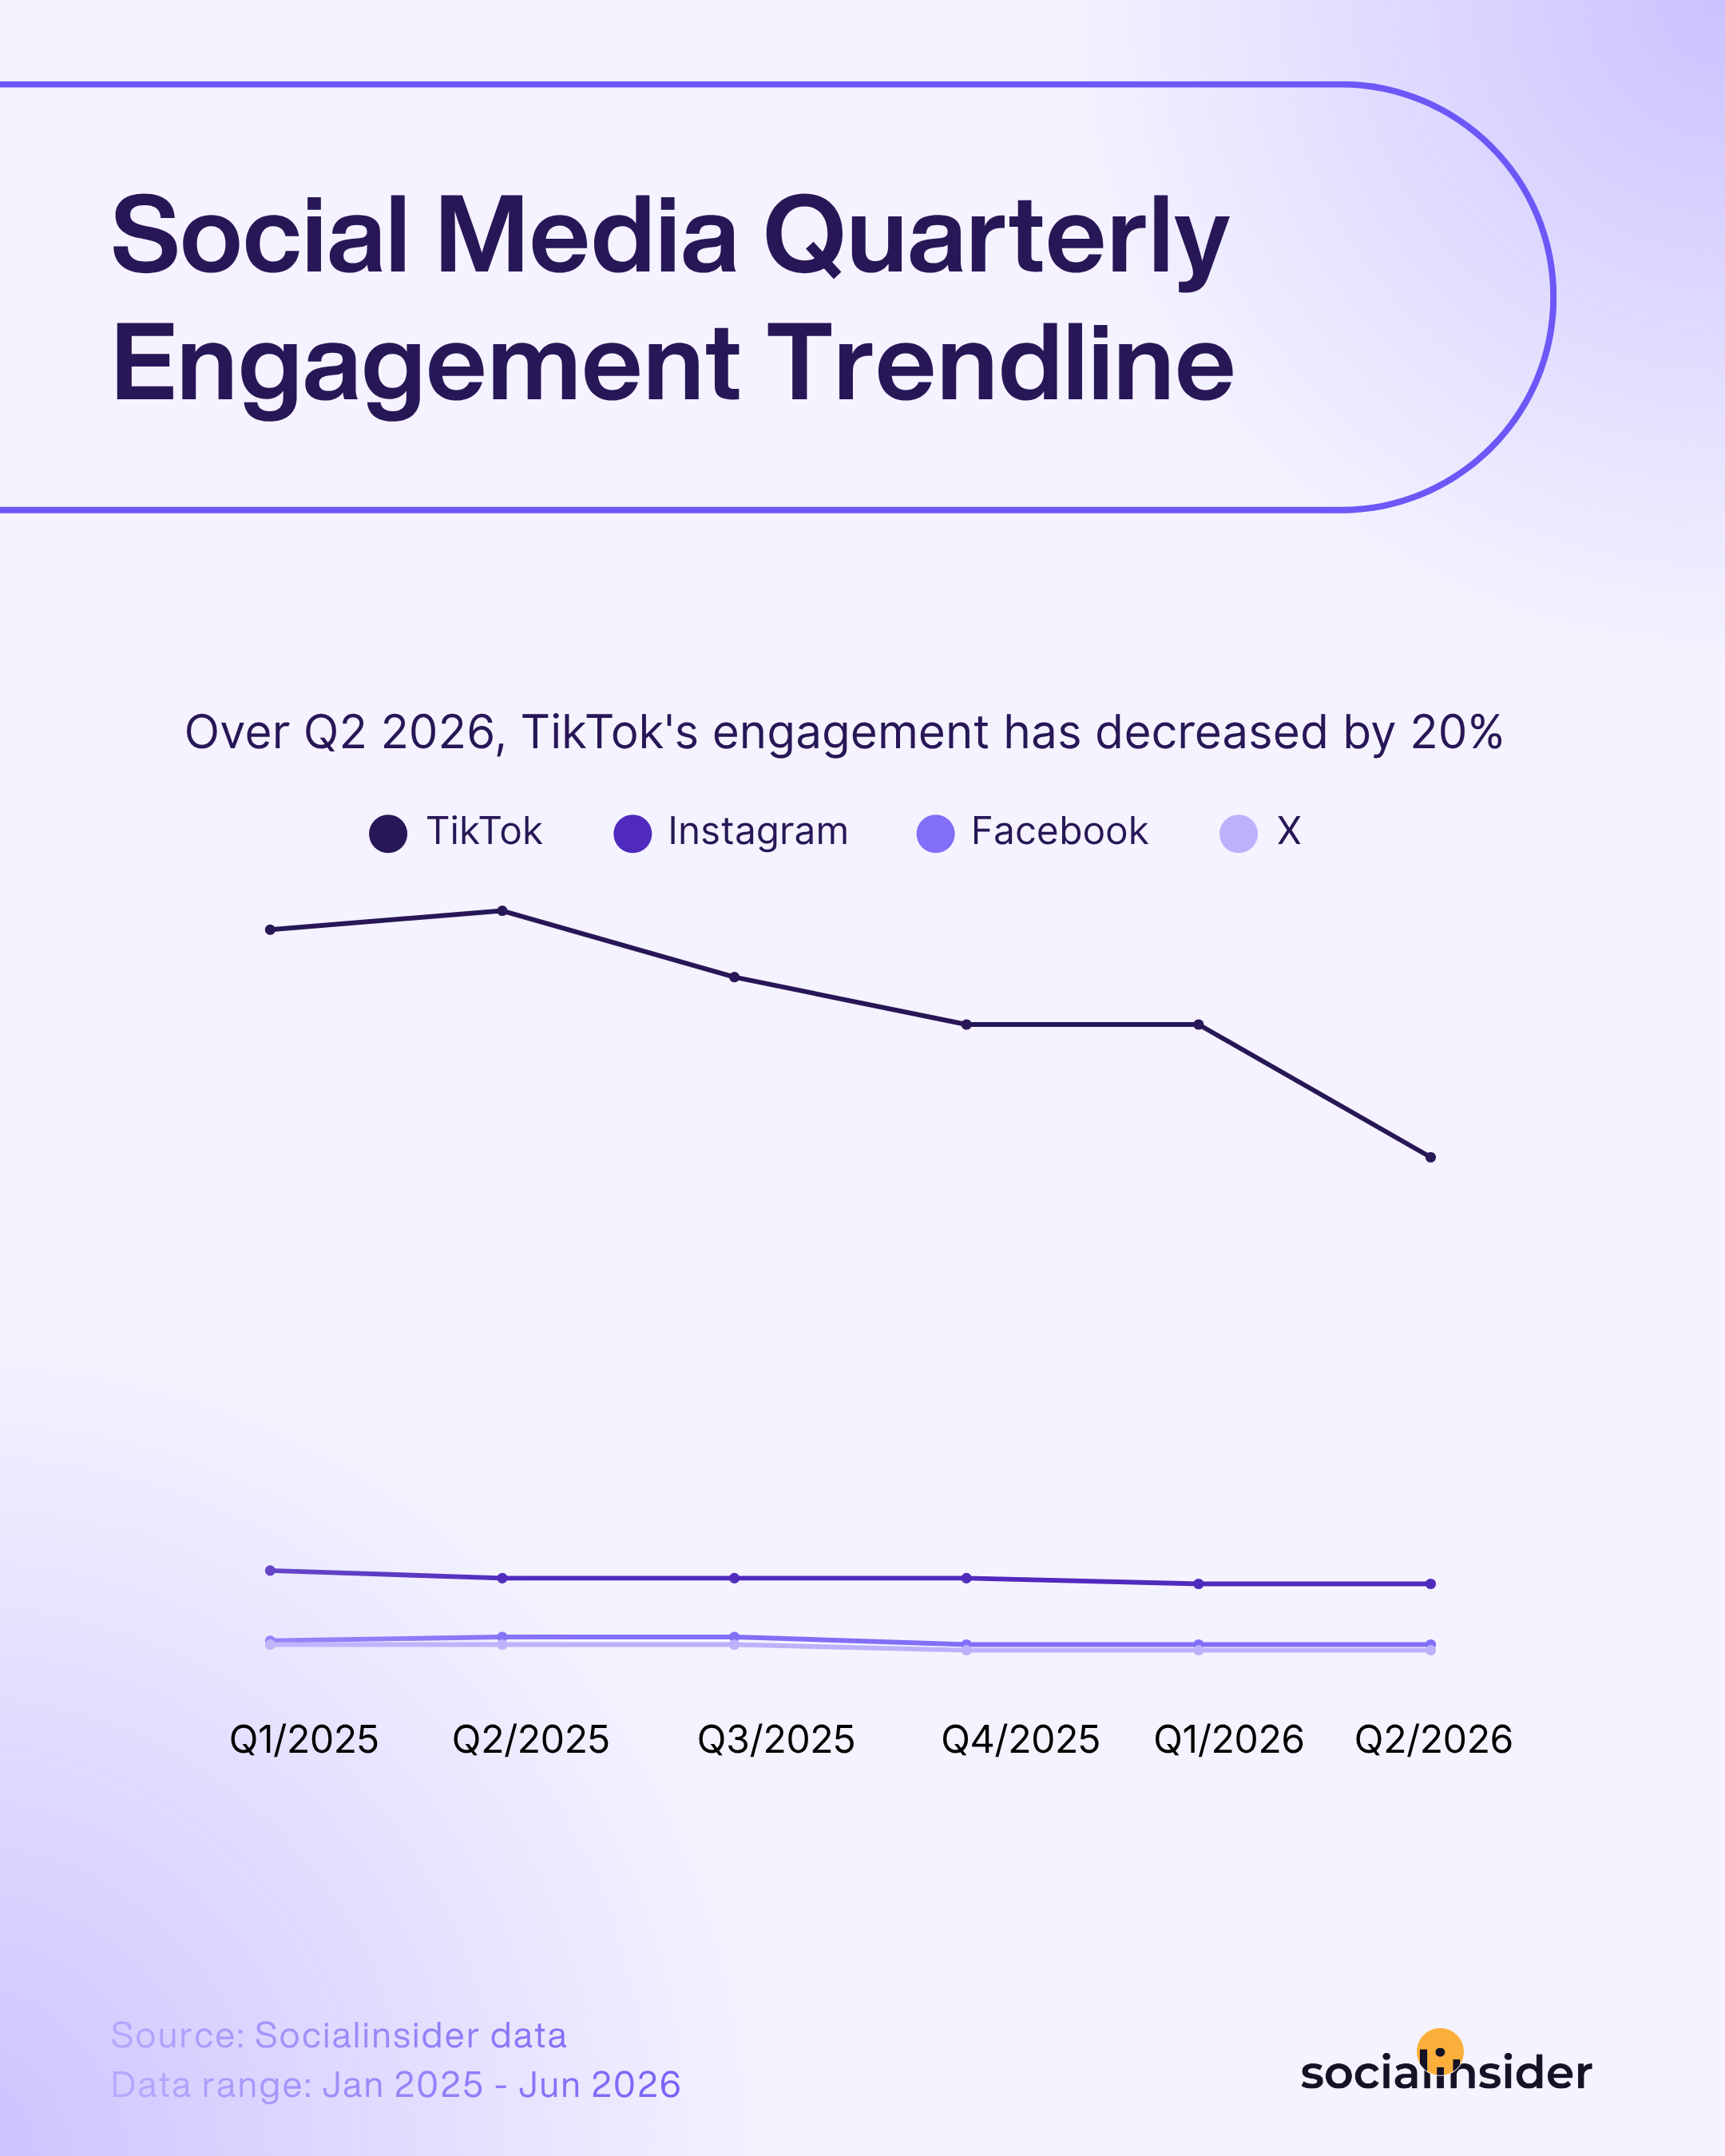
According to Socialinsider's data, half-year through 2026, TikTok's engagement rate dropped by 20%, entering a more pronounced decreasing phase, compared to the last two quarters. And here's how it compares to the other platforms:
- TikTok With an average engagement rate by followers of 2.70%, TikTok now registered its lowest values in the last year and a half.
- Instagram The platform remains on a slightly decreasing engagement path, dipping from 0.52% in Q1 2025 to 0.45% in Q1 and Q2 2026.
- Facebook: Facebook ticked up to 0.17% through the middle of 2025 before settling back down to 0.13% by Q4 2025, where it's remained flat through Q2 2026.
- X: X continued to post the lowest engagement rates among the analyzed platforms, dipping from 0.13% in early 2025 to 0.10%, where it has stayed flat since Q4 2025.
プラットフォーム別ソーシャルメディアベンチマーク 2026
毎年、ソーシャルメディアエンゲージメントの状況は変化します。ユーザー行動の変化、アルゴリズムの調整、ブランドのクリエイティブな戦略によって進化しています。
As we step into 2026, keeping up to date with the latest social media benchmarks becomes more crucial than ever for marketers wanting to set informed goals, outperform competitors, or report on campaign success. Because, as we all know, engagement benchmarks digging is so much more than finding and putting a pin on a number - it’s about context, clarity, and the confidence to know you’re putting your effort in the right place.
TikTokのパフォーマンスを向上させたい方も、Facebookの平均エンゲージメント率が気になる方も、Instagramで理想的なポイントを見つけたい方も、これらのソーシャルメディアのエンゲージメントベンチマークを理解すれば、現実的な目標を設定できます。さらに成果を自慢することもできます。
では、過去1年間で主要なプラットフォームのエンゲージメントはどのように変化したのでしょうか?詳しく解説します。
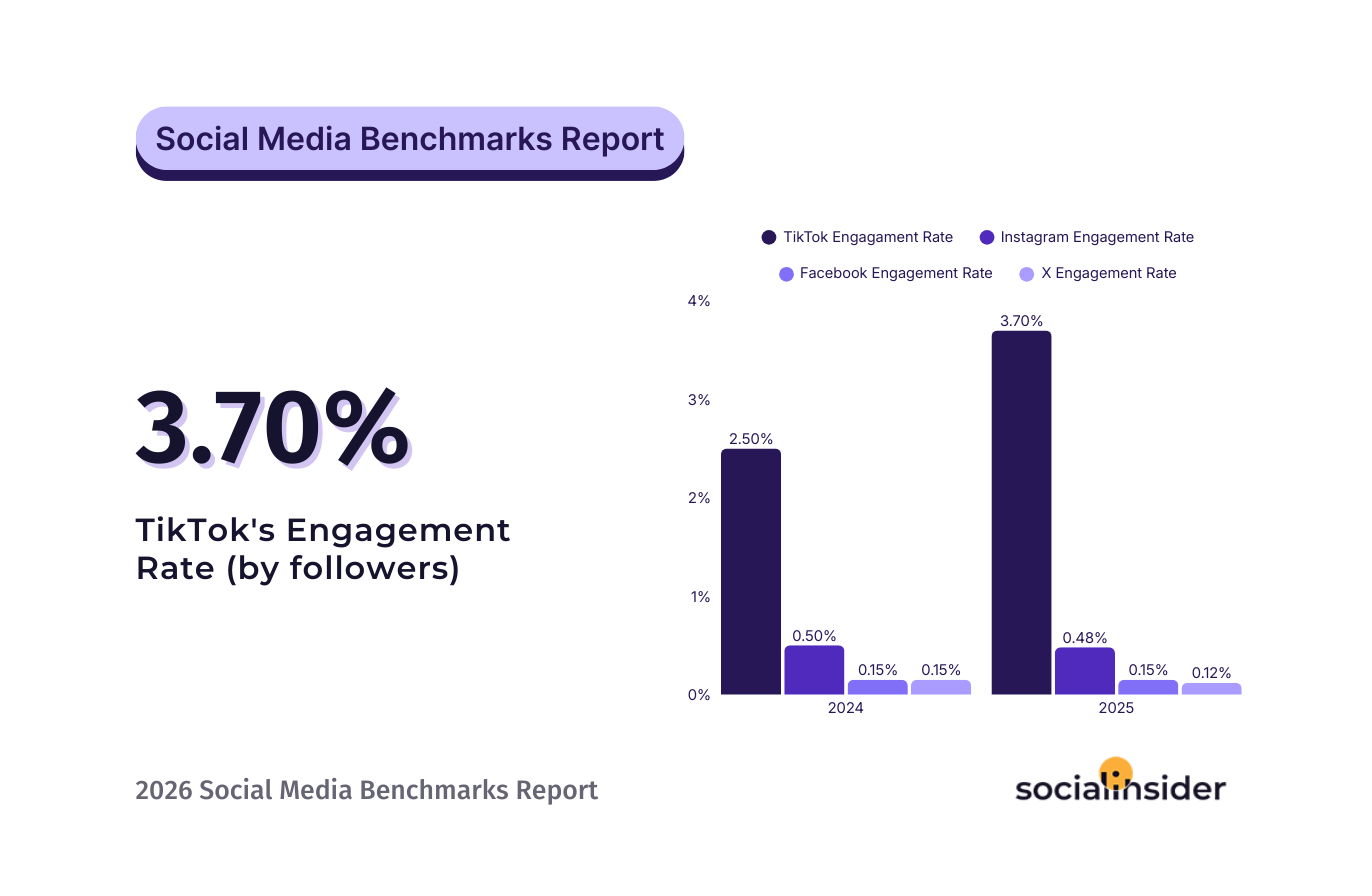
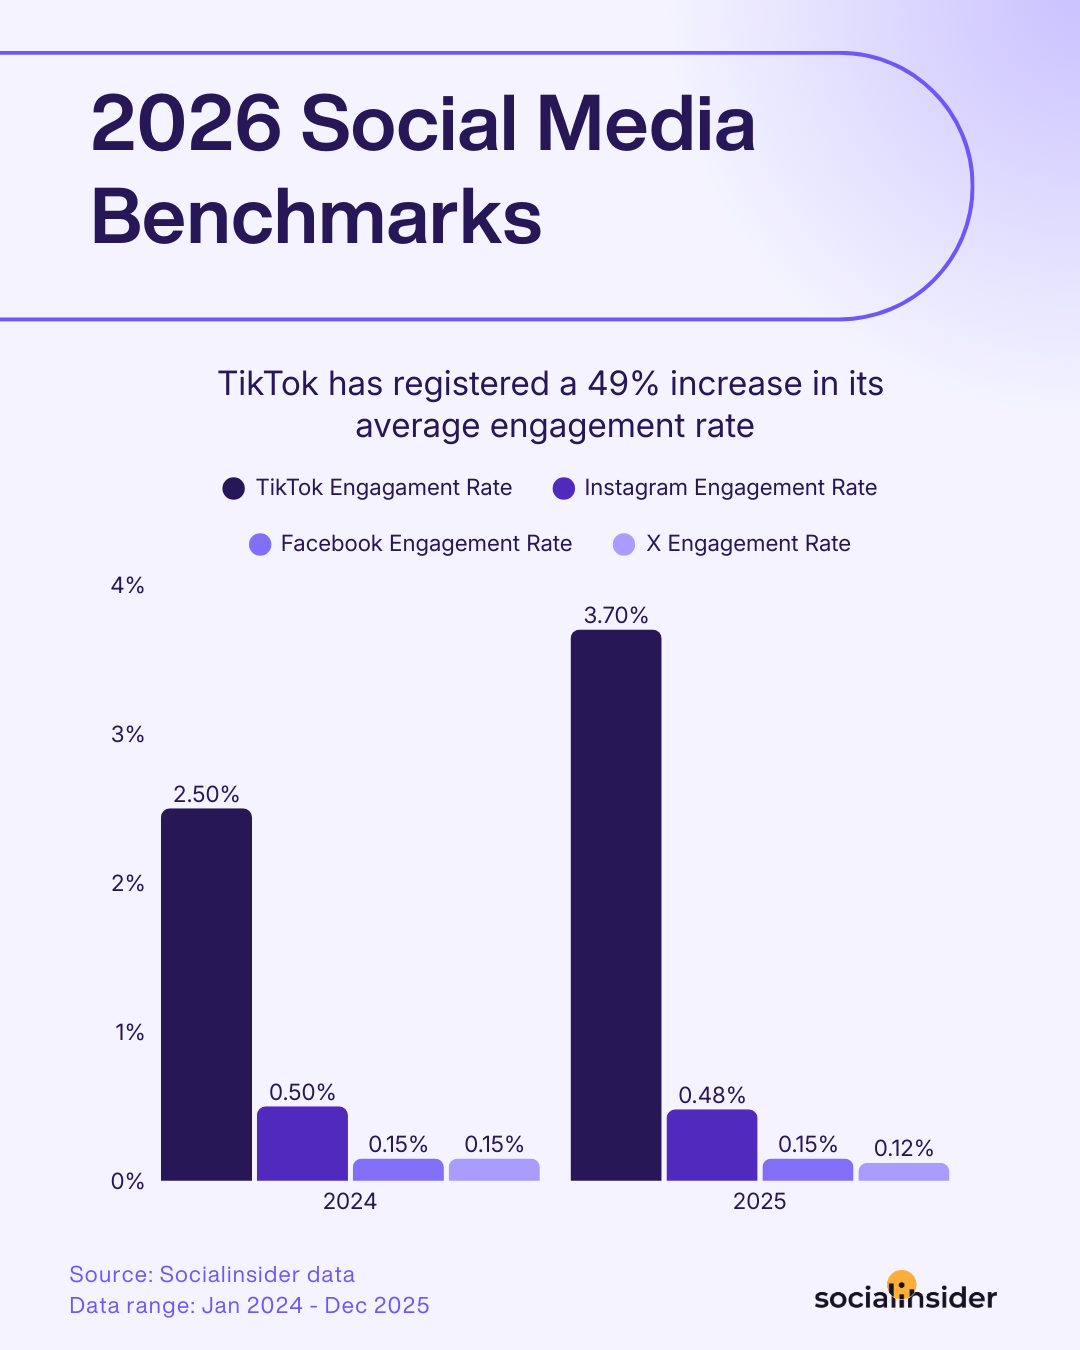
- TikTok: TikTokは再び話題となり、エンゲージメント率が2.50%から際立つ3.73%へ急上昇しました。前年比49%の成長は驚異的です。新しいオーディエンスの開拓や新境地を目指すブランドにとって、TikTokの成長は高いエネルギーと高リターンを実現する最適なチャネルであることを示しています。
- Instagram:ここからが注目です。Instagramのエンゲージメント率は、0.50%から0.48%へわずかに下がりました。大きな変化ではありませんが、少しの下落でも重要です。「Instagramの平均エンゲージメント率は?」と気になる方も多いはず。答えはここにあります。Instagramは、会話やつながりを生み出す点でFacebookより一歩リードしています。
- Facebook:驚かれるかもしれませんが、Facebookの平均エンゲージメント率は変わらず、前年比0.15%を維持しています。多くのブランドにとって、Facebookでの期待値は安定していると言えます。成熟しており、大きな変動の少ないプラットフォームです。2026年のFacebook平均エンゲージメント率を知りたい場合も、0.15%のままです。目指すべき数値が明確です。
- X:Xはどうでしょうか。プラットフォームのエンゲージメント率は、2024年の0.15%から2025年には0.12%にわずかに低下しました。今もXに投資しているブランドにとっては、より鋭いコンテンツ戦略や、変化する環境で注目を集める方法の見直しが求められています。数字は控えめですが、次のことを強く示唆しています。Xでオーディエンスのエンゲージメントを維持したいなら、現状維持ではいけません。
エンゲージメントの差が生まれる理由は、ユーザーがこれらのプラットフォームを全く異なる方法で利用しているからです。Instagramは今も洗練された美的なキュレーションが中心ですが、TikTokはよりありのまま、オーセンティックで即時的な雰囲気が特徴です。
TikTokでは、ただインスピレーションを得るためにスクロールするだけではありません。多くのユーザーが積極的に答えを探しています。ロンドンのレストラン探し、ニキビの解決策、最新のMarvel映画の正直なレビューなど、調べものはGoogleではなくTikTokで直接行う人が増えています。ただの便利ツール以上の存在です。TikTokは、とてもニッチな関心を持つコミュニティや、多くの場合で帰属意識を持てる場所でもあります。
「For You」ページがここで大きな役割を果たします。TikTokでの発見体験はとても自然です。アルゴリズムが、あなたが探していることに気付く前に、最適なコンテンツを表示してくれます。これが、より深いエンゲージメントを生み出します。TikTokは、ユーザーと本当に関心のあるコンテンツとの距離を短縮し、Instagramはスムーズな発見体験の点でまだ追いつこうとしている段階です。- Morgane Wasilewski、Channable ソーシャルメディアマネージャー
プラットフォーム全体でエンゲージメント率を高めるための戦略的な戦術です。
ベンチマークインサイトを実際の成果につなげたいですか?ソーシャルチャネル全体でエンゲージメント率を高めるための実証済みの戦術をご紹介します。
- ブランドに人間味を: 実際の人物やストーリーズ、舞台裏の瞬間を見せましょう。オーディエンスは、“ストック”や過度に加工されたコンテンツよりも、本物のエンゲージメントを感じるコンテンツに反応します。
- プラットフォーム固有の機能を活用しましょう: Xの投票、Instagramのリール、ネイティブのストーリーズ—それぞれの機能はアルゴリズムによる後押しと高いユーザー参加をもたらします。
- 強力なフックに投資しましょう:ダイナミックなビジュアル、大胆な見出し、または鋭い質問で、すぐに注目を集めます。オーディエンスがエンゲージメントする理由を早く伝えるほど、コンテンツのエンゲージメントは高まります。
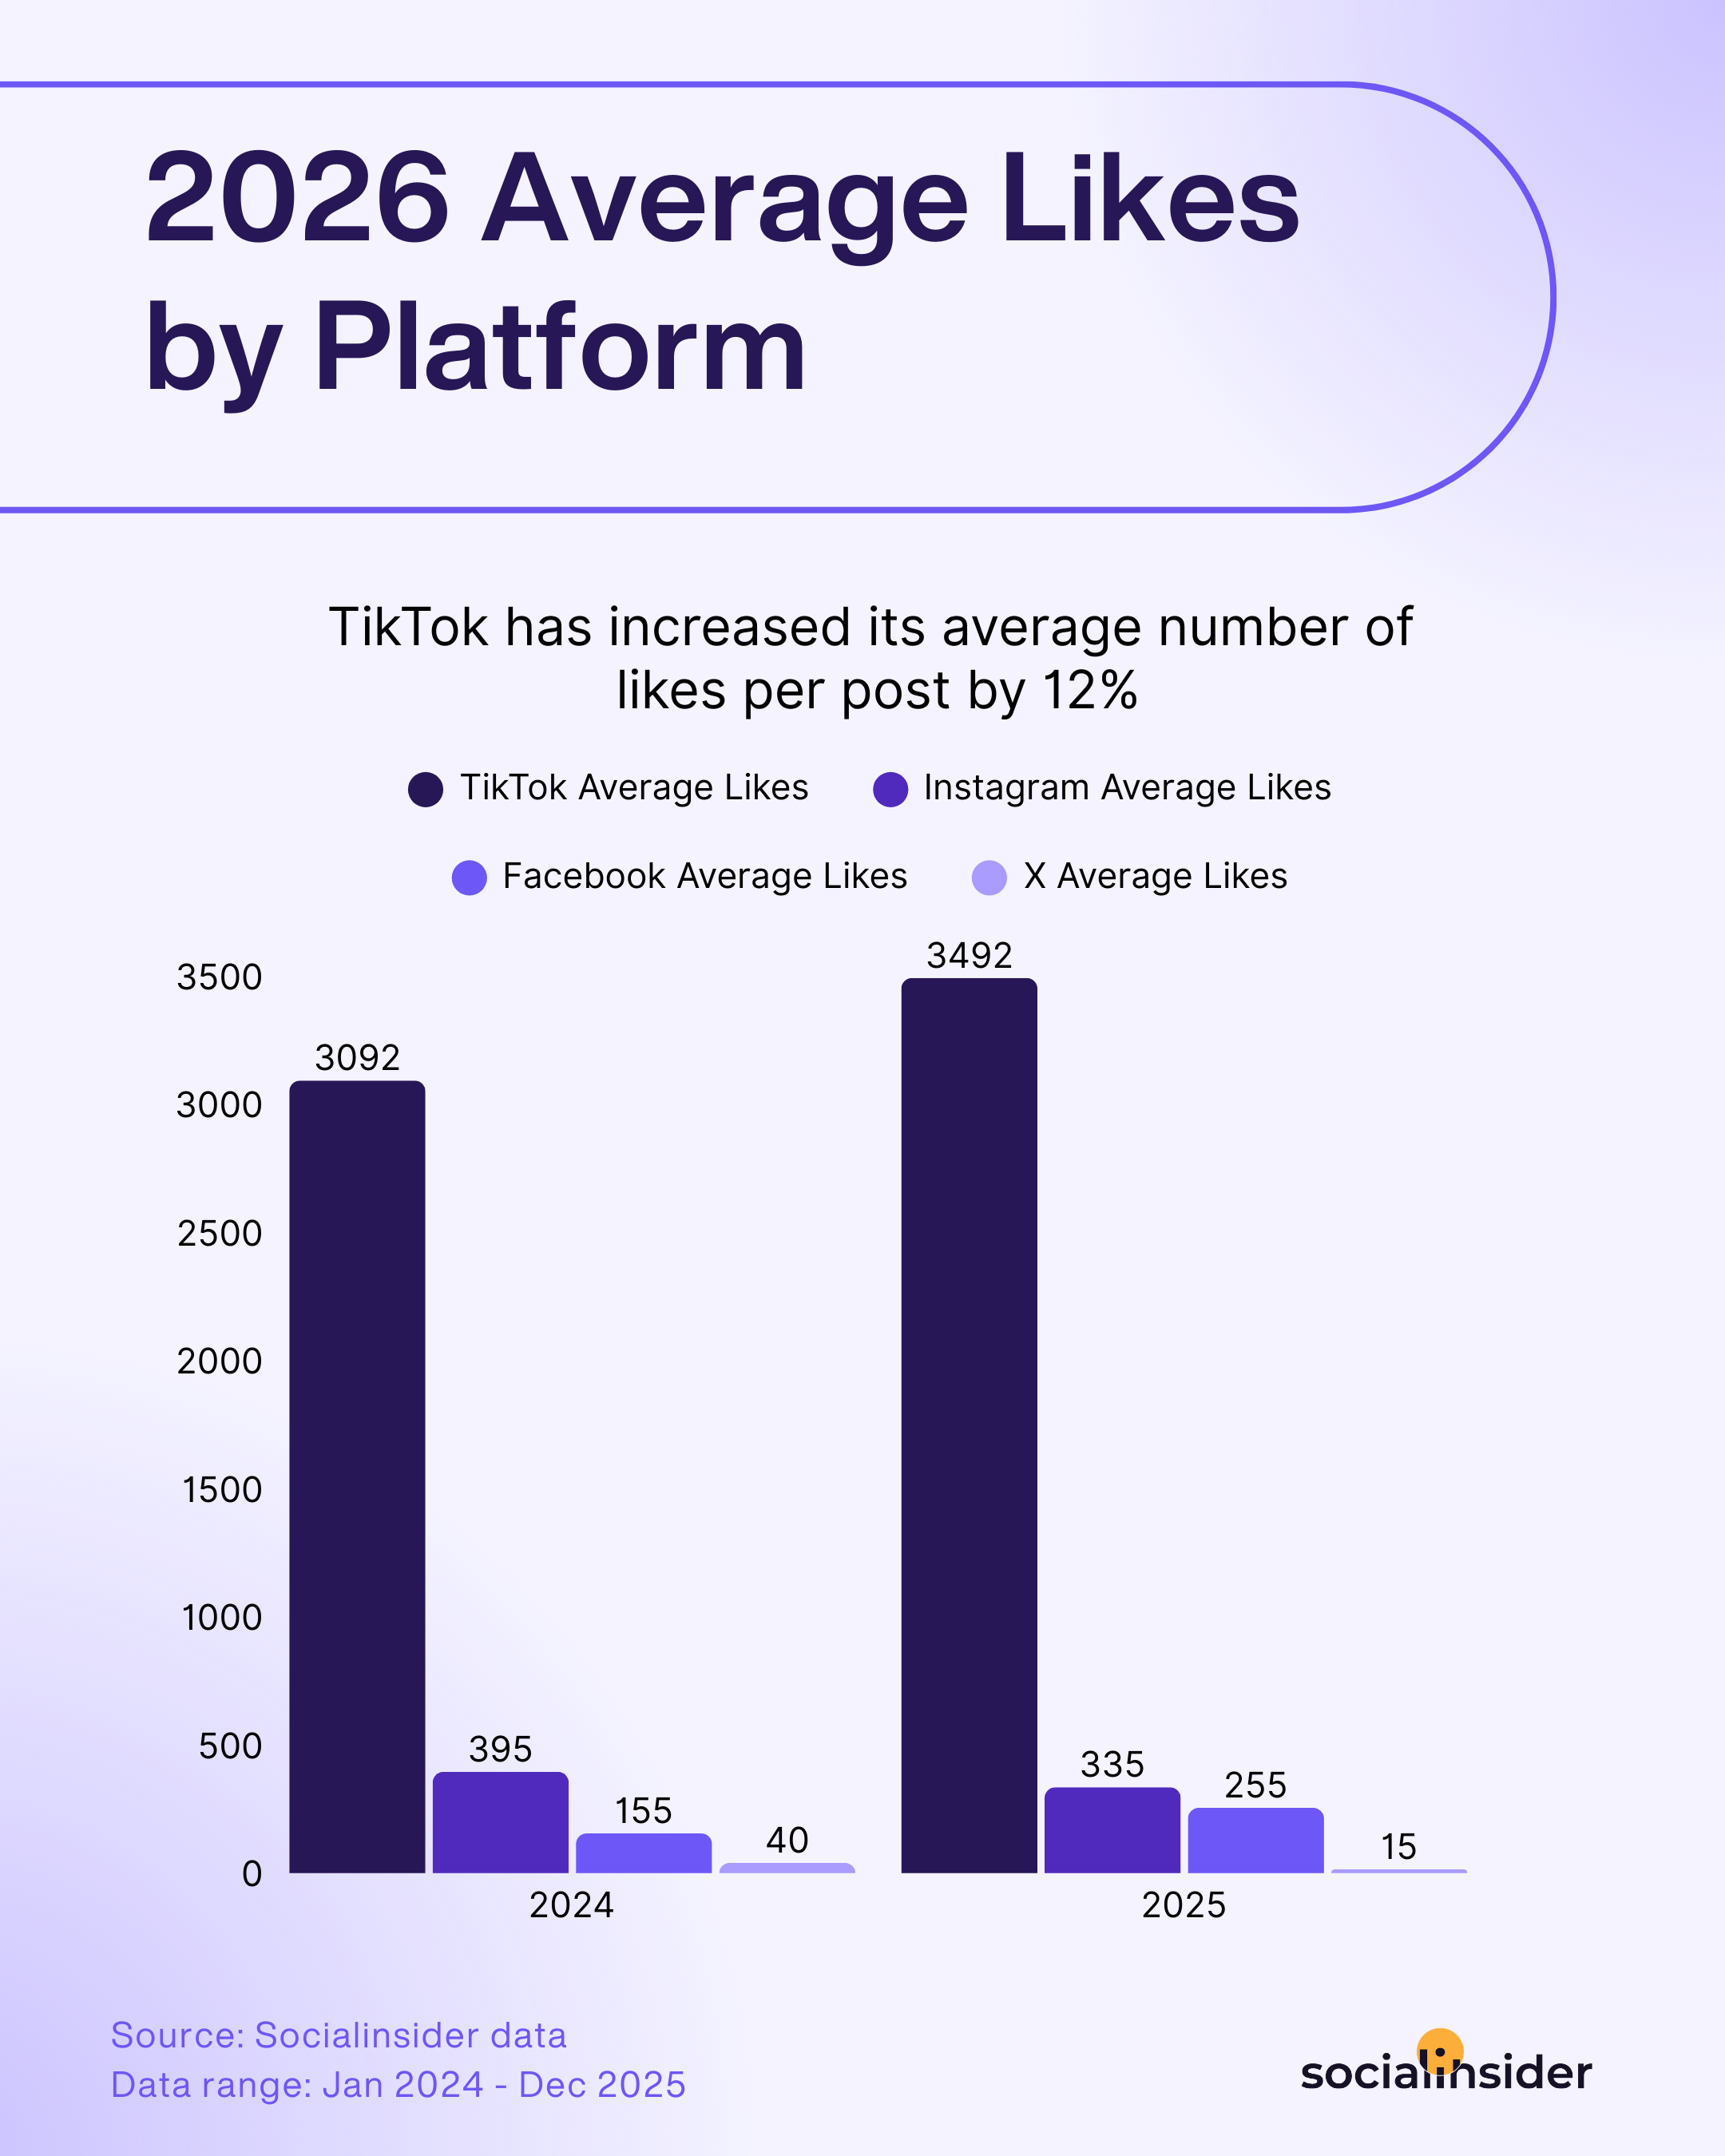
プラットフォーム別投稿あたり平均いいね数
It’s no secret that a quick glance at your like count gives you a pulse check on how your content is resonating. But averages across platforms?
ここでベンチマークが現実のロードマップとなります。「私たちは業界をリードしているのか、それとも更なる成長の余地があるのか?」という疑問に答える手助けをします。
- TikTok ソーシャルメディア界を盛り上げる存在として、TikTokは常にコンテンツへの高い需要で際立っています。ユーザーの熱意は衰えるどころか、12%も上昇しています。オーディエンスは単に存在しているだけでなく、クリエイティブで目を引く投稿を積極的に評価しています。トレンドを押さえ、新鮮さを保つなら、TikTokは今もオーガニックな注目と支持を得るための最適なチャンネルです。
- Instagram:今年、Instagramにはさりげない変化がありました。いいねは引き続き中心的な役割を持ちますが、競争が激化しています。過去の数値と比べて、いいねが15%減少しています。プラットフォーム全体の競争感が増したため、今まで以上にクリエイティブさと本物のコミュニティ構築が求められています。ブランドにとっては、独自性を強化し、コンテンツに明確な視点を持たせることが重要です。
- Facebook: 予想に反して、Facebookはユーザーのエンゲージメントが静かに復活しました。前年より64%多くのいいねを獲得しています。オーディエンスの声に耳を傾け、コンテンツを最適化するブランドには、Facebookが成功を約束します。トレンドが他に向いても、レガシープラットフォームでは本物感と関連性が成果を生み出せることを思い出させてくれます。
- X: いいねが前年比62%減少し、オーディエンスがさらに選択的かつ慎重になってきたことが明確になっています。1つ1つのいいねを獲得するのが難しくなっていますが、その分、価値も高まっています。ブランドは手を抜く余裕はありません。Xで注目を集めるには、より鋭く、関連性の高いコンテンツと、本当のエンゲージメントの在り方を見直す覚悟が求められます。
Instagramの「いいね」が減少しているのは、コンテンツの質が下がったからではありません。プラットフォームが、パッシブなエンゲージメントよりも視聴時間、保存、シェアを優先しているからです。ユーザーはDMや非公開チャンネルでますますやり取りするようになり、これらは公開メトリクスに表示されません。エンゲージメントが消えたのではなく、リーチを本当に生み出すアクションに移行しただけです。
Facebookの「いいね」復活は、ブランドがすべてのプラットフォームを同じ方法で扱うのをやめ、Facebookがコミュニティのために設計されたことを思い出した結果です。既存のオーディエンスに直接語りかける会話型の投稿は、エンゲージメントのハードルを下げ、再び「いいね」が自然な反応になります。これは、プラットフォームに最適化した戦略がクロスポスティングよりも効果的である証拠です。– Valeria Sillani、Global Social Media Manager(グローバル ソーシャルメディア マネージャー)、EasyVista、OTRS
全プラットフォームで「いいね」を増やす戦略的な施策
Here are several strategic moves you can use across any network to turn more of your audience into active fans:
- すぐに役立つコツやハック、インスピレーションを提供:短くて実践しやすいアドバイスや「ご存知ですか?」の豆知識、モチベーションを高めるメッセージをシェアしましょう。瞬時に価値を感じるコンテンツは、より多くのいいねやシェアを獲得しやすいです。
- ビジュアルストーリーテリングを最適化しましょう 目を引く画像や大胆なグラフィック、ストップモーションのビジュアルを優先してください。混み合ったフィードですぐに目立ちます。高品質でスクロールを止めるビジュアルは、第一印象で多くのいいねが期待できます。
- インタラクティブなフックで定期シリーズを作成:「マンデーモチベーション」や「水曜なんでも質問」など、継続的なコンテンツテーマを設定します。フォロワーが一貫したインタラクティブな投稿を期待し、楽しみにすることで、いいねが徐々に増加します。
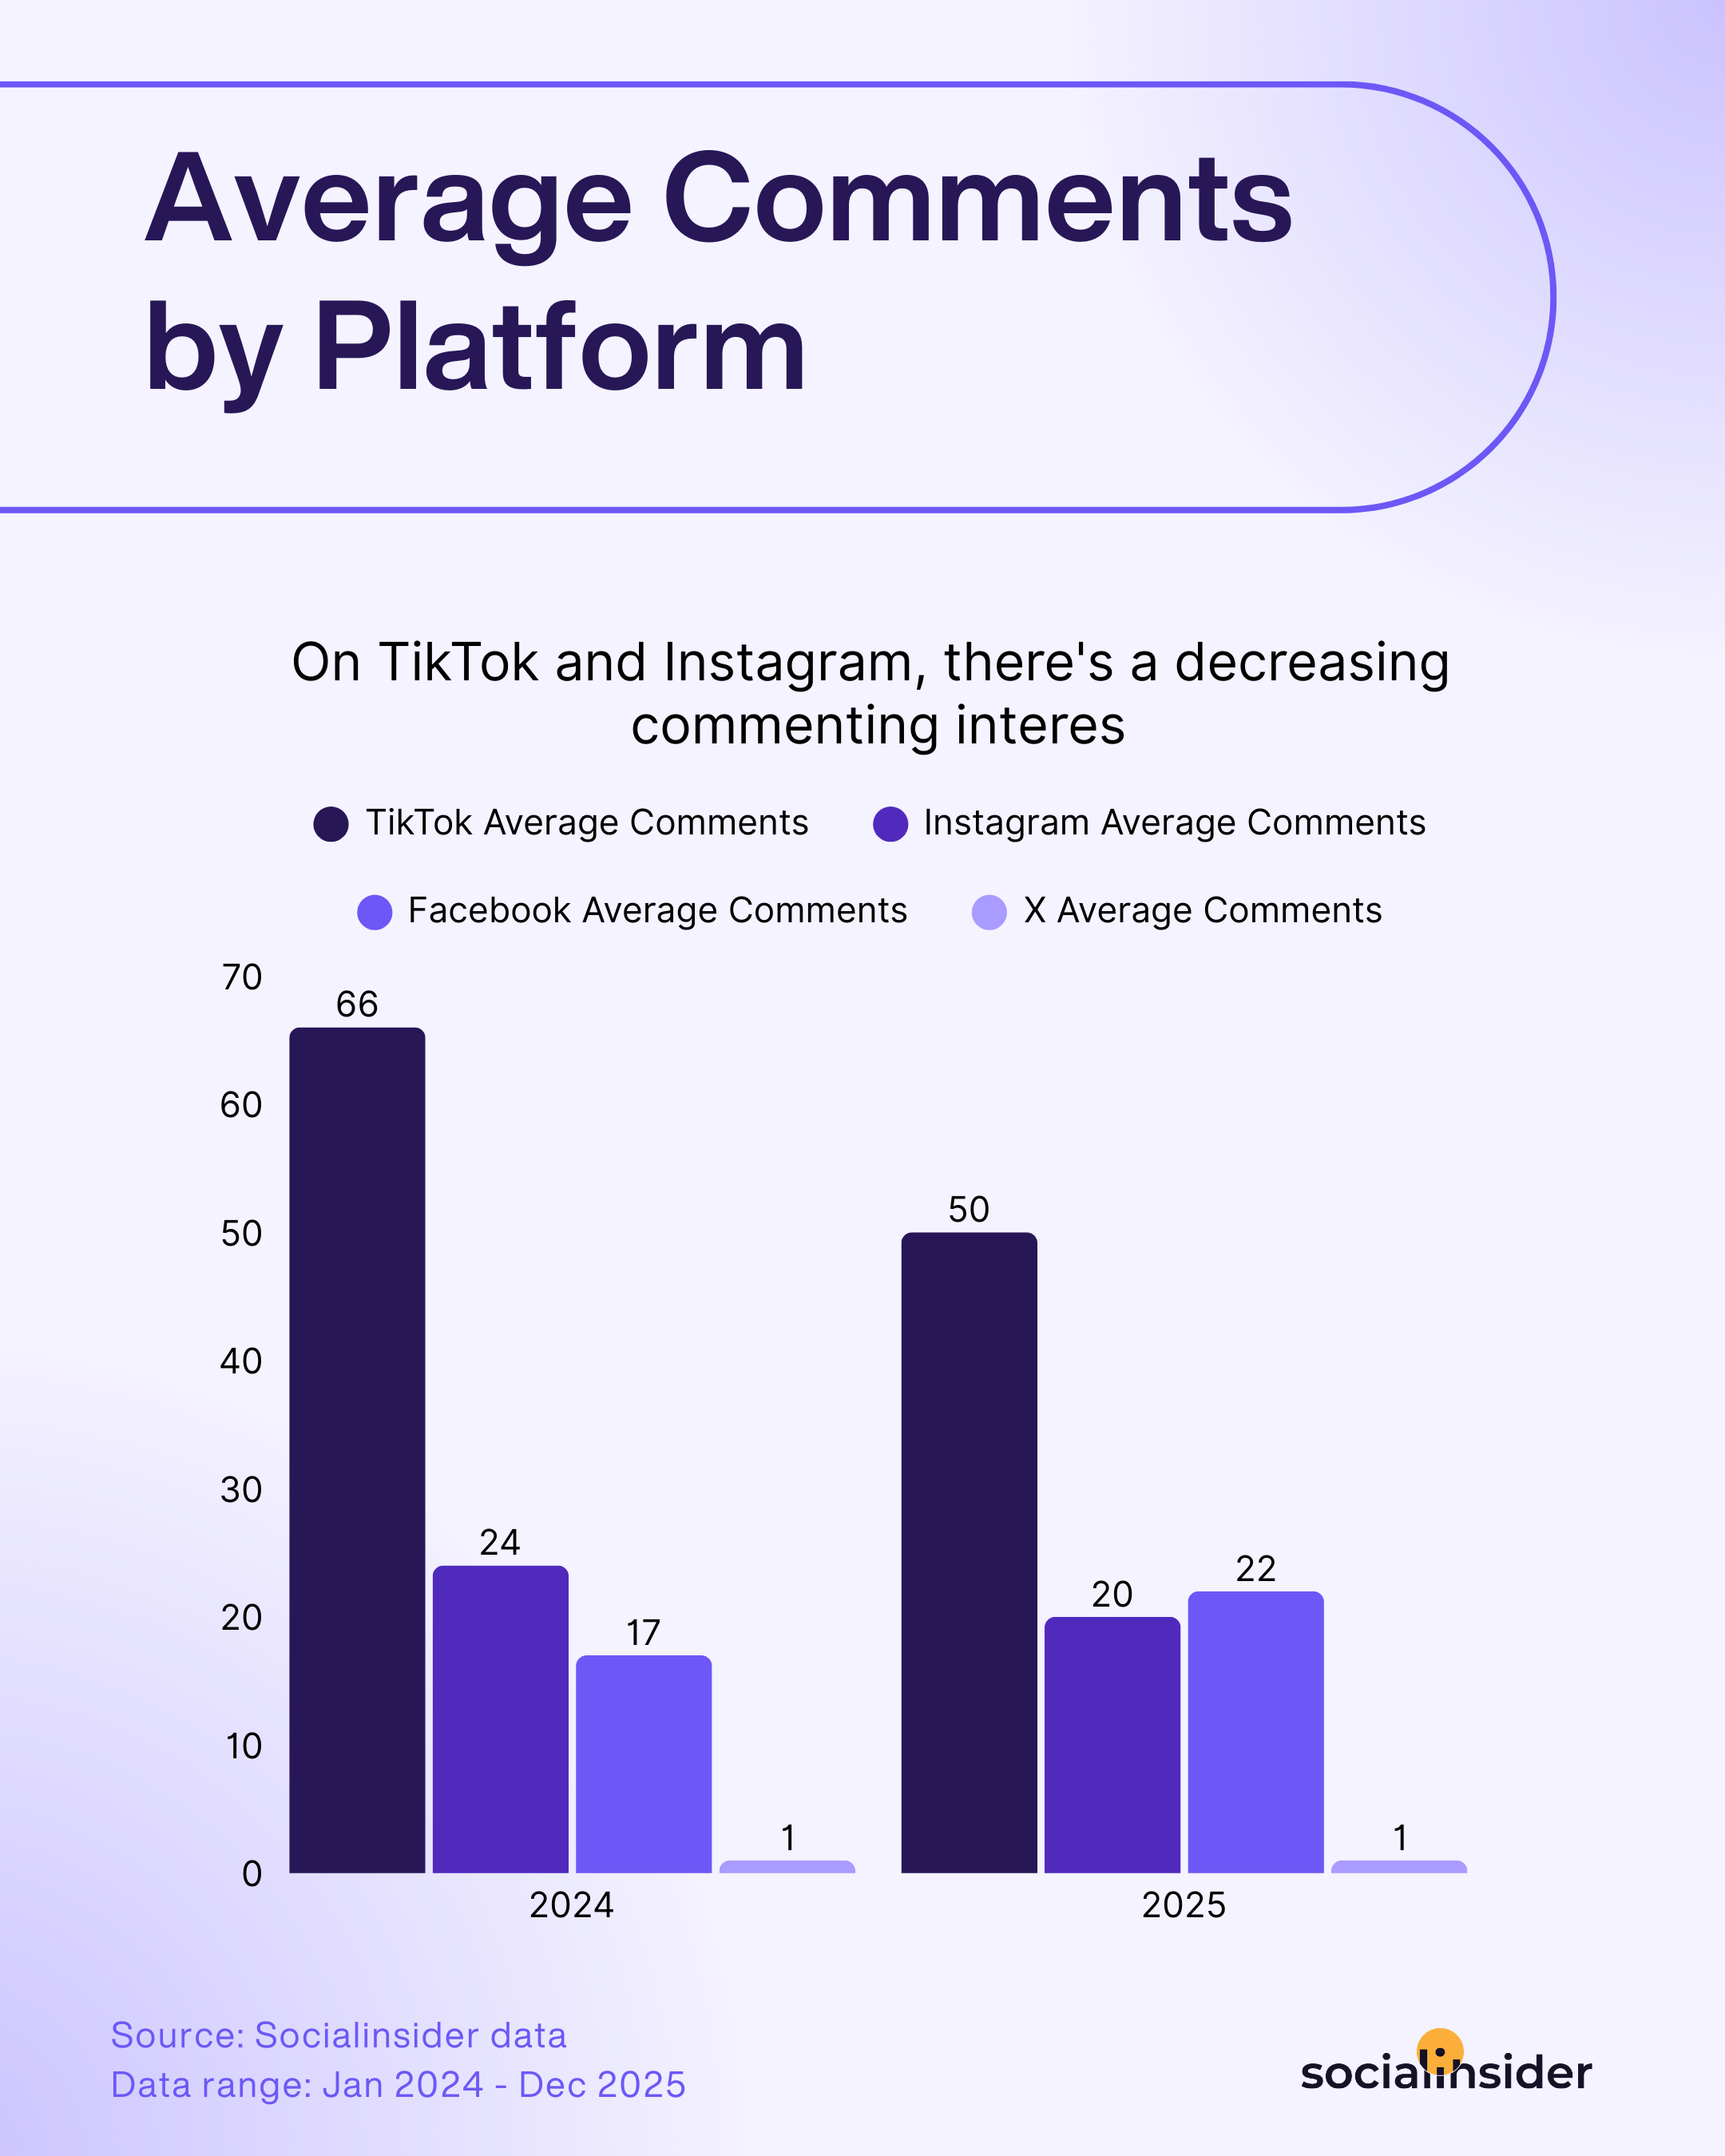
プラットフォーム全体の平均コメント数
コメントは本当のエンゲージメントが生まれる場です。オーディエンスがスクロールを止め、会話に参加し、自分の痕跡を残します。しかし、すべてのプラットフォームが同じように対話を生み出すわけではありません。今年は人々が会話を始めるアートに興味深い変化が見られました。
- TikTok:話題性は本物ですが、会話はより選択的になっています。TikTokは依然として多数の即時反応を生み出していますが、長いコメントスレッドへの参加は減少傾向です。コメント数は前年比24%減少しています。これはプラットフォームのインタラクションスタイルが進化しているサインです。短くてエネルギッシュなコンテンツが依然として主流ですが、より深い交流には新しいアプローチが必要かもしれません。
- Instagram:コメントによるエンゲージメントはInstagramの柱であり続けていますが、わずかに減少中です(前年比20%減少)。多くのコンテンツが注目を争う中、フォロワーに立ち止まり発言してもらうには、工夫した促しやコミュニティ重視のフックがますます重要です。
- Facebook: ソーシャルダイアログの原点であるFacebookに再び活気が戻っています。コメント数が20%増加しました。プラットフォームが長年続いていても、投稿のコメント欄はさらに活発化しています。親しみやすいフォーマットや信頼できるコミュニティの価値が表れています。ブランドが議論を育み、自由な意見交換を促すと、オーディエンスは積極的に参加します。
- X:ここでのエンゲージメントは短く即時的です。多くのユーザーはスクロールして、いいねするか、すぐ次に進みます。本格的な会話スレッドを構築したい場合は、無視できない鋭い意見やタイムリーなコメントを発信することが成功の鍵です。
コメントは時間がかかります。ユーザーはより迅速にコンテンツとエンゲージメントできる方法を求めています。公開でリアクションする代わりに、コンテンツを友人へプライベートやグループチャットで転送しています。これは、つながりを重視したエンゲージメントへのシフトを示しています。
また、Z世代は「スペクテーター・ジェネレーション」と呼ばれ、常に情報をチェックしている一方で、発言するタイミングや場所を慎重に選ぶ傾向があります。
さらに、プラットフォームやアルゴリズムも常に変化しています。私たちは視聴時間やシェアの優先度が高まっていることを確認しており、これも行動の変化を説明する要因かもしれません。全体的に見ると、このシフトはユーザーがコンテンツに引き続き関心を持っているものの、パブリックなスレッドではなく、痕跡を残さないプライベートなエンゲージメントを好むことを示しています。 - Melody Doffman, Social Media Manager at Nestlé
各プラットフォームでコメント数を増やすための戦略的な施策
どのプラットフォームでも活発なコメント欄を生み出し、維持するための戦略的なタクティクスをご紹介します。
- フィードバックやアイデア、提案を募集する: 新しい製品や機能、コンテンツの方向性についてご意見をお聞かせください。「次に何を試すべきですか?」「どう改善できますか?」などのフレーズで、オーディエンスに力を与え、声が大切にされていることを示します。それがコメントの動機になります。
- 未完のストーリーやオープンエンドのシナリオをシェア:クリフハンガーや「あなたならどうする?」といった質問、抜けている部分があるストーリーを投稿します。フォロワーの好奇心や参加したい気持ちを刺激し、会話を継続させることができます。
- マイクロインフルエンサーと連携し、本物のコラボを実現:大規模なスポンサー契約ではなく、ブランド価値観と一致するニッチやローカルのクリエイターと提携しましょう。彼らのロイヤルでエンゲージメントの高いオーディエンスは、コンテンツを信頼しています。これにより、ブランドメッセージがリーチとインタラクションの両方で確実に拡大します。
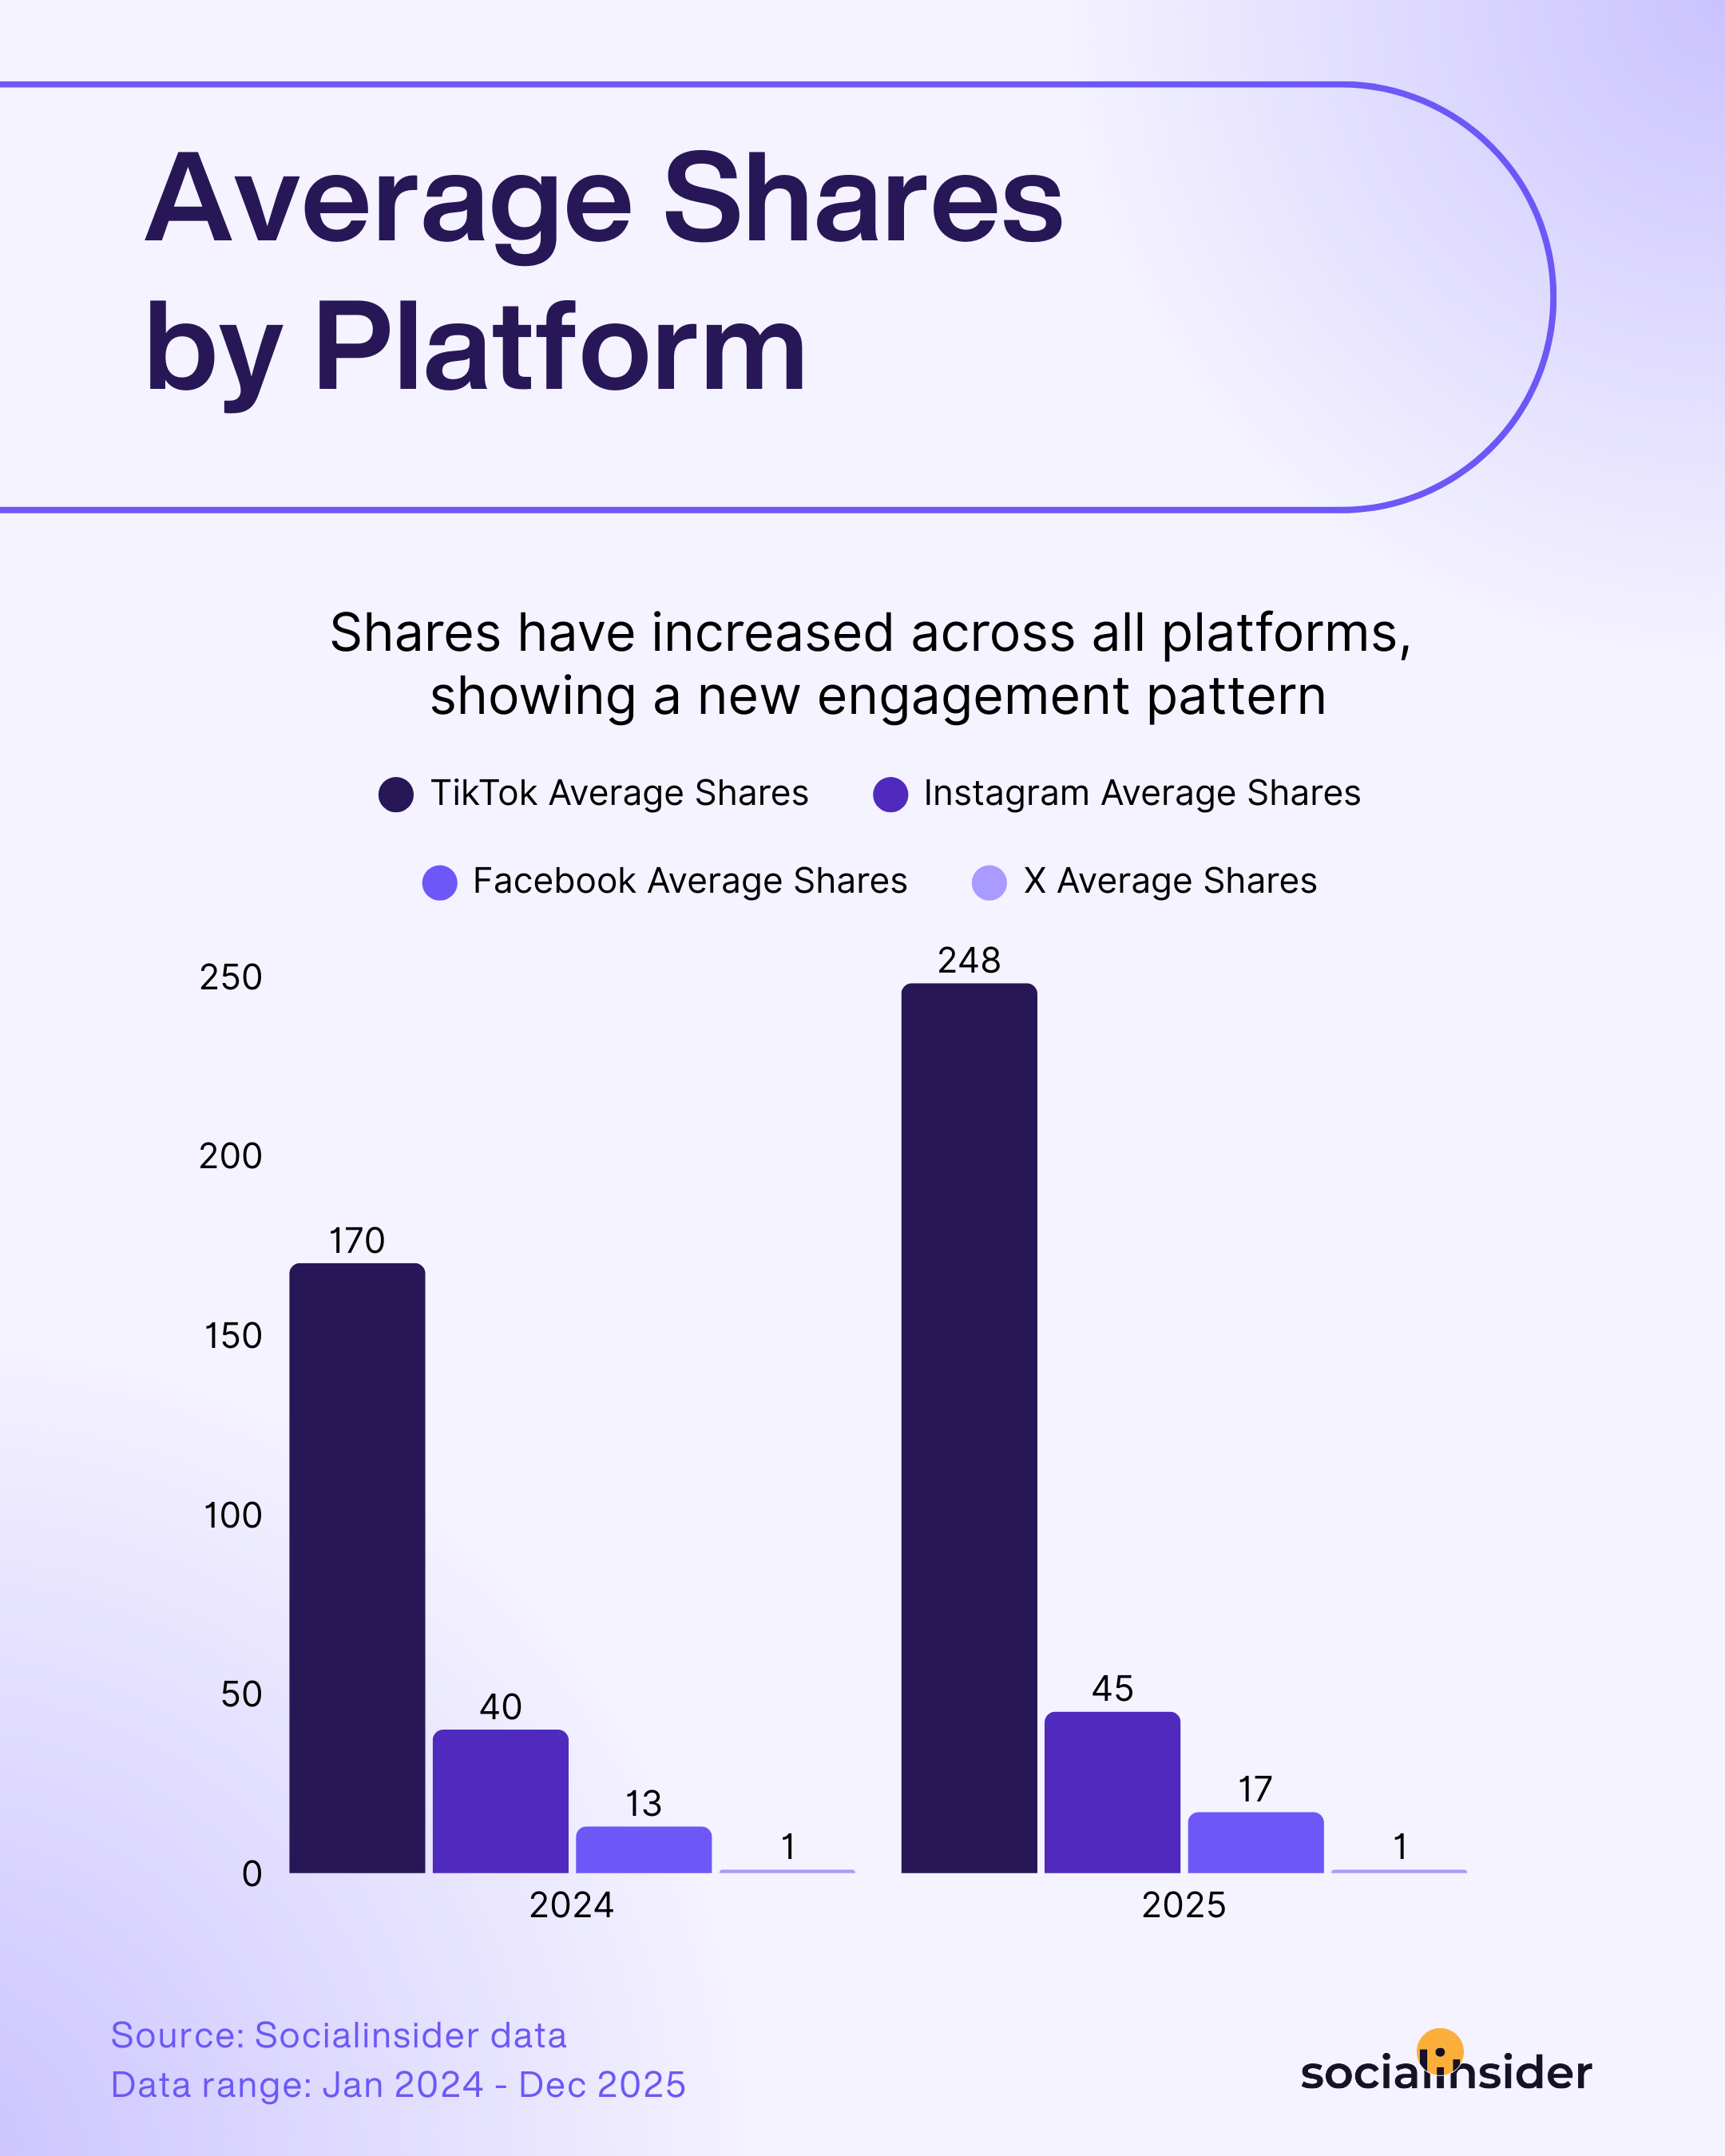
全プラットフォームの平均シェア数
オーディエンスがより選択的になり、多くの場合スクロールやスワイプ、または静かに「いいね」するだけになっています。その中で、「シェア」は新たな重要性を持つようになりました。シェアは今や、オーディエンスのアクションのゴールドスタンダードです。あなたのコンテンツが誰かの心に響き、自分のフィードを超えて広めたくなる証拠です。
この変化は、ほぼすべてのネットワークでパッシブな消費が増加している今、とても象徴的です。ユーザーが少しでも立ち止まることが成果となる中で、「シェア」したくなるほど価値あるものを届けている証です。それは拡散するに値する本当の価値を持っています。
今年のトレンドによると、すべてのプラットフォームがバイラル向きに作られているわけではありませんが、どのチャネルにも強力なシェアを生み出す独自のチャンスがあります。
- TikTok バイラルはTikTokで絶好調です。このプラットフォームのシェア文化は、ユーザーがエンターテイメント性や教育性、話題性のあるコンテンツを積極的に拡散することでますます活発になっています。トレンドを捉えたクリエイターやブランドにとって、TikTokは他にはないシェア力を発揮し続けており、前年比で実際に45%もシェア数が増加しています。
- Instagram:Instagramでのシェアは緩やかに増加し、12%アップしました。シェアボタンが主役ではありませんが、継続的にシェアされやすいコンテンツ(役立つヒントやミーム、美しいビジュアルなど)があれば、ユーザーはDMやストーリーズで拡散しやすくなります。
- Facebook:Facebookでもシェアが増加し、30%アップしました。価値のある共感できるコンテンツが広いオーディエンスに届いています。個人のつながりやコミュニティ重視の投稿が、オーガニックリーチ拡大の鍵です。
- X: Xでのシェア(リツイート)は横ばいです。大きな会話を生み出すことの難しさが強調されています。突破するには、コンテンツは特に大胆で、タイムリー、または意見が分かれるものでなければなりません。それ以外の場合、多くのユーザーは拡散するよりも見ているだけになります。
プラットフォーム全体でシェアを増やすための戦略的な戦術
スクロールするだけのユーザーをシェアする人に変えることは、どのプラットフォームでも共感の証です。TikTokが先頭を走っていますが、すべてのソーシャルネットワークは感情や価値に響くコンテンツを評価します。みんなが他の人に見せたくなる投稿を作ることに集中しましょう。
- ユーザー生成コンテンツ(UGC)を活用しましょう: 実際の顧客やフォロワーからの投稿、ストーリーズ、ケーススタディを紹介します。自分自身や共感できる人が登場するコンテンツはシェアされやすくなります。また、UGCは信頼性を瞬時に高めます。
- 感情に訴えかける—ユーモア、驚き、またはインスピレーション: 人々を笑わせたり、注目を集めたり、心を動かすコンテンツは自然とシェアされます。強い反応を引き起こす瞬間やメッセージに注目しましょう。フォロワーが共有したくなります。
- シェアを参加の一形態として促進する Invite your audience to be part of a movement—whether it's tagging friends, joining a challenge, or sharing their take on a topic. When sharing becomes a way to participate, your reach multiplies.
マーケターがシェアを増やしたい場合、人々が本当にグループチャットで送りたくなるコンテンツに集中する必要があります。それは、共感できるものや本当に役立つもの、クリエイティブに刺激されるもの、または単純に人を笑顔にするものかもしれません。共通するのは「価値」です。あなたのコンテンツは、ユーザーのスクロールの中で選ばれる価値を持つ必要があります。
シェアは自己表現の一つでもあります。人が投稿をシェアするとき、興味や価値観、ユーモアのセンスを示しています。自分自身の行動にも注目しましょう。他のブランドやクリエイターのコンテンツをシェアした時は、保存してそのアイデアが自社ブランドでどう活用できるか考えてください。
また、ゼロから新しいものを作る必要はありません。最もシェアされた投稿を分析し、トピックやフォーマットのパターンを発見しましょう。すでに効果のあったアイデアを再利用することもためらわないでください。マーケターは自分たちが発信したものすべてを把握していますが、一般のフォロワーはそうではありません。そのため、強いアイデアを再活用することでより大きな効果が得られます。- Elissa Wardrop、IKEAのソーシャルメディアスペシャリストIKEA
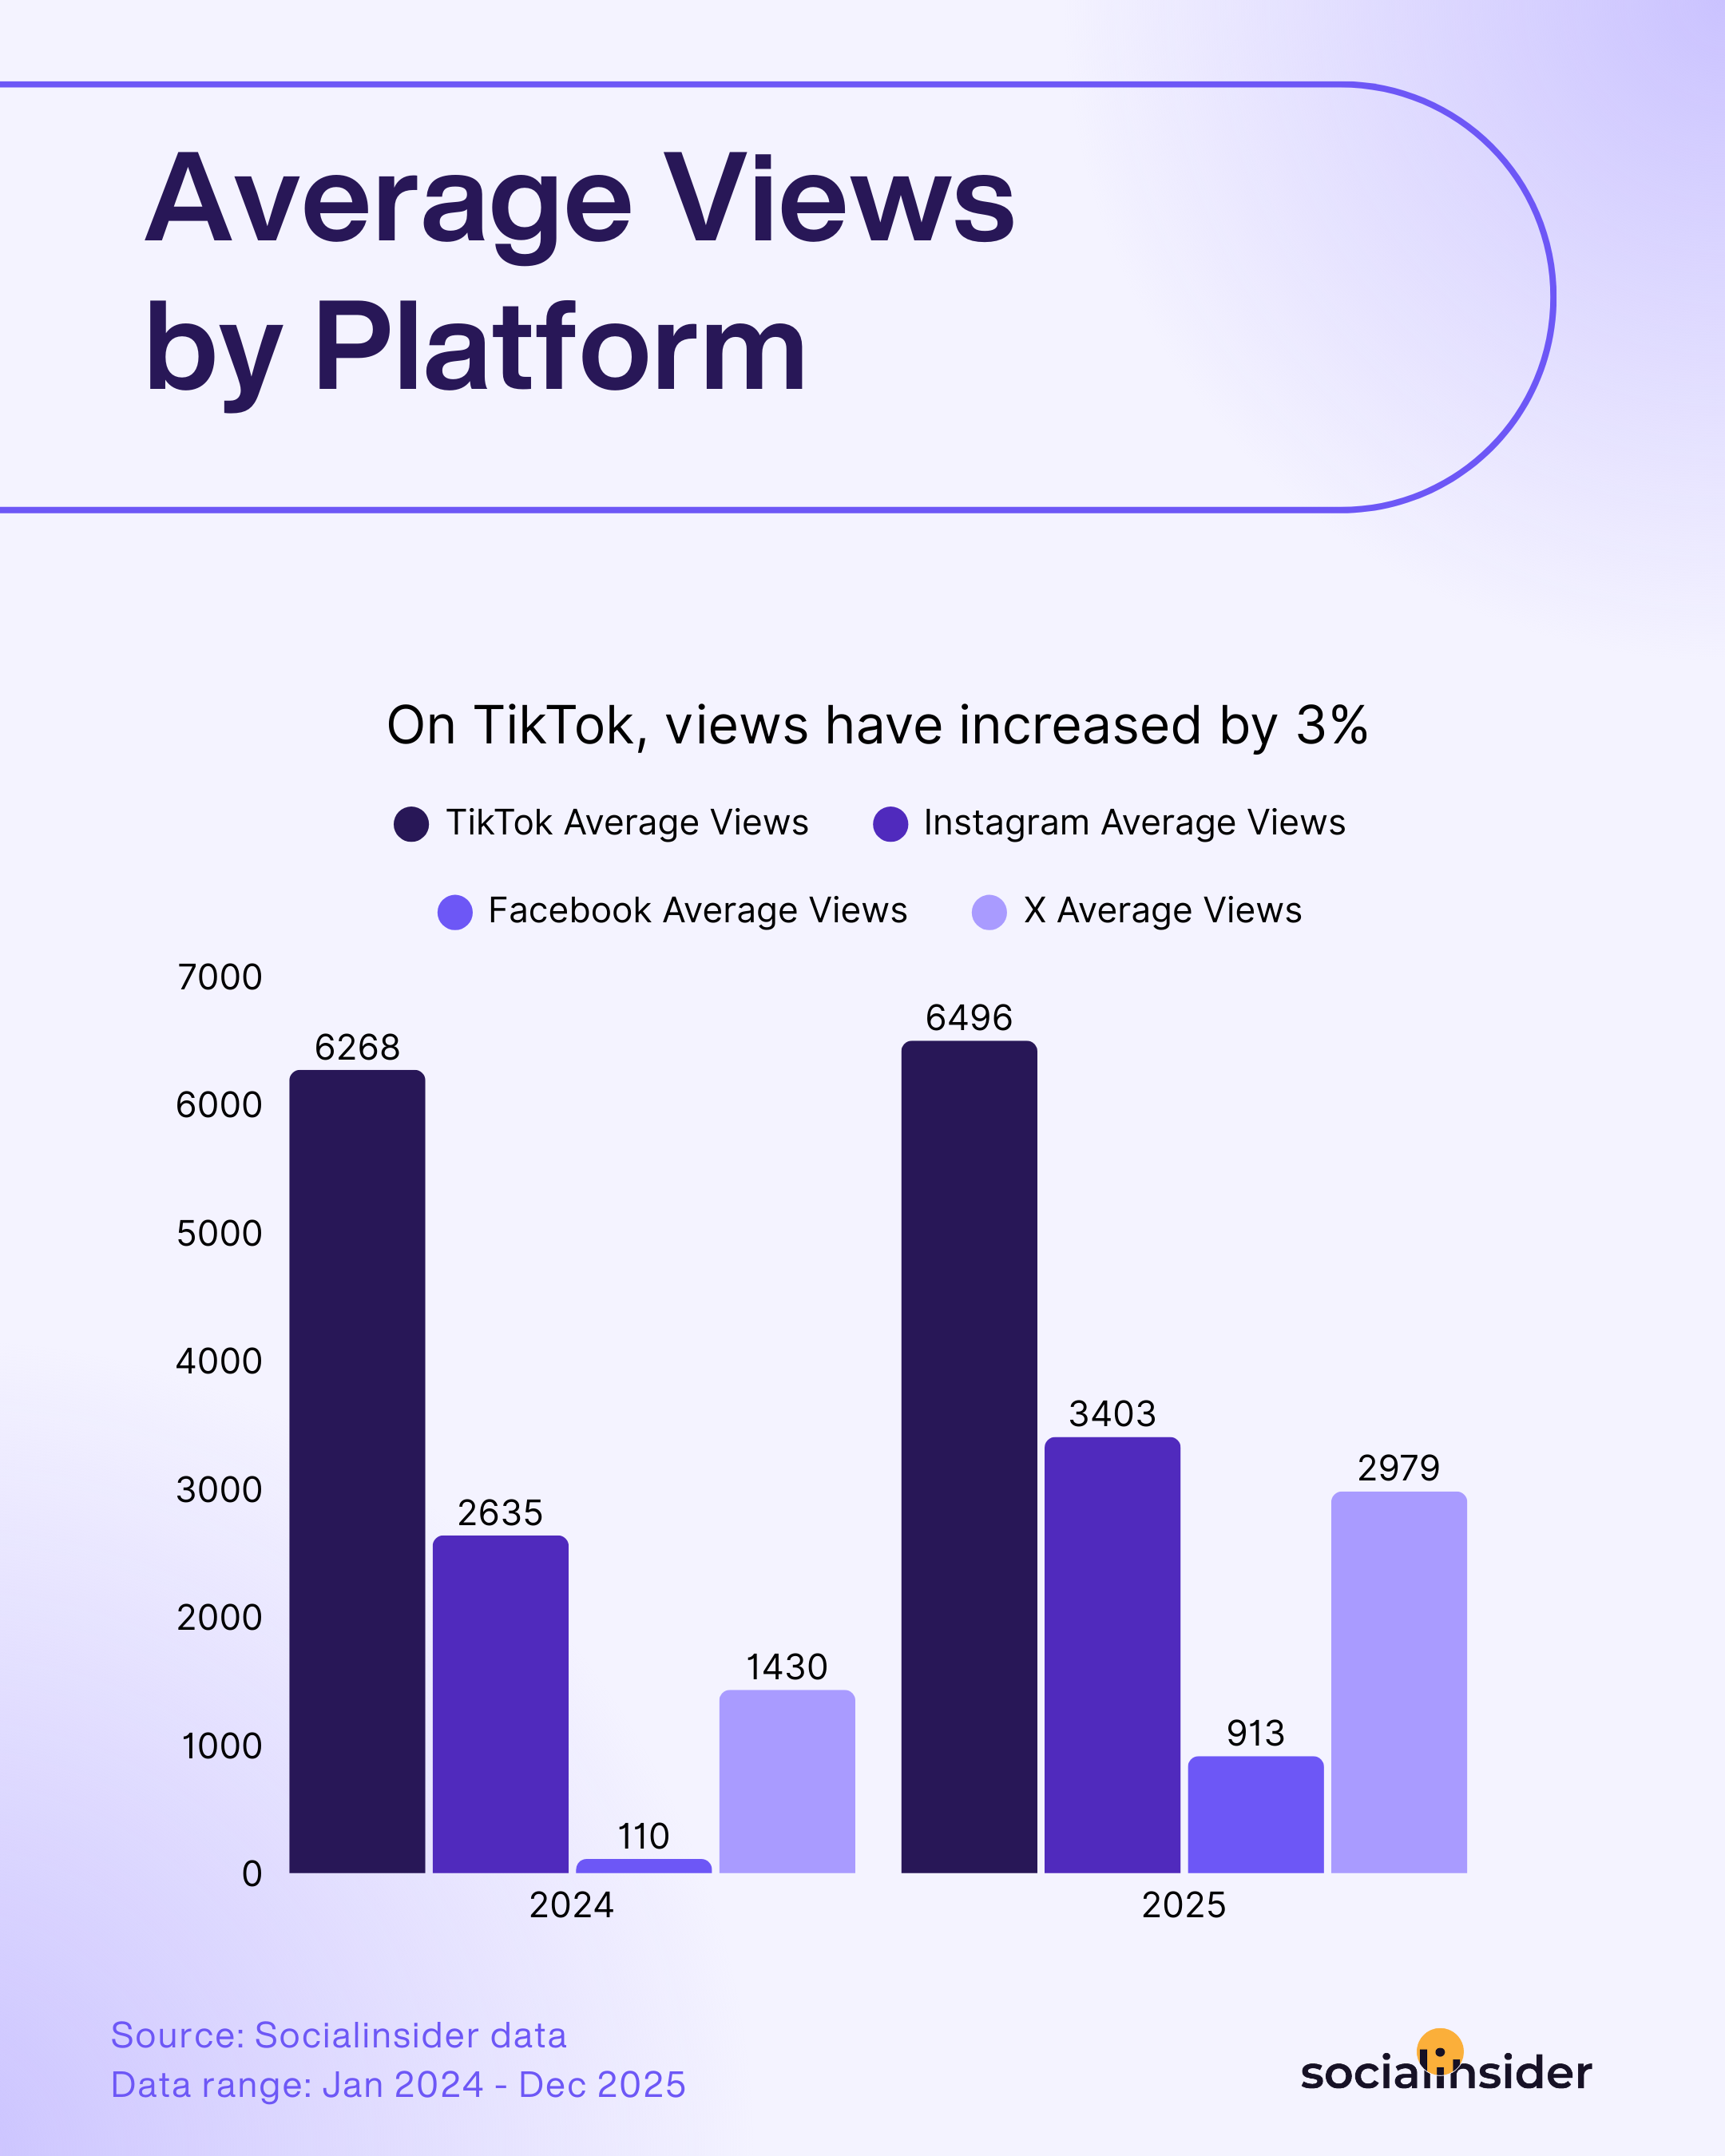
全プラットフォームの平均視聴回数
視聴回数はソーシャル成功の基礎です。すべてのいいね、コメント、シェアは、誰かがまず視聴することから始まります。しかし、視聴習慣は変化していきます。人々がどのように、どこでコンテンツを消費するかの変化が、本当の注目とチャンスを明らかにします。
- TikTok:TikTokの勢いは依然として強いです。常に多くのユーザーが集まり、平均視聴回数は前年比3%増加しています。このプラットフォームは、バイラルリーチの定番となり続けています。クリエイティブでトレンドを押さえたコンテンツは、ここでも広く可視化されて報われます。
- Instagram:Instagramでは視聴回数が大幅に増加し、29%の伸びを記録しました。これは、2025年からインプレッションが視聴回数に変換される新たな計測方法の影響も考えられます。注目ポイント:Instagramは、特に短尺でビジュアル重視のコンテンツでリーチを拡大したいブランドにとって、急速に力強いプラットフォームとなっています。
- Facebook: Facebookでは視聴回数がわずかに減少し(17%減)、オーガニックリーチがさらに難しくなってきています。注目を集めるために、ブランドはフォーマットや投稿タイミング、そして話題性の高いテーマで差別化を図る必要があります。ノイズの中で目立つ工夫が求められます。
- X: 今年は視聴回数が大きく伸び(50%増)、バイラルな話題やプラットフォーム文化の変化が関係していると考えられます。短尺でニュース性が高く、ビジュアル重視のコンテンツがより多くのオーディエンスにリーチしやすくなりました。新たな可能性を活かし、大胆に挑戦するブランドにとってチャンスです。
2025年、Instagramのディスカバリーエンジンはこれまで以上にコンテンツを広く、そして速く拡散しました。リールがプラットフォーム上の滞在時間の20%以上を占め、再生時間も3分に拡大。ブランドはより多くの面で、より長く注目を集めるチャンスが増えました。ディスカバリーはもはやフォロワー数に依存しません。動画中心のコンテンツとコラボレーションがアルゴリズムに評価されます。これにより、小規模なブランドでもオーガニックで数千人にリーチし、有意義な視聴回数を獲得。広告費だけに頼らず成果を生み出せます。- Sara Zuehlke、Digible シニアソーシャルメディアストラテジスト
複数プラットフォームで視聴回数を増やす戦略的な戦術
Ready to get your content in front of more eyes? Try these proven tactics to expand your and drive up your view counts across every platform:
- カルチャルな瞬間やリアルタイムのイベントを活用しましょう:React to trending news, holidays, or viral topics with your brand’s unique angle. Timely, relevant reactions often earn higher viewst as audiences dive in on what everyone’s already talking about.
- チームや従業員によるシェアを促進: 社内チームやブランドアンバサダーが自分のネットワークにコンテンツを共有できるよう動機づけます。早期の露出が拡大し、新しいオーディエンスを獲得できます。
- 目を引くサムネイルとタイトルを活用: 印象的で好奇心をそそるサムネイルとタイトルをデザインします。オーディエンスのクリックや再生を促します。
視聴回数の増加は、これまでリーチできないと感じていたブランドにとって大きなチャンスです。視聴回数が増えることで、完璧を求めるプレッシャーは下がります。大切なのは、明確な視点を持ち、継続的に発信し続けることです。頻繁な販売ではなく、クリエイティブさや関連性、ストーリーテリングに注力してください。視聴回数はチャンスの扉を開きますが、本当に成果を生み出すのは、繰り返しによる認知とブランド構築、そして注目された後に何をするかです。」- Victoria I.、fatjoe ブランドマネージャー
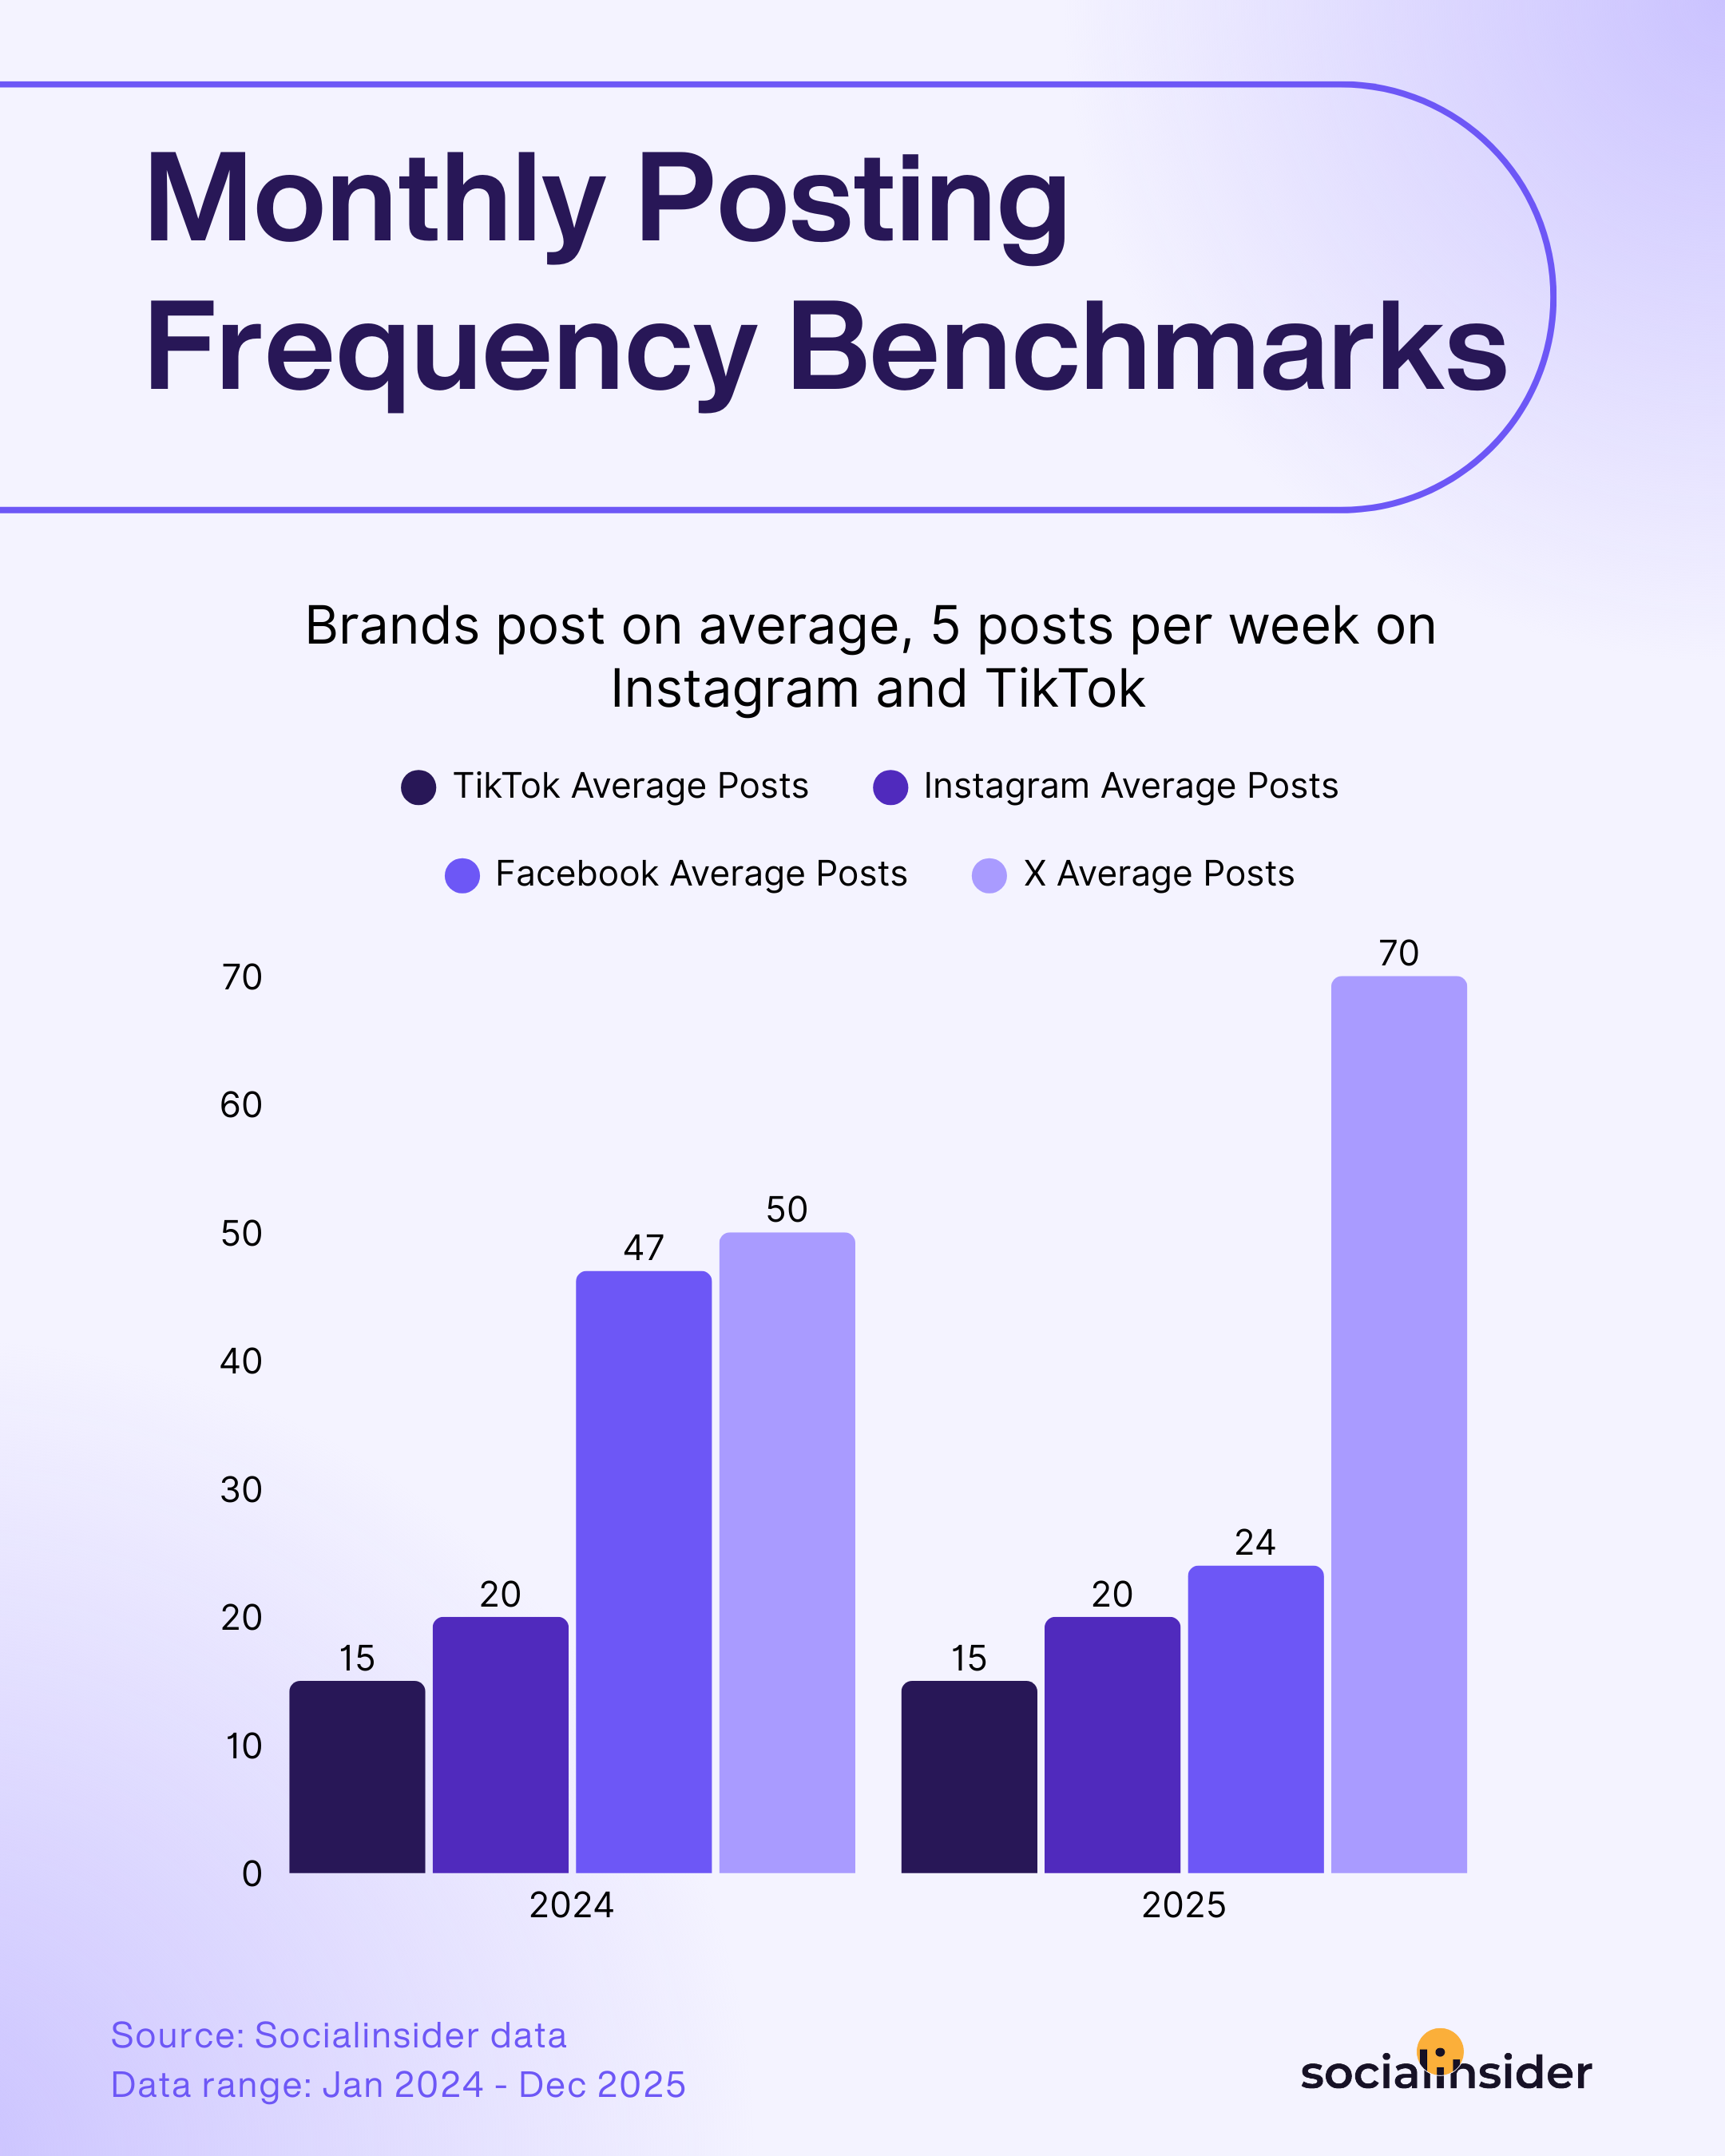
月別投稿頻度のベンチマーク
投稿の頻度は、シェアする内容と同じくらい重要です。投稿リズムの進化を簡単にご紹介します。それぞれのプラットフォームで貴社ブランドの可視性がどう変わるかご確認ください。
- TikTok:一貫性が重要です。ブランドは安定した投稿ペースを保っています。プラットフォームは定期的な参加を評価しますが、ユーザーを圧倒することはありません。リラックスしながらも信頼できる投稿リズムで勢いを継続することがカギです。
- Instagram: 投稿数は安定しています。Instagram では、量だけでなく、投稿、ストーリーズ、リールといった質とバラエティが重要です。これがオーディエンスのエンゲージメントやアルゴリズムに好影響を与えています。
- Facebook: 投稿頻度が大幅に減少(48%減)しています。ブランドは量から選別された高価値な更新へシフトしています。混雑したフィードの中でも目立つ情報発信を目指しています。
- X:投稿ペースが40%加速しました。このプラットフォームのリアルタイム性と常時稼働の特性を示しています。タイミング良く高頻度で投稿することが、話題性を保つ鍵です。少しの遅れも、議論から取り残される原因になります。
Xプラットフォームは、スピードと会話を重視します。洗練されているだけや、作り込まれたコンテンツ、見た目重視のコンテンツは評価されません。ブランドはXをコンテンツカレンダーが必要なものとして扱うのをやめましょう。チームメンバーが、バッチ投稿だけに専念するのではなく、関連する会話に積極的に参加することを促進してください。
業界キーワードを監視するモニタリングやソーシャルリスニングツールを導入し、明確なブランドガイドラインを提示しましょう。そして、チームの個性や人間らしさを大切にしてください。一つの本物の返信が、一週間分の予約投稿を上回る効果をもたらすこともあります。 – Bukunmi Weke、ソーシャルメディアストラテジスト
十分なリソースがあり、クリエイティブと制作プロセスが強いチームにとっては、週に5回投稿するのは素晴らしいことです。これはSocialinsiderのベンチマークでも示されています。ただし、多くのブランド、特に少人数のマーケティングチームでは、投稿頻度を追い求めることで創造性が失われる落とし穴に陥りがちです。
重要なのは回数ではなく、継続性と価値です。私は常に、ただ回数を満たすより、本当に共感される質の高い投稿を少なく選びます。” – Danielle Mote、ソーシャルメディアスペシャリスト、Construct ItおよびBJS
投稿戦略を最適化する戦術
Want to make every post count? Try these practical tactics to fine-tune your posting cadence and keep your audience engaged—no matter the platform:
- コンテンツをまとめて作成・スケジュール設定: 事前に計画することで、忙しい週でも一貫性を保てます。最適な頻度を見つけて、無理なく運用できます。
- フォーマットとコンテンツタイプをミックス: 同じ投稿形式だけに頼らず、動画・画像・カルーセル・ストーリーズやライブ配信もローテーションして、異なるオーディエンス層をエンゲージし、フィードを常に新鮮に保ちましょう。
- アナリティクスであなたの最適ゾーンを見つけましょう: オーディエンスが最もアクティブな時間帯や、エンゲージメントが高い投稿パターンを確認できます。それに合わせてカレンダーを最適化しましょう。
続きを読む:
メソドロジー
このソーシャルメディアベンチマークレポートでは、TikTok、Instagram、Facebook、Twitterで積極的に活動している国際ブランドの代表的なサンプルを、2024年1月から2025年12月までご紹介します。本調査結果は、70,000,000件のソーシャルメディア投稿の分析に基づいています。
ソーシャルメディアのエンゲージメント率は、Facebook、Instagram、Twitter、TikTokの投稿におけるコメント、リアクション、シェアといった測定可能なインタラクションで定義します。プラットフォームごとに特有の条件があります。
Facebook投稿ごとのエンゲージメント率(フォロワー基準):投稿ごとのFacebookエンゲージメント率は、その投稿のリアクション、コメント、シェアの合計をページのファン数で割り、100を掛けて算出します。
Instagramエンゲージメント率(投稿ごと・フォロワーごと): Instagramエンゲージメント率は、投稿のいいね数とコメント数の合計をフォロワー数で割り、100をかけて算出します。
Twitterエンゲージメント率(投稿ごと・フォロワー基準):Twitterエンゲージメント率(投稿ごと)は、該当ツイートが獲得したいいねとリツイートの合計数を、そのページのフォロワー数で割ります。その結果に100を掛けた値です。
TikTokエンゲージメント率(投稿あたり・フォロワー基準):TikTokエンゲージメント率は、投稿についたいいね、コメント、シェア、保存の合計を、そのページの総フォロワー数で割り、その結果に100を掛けて算出します。
投稿あたりの平均いいね数:投稿が平均で受け取るいいねの数を示します。
投稿ごとの平均コメント数:投稿が平均で受け取るコメント数を示します。
投稿あたりの平均シェア数:投稿が平均で何回シェアされたかを示します。
平均投稿あたりの視聴回数:投稿ごとの平均視聴回数を示します。
ご注意: 本調査は2025年の数値を2026年として表示しています。公開時点では年初につき、分析のための十分なデータがありませんでした。そのため、四半期ごとにアップデートを提供し、年の進行とともにより多くのデータをご覧いただけます。
Analyze your competitor's social profiles
Get insights on competitor's performance across channels and discover do's and don'ts!
リアルタイムのインサイトでソーシャルメディア戦略を強化しませんか?
戦略的なインサイトを獲得し、全チャネルのソーシャルパフォーマンスを分析します。異なる期間のメトリクスを比較し、レポートを数秒でダウンロードできます。