2026年LinkedInベンチマーク
最新のLinkedInベンチマークをチェックし、戦略を最適化するためのインサイトを取得できます。LinkedInでの存在感を高めましょう。

長年ソーシャルメディアデータを扱って学んだことが一つあります。それは、常に調整し続けなければ有効性を維持できないということです。ユーザーのコンテンツへのエンゲージメントの方法は日々進化しています。わずかな行動の変化でも、成果の見え方が毎年大きく変わります。
そのため、現在LinkedInで成功するには、これまで以上に戦略的で難易度が高くなっています。新たなチャンスの場所を把握するために、このLinkedInベンチマークレポートでは、エンゲージメント、インプレッション、投稿習慣、そしてオーディエンスの成長についての最新インサイトを提供します。
130万件のLinkedInビジネス投稿を分析したこのLinkedInベンチマークは、目標設定やコンテンツ戦略の強化に必要な明確な指針と背景を示します。競争が激化する中で、LinkedInでのインパクトを最大化するためにぜひご活用ください。
エグゼクティブサマリー
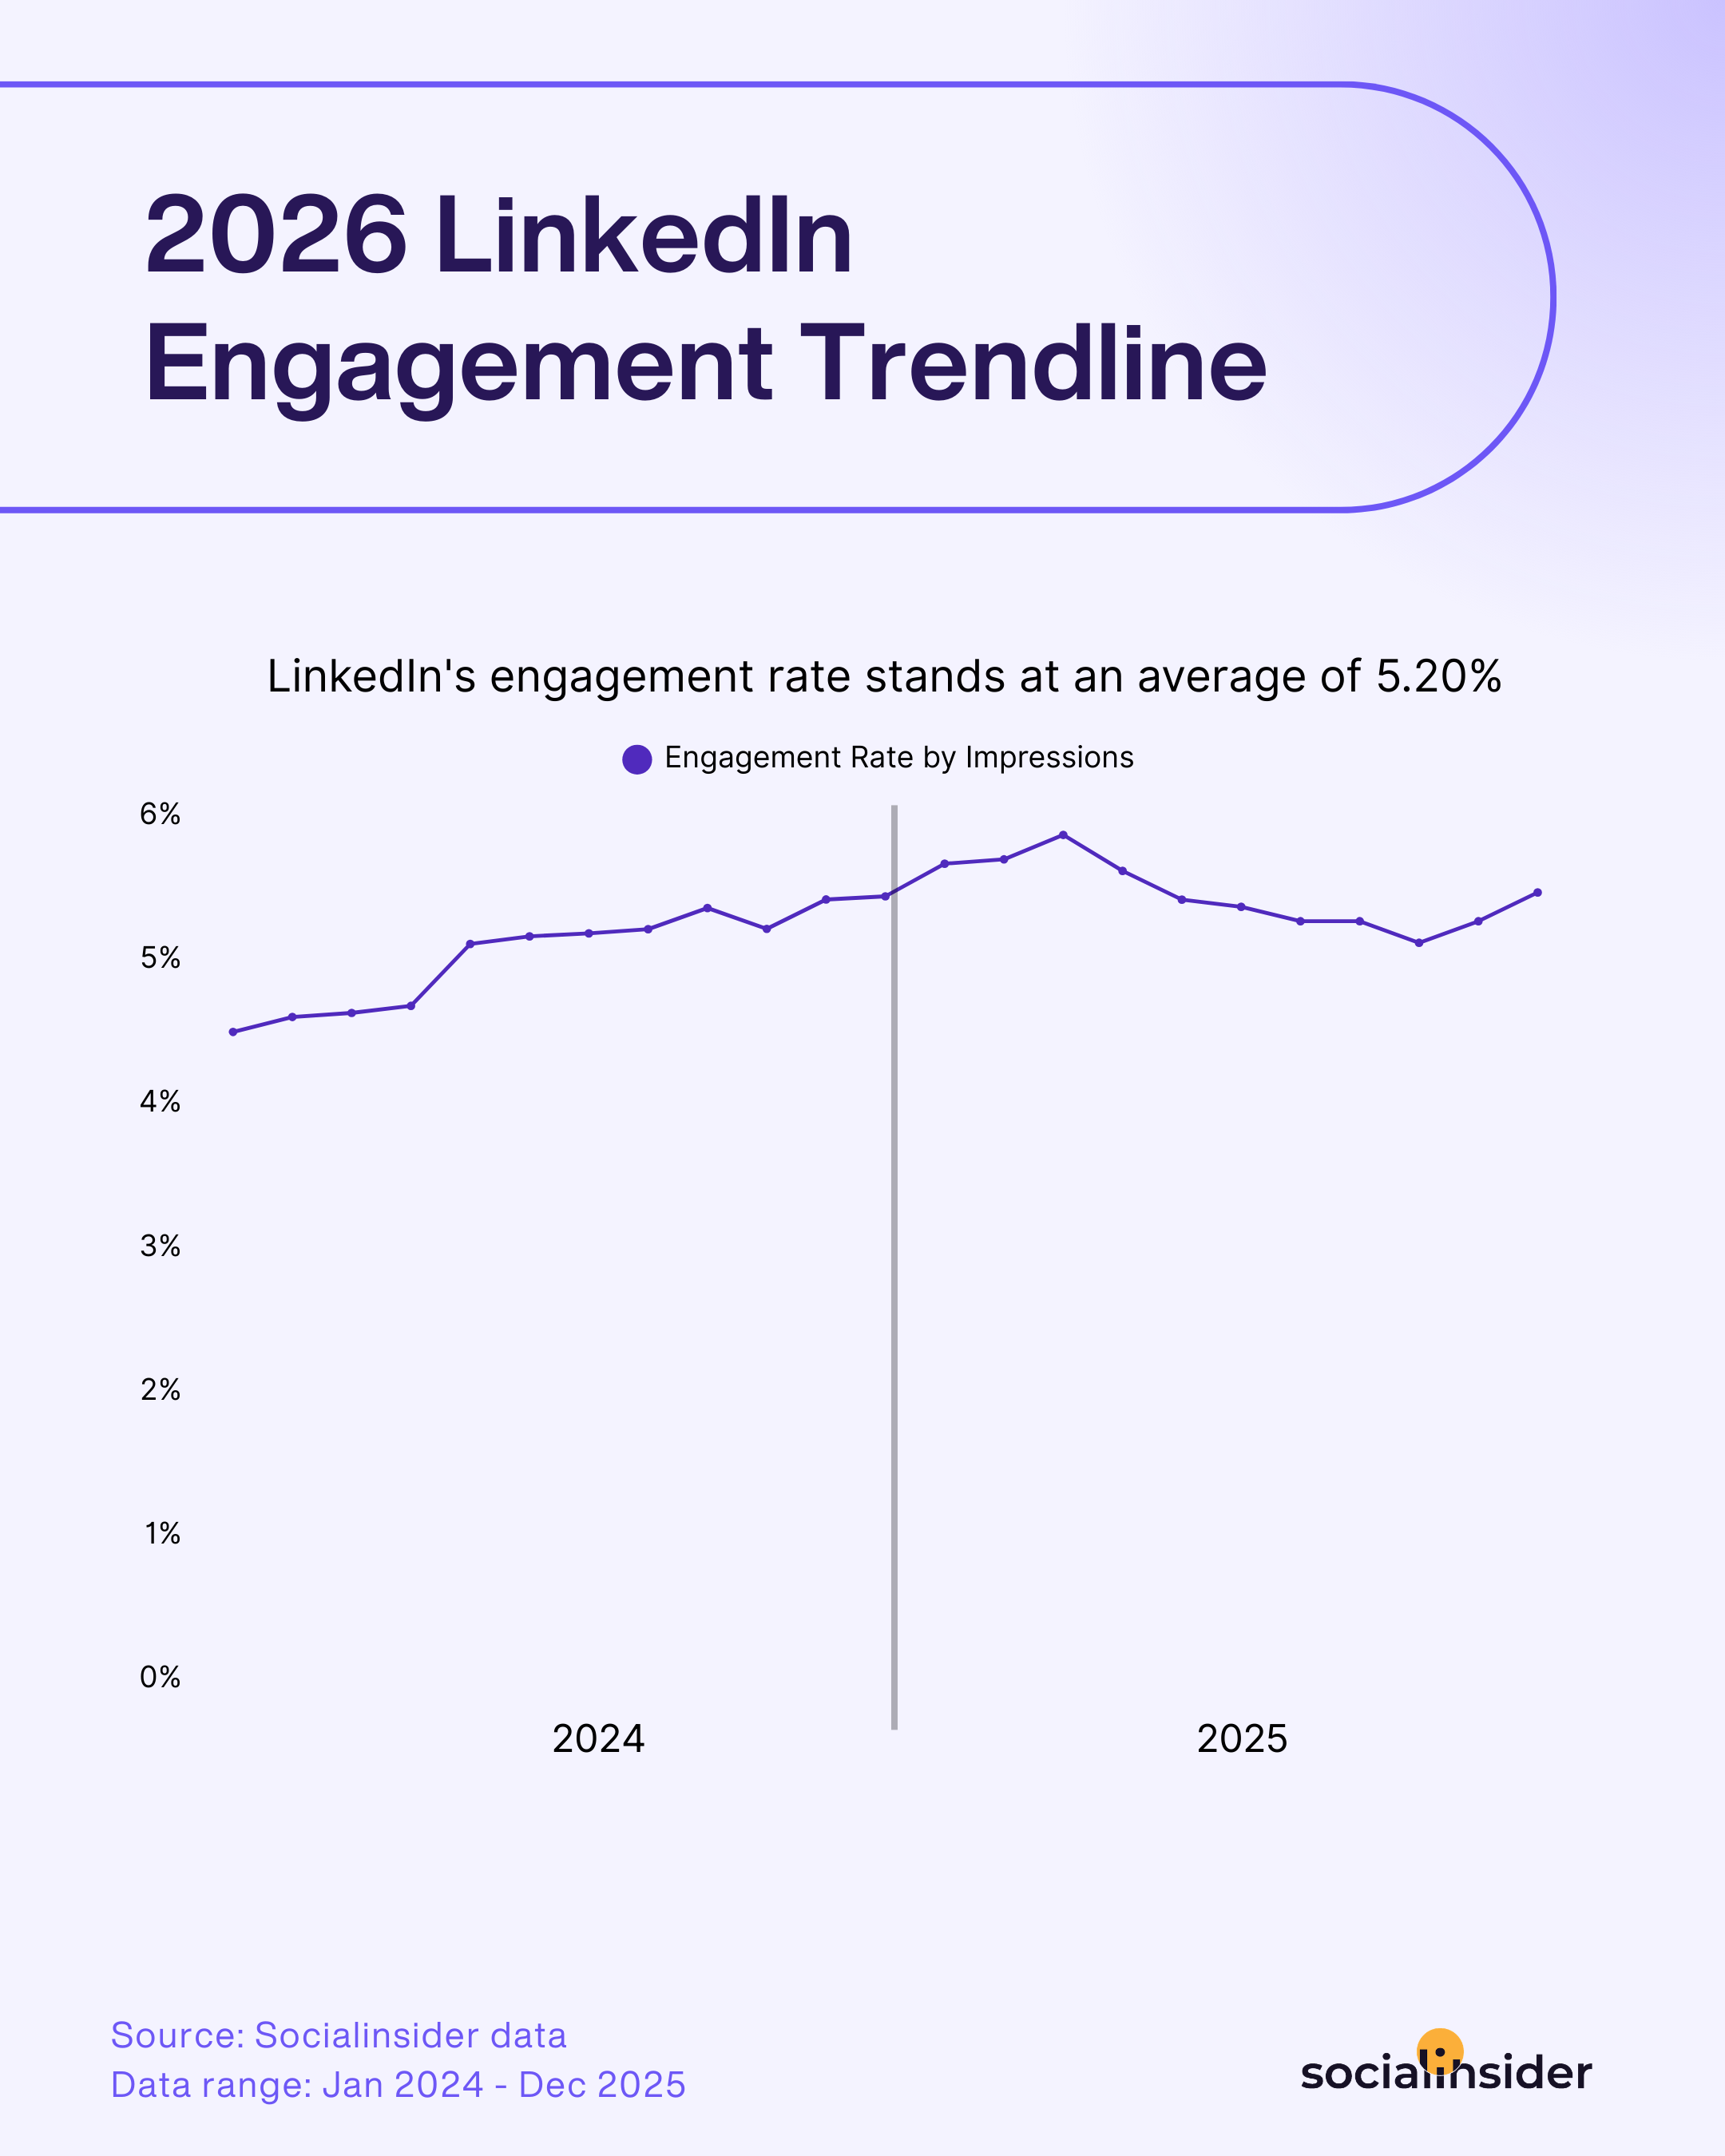
- 2026年、LinkedInのエンゲージメント率は平均5.20%です。前年比で8%増加しました。
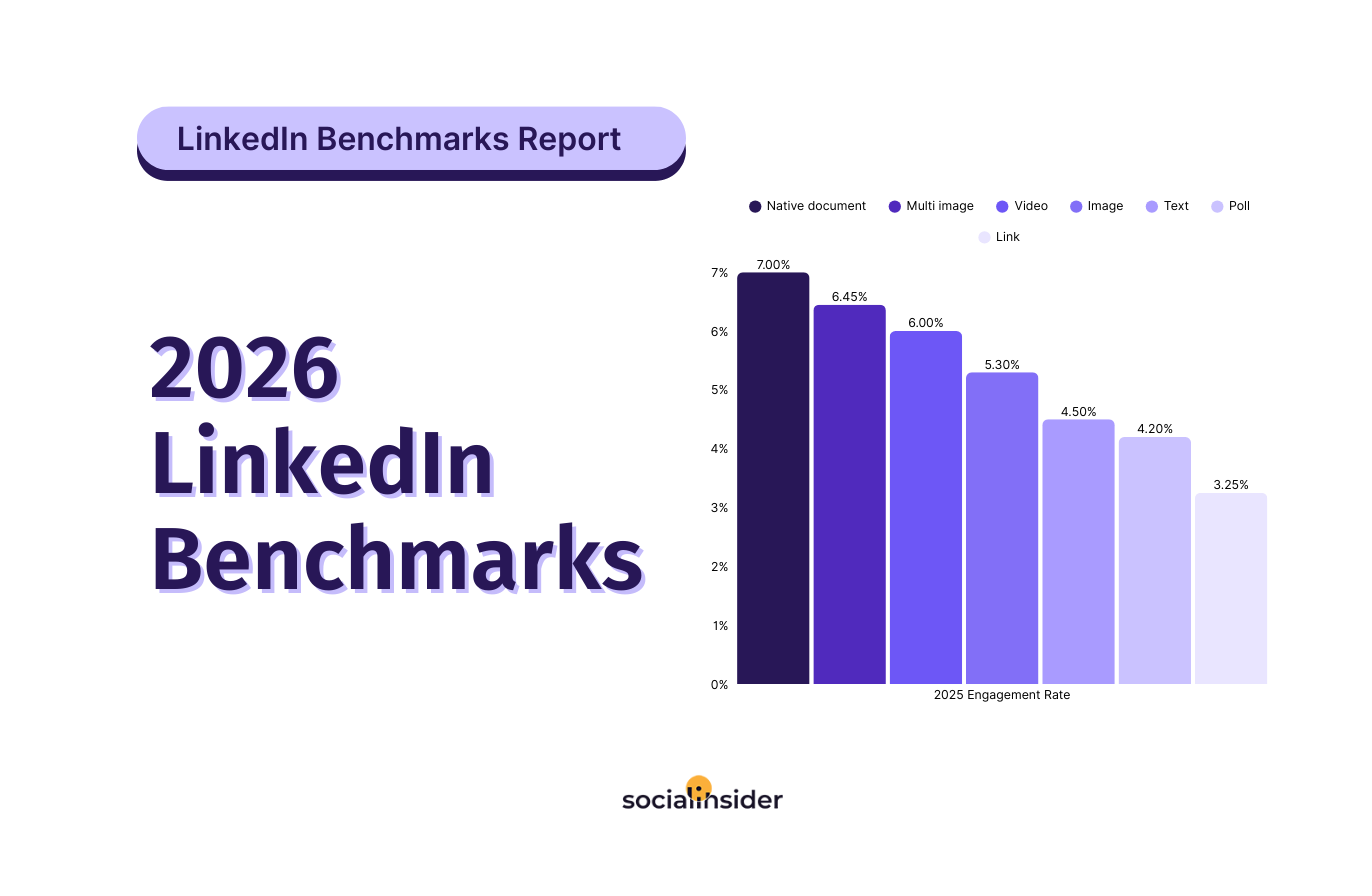
- ネイティブドキュメント形式はエンゲージメントでトップです。平均エンゲージメント率は7.00%、前年比で14%増加しています。
- すべてのフォーマットでエンゲージメントが増加しました。動画は+7%、画像は+9%、テキスト投稿は+12%です。
- 複数画像の投稿は全体的にいいね数を増やします。
- フォロワーが50,000人以上のページでは、インプレッションの点でポールのパフォーマンスが向上します。
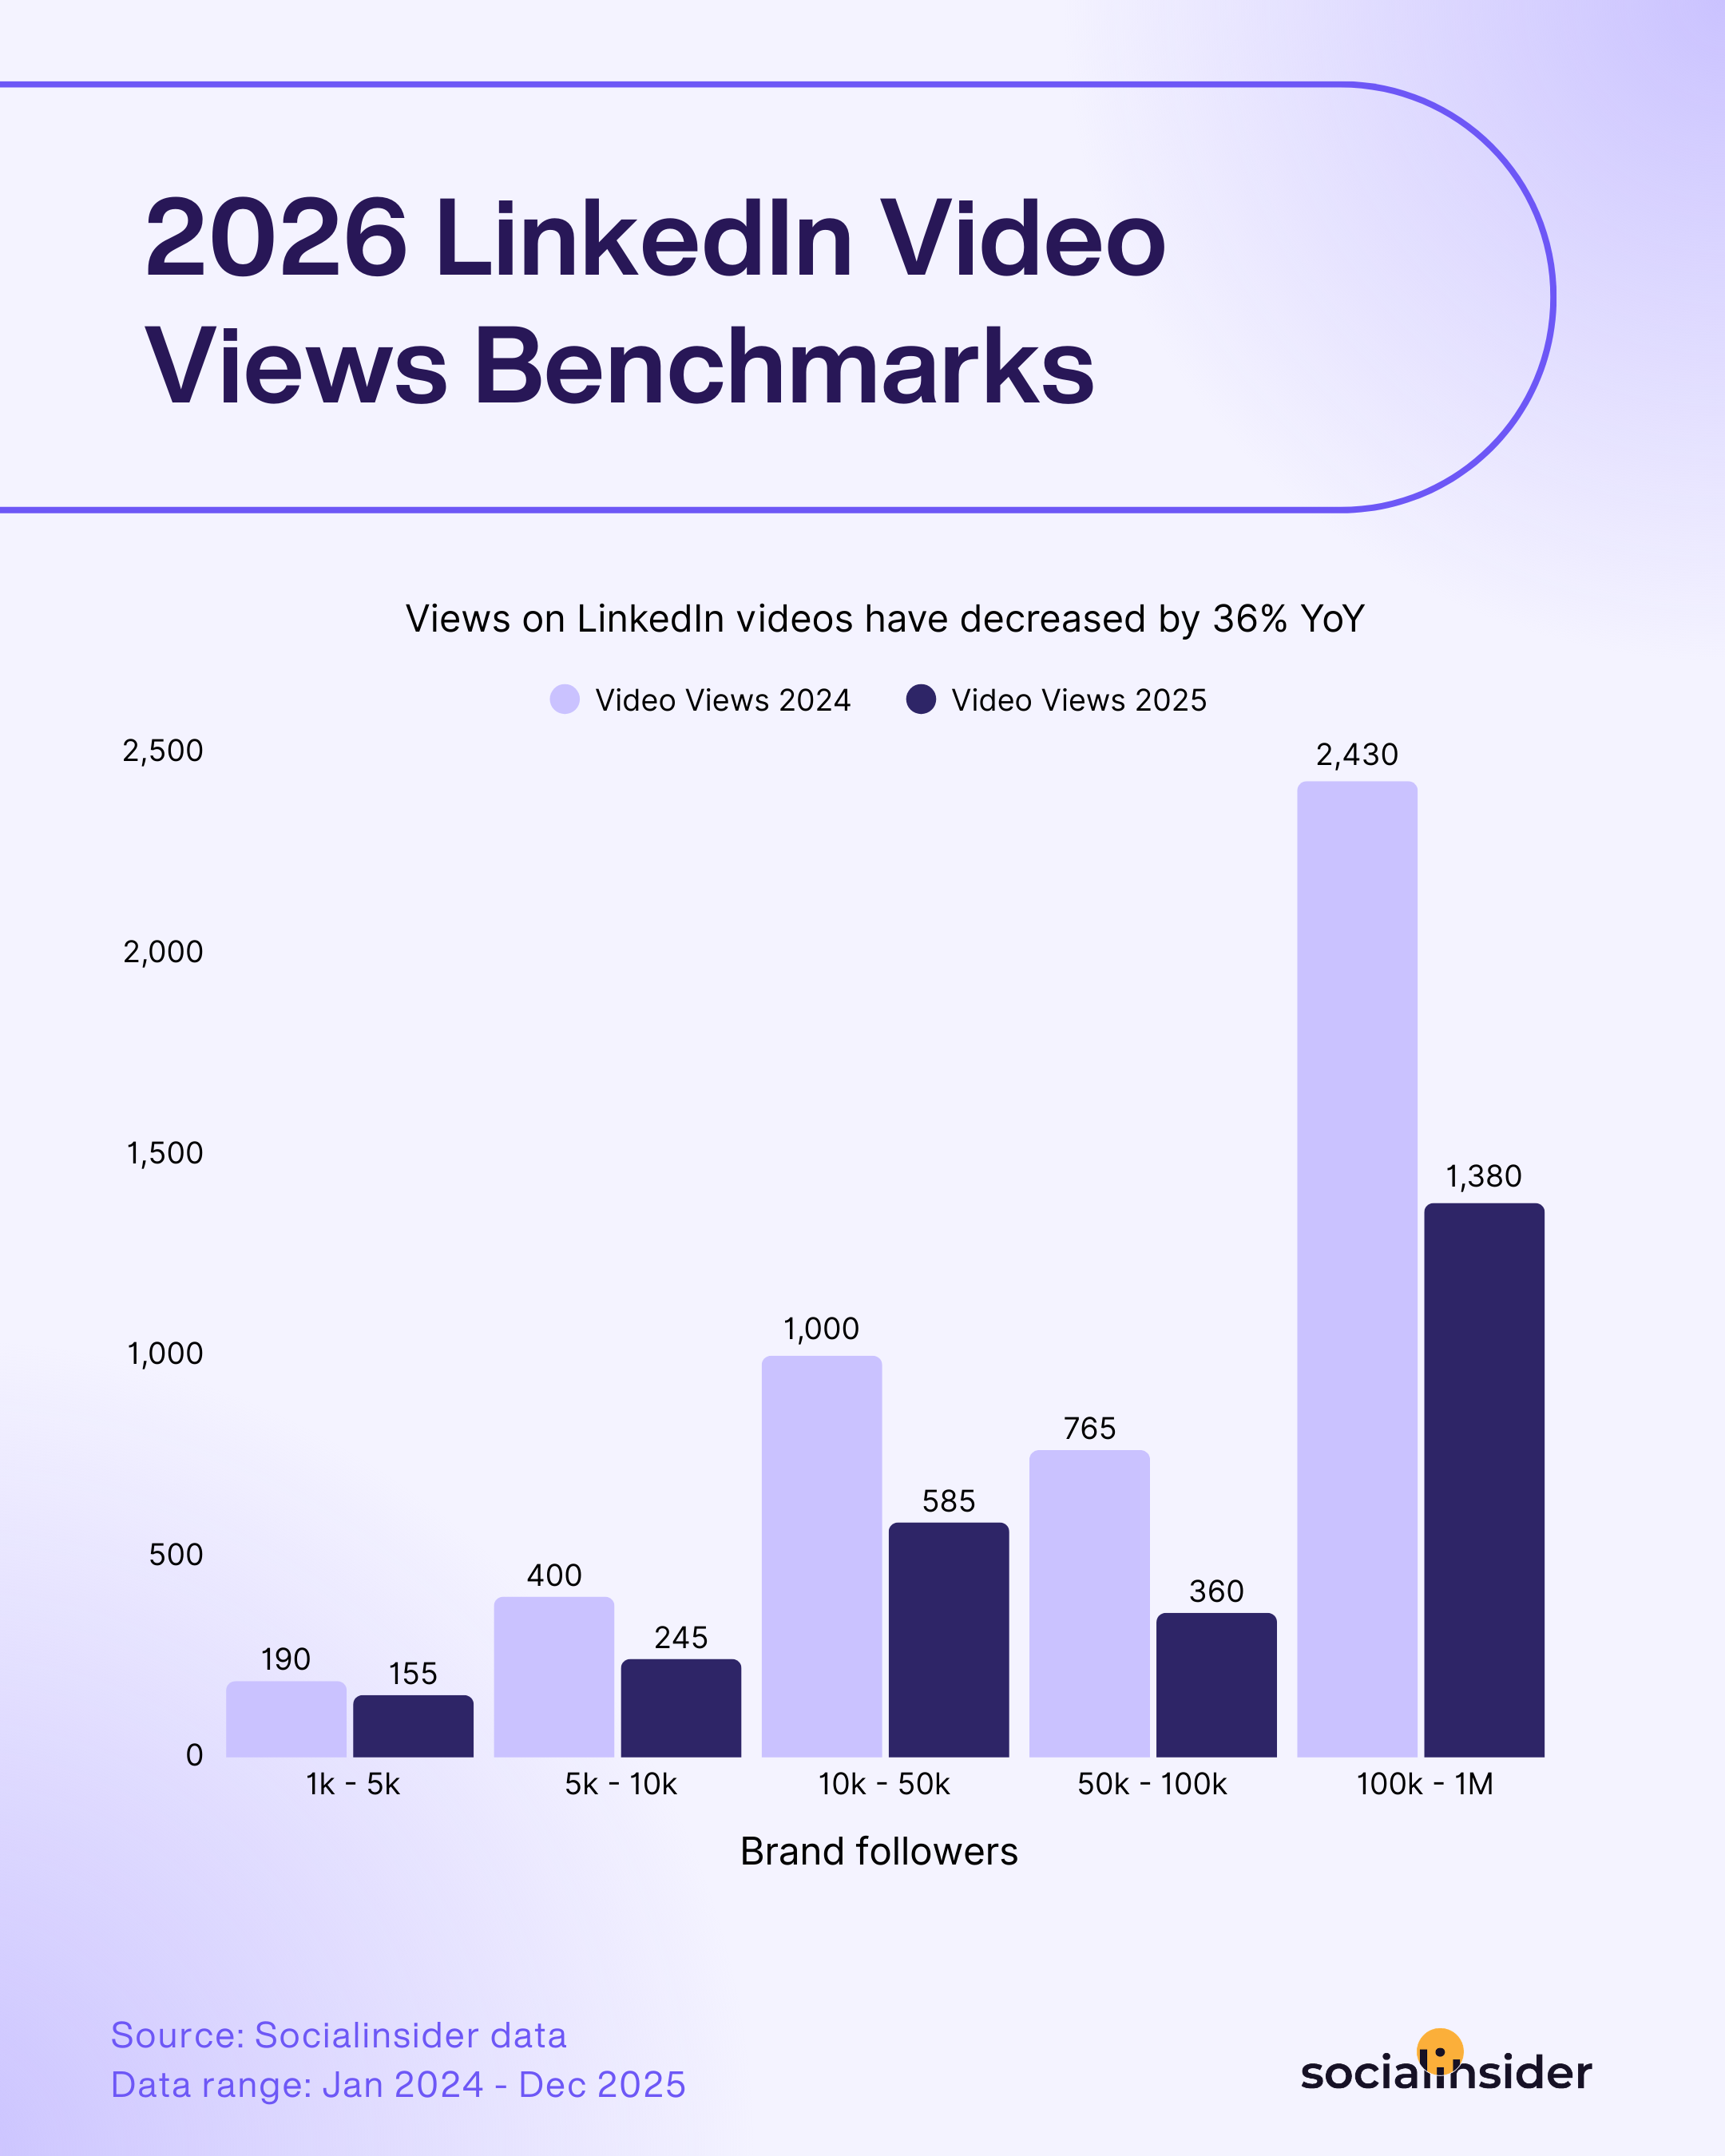
- 最大規模のLinkedInページは最も多くの動画視聴回数を生み出しています。しかし、全LinkedInページ全体では視聴回数が前年比36%減少しています。
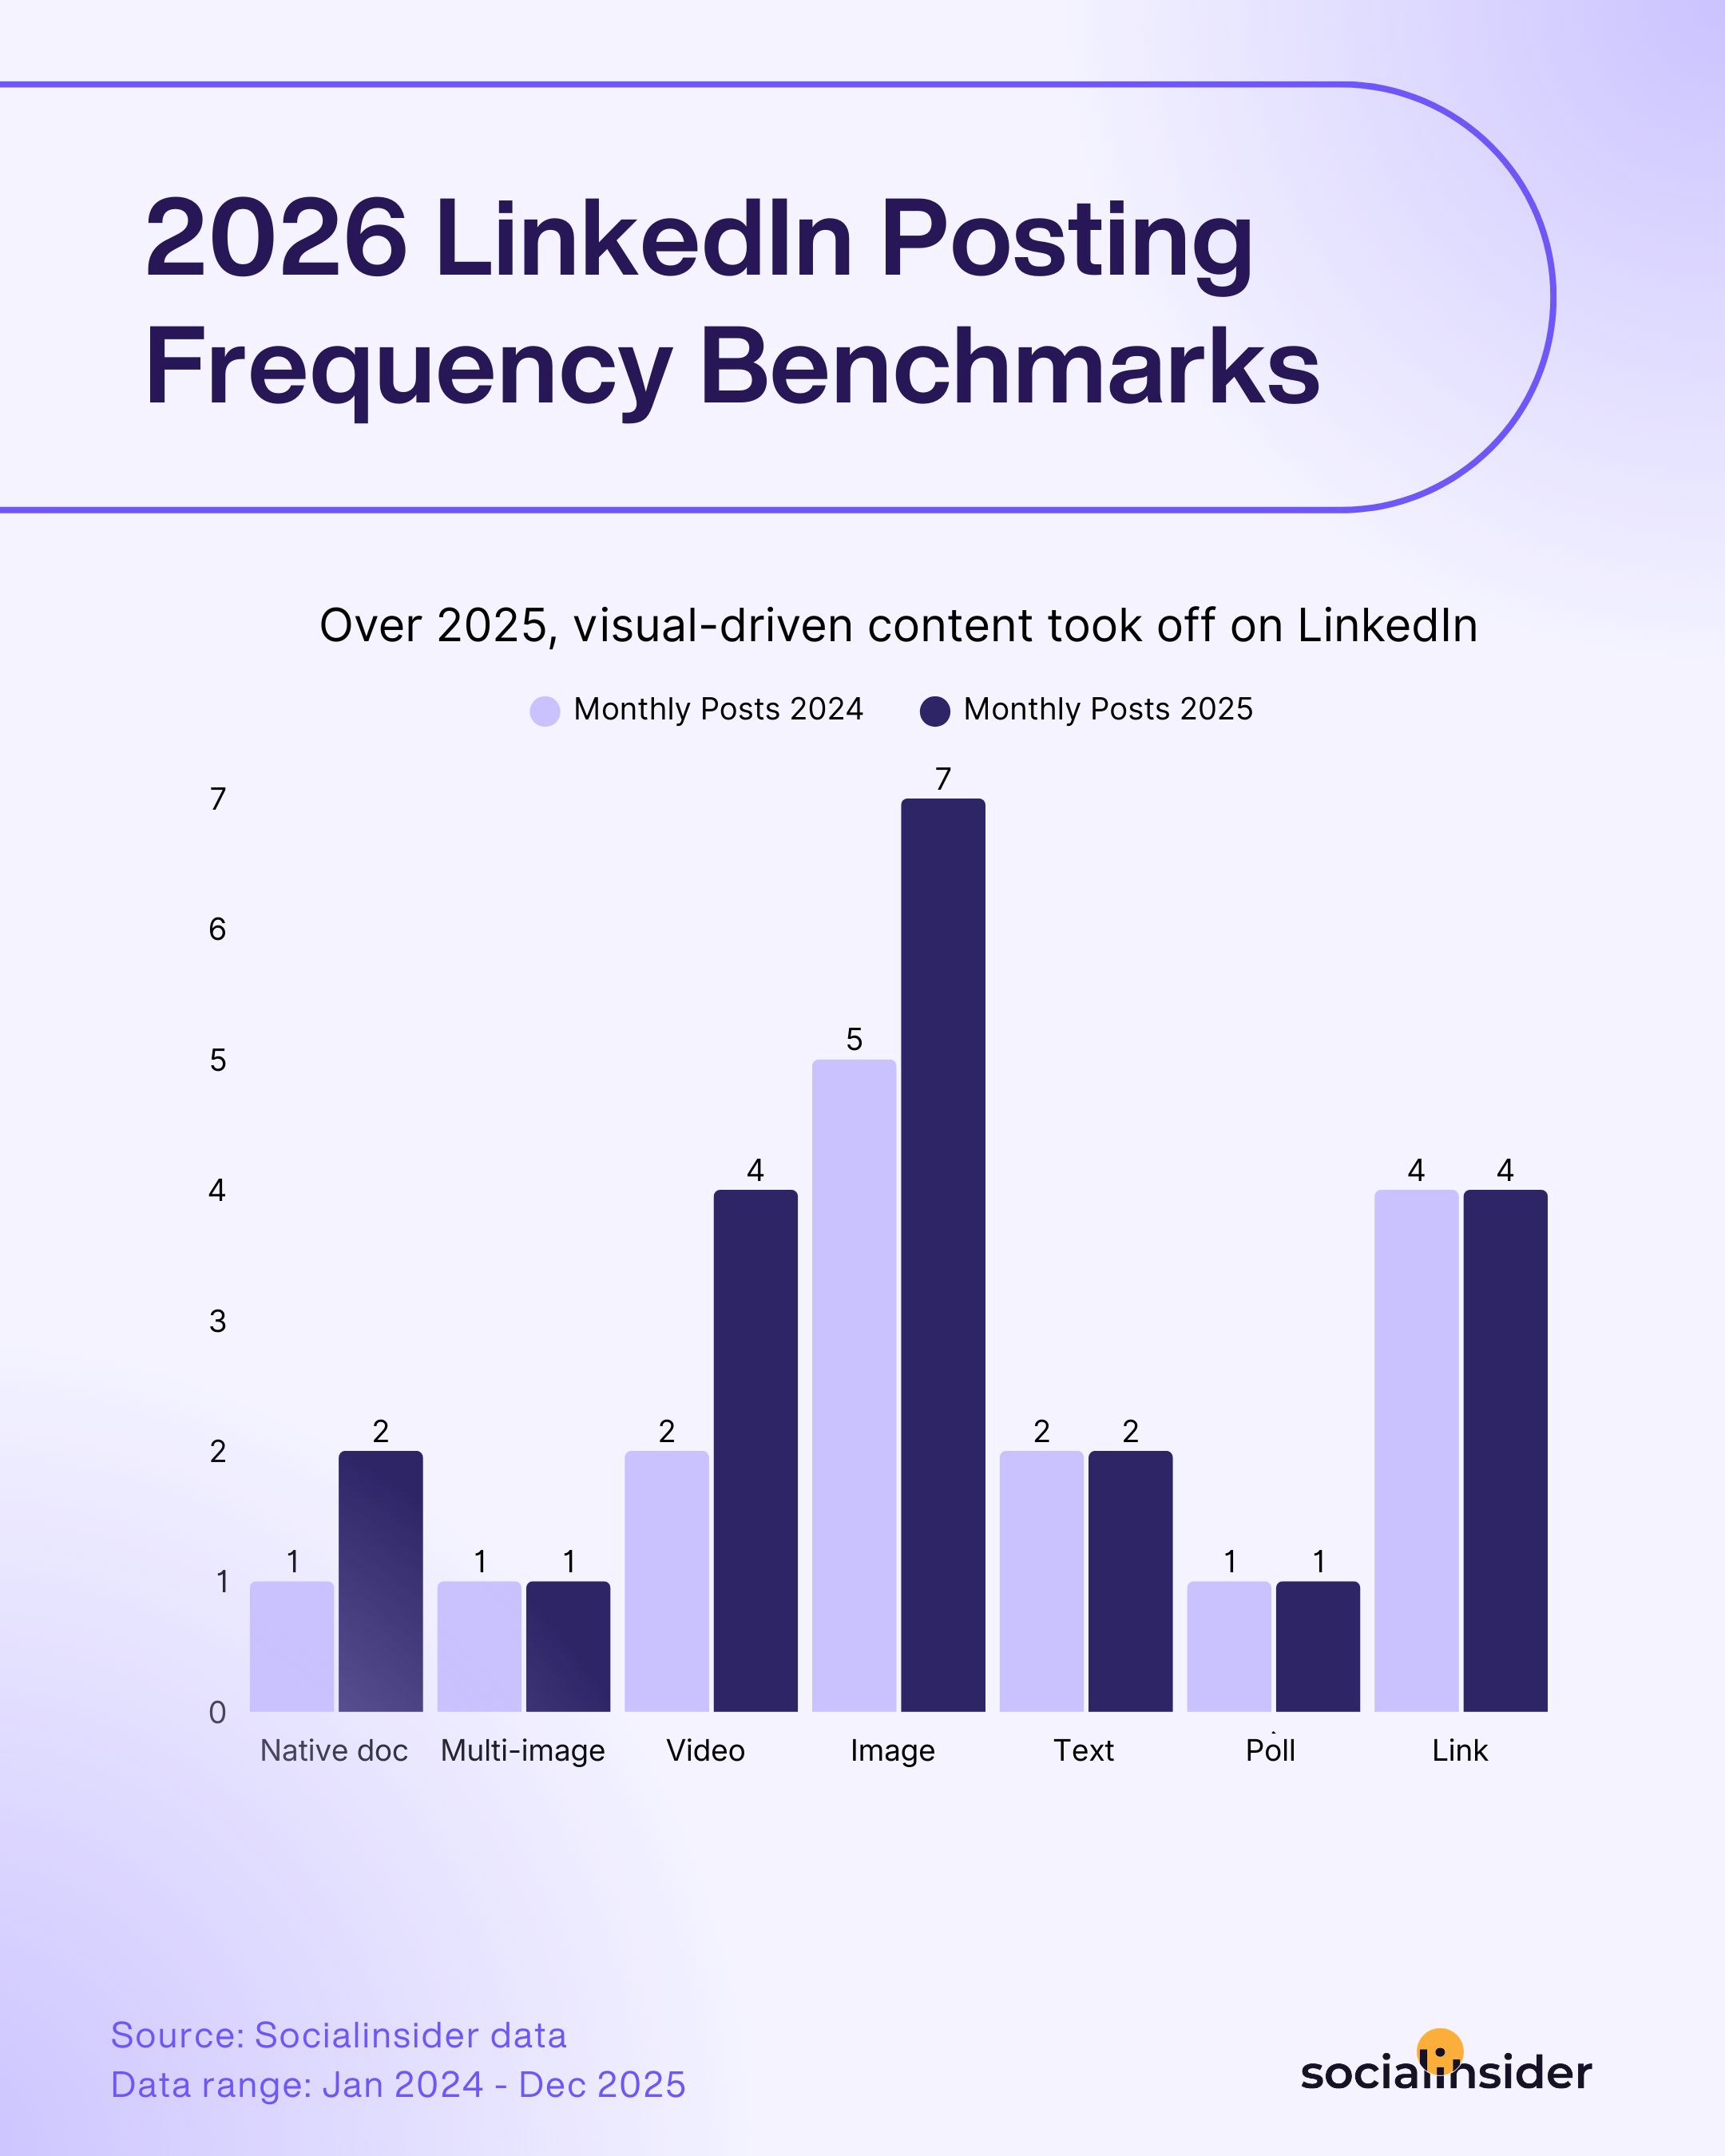
- 2025年を通じて、ブランドはビジュアル重視のコンテンツ形式での投稿頻度を増やしています。
- 2025年、LinkedInのオーディエンス成長率は鈍化しました。特に大規模アカウントで顕著です。
LinkedIn四半期ベンチマーク
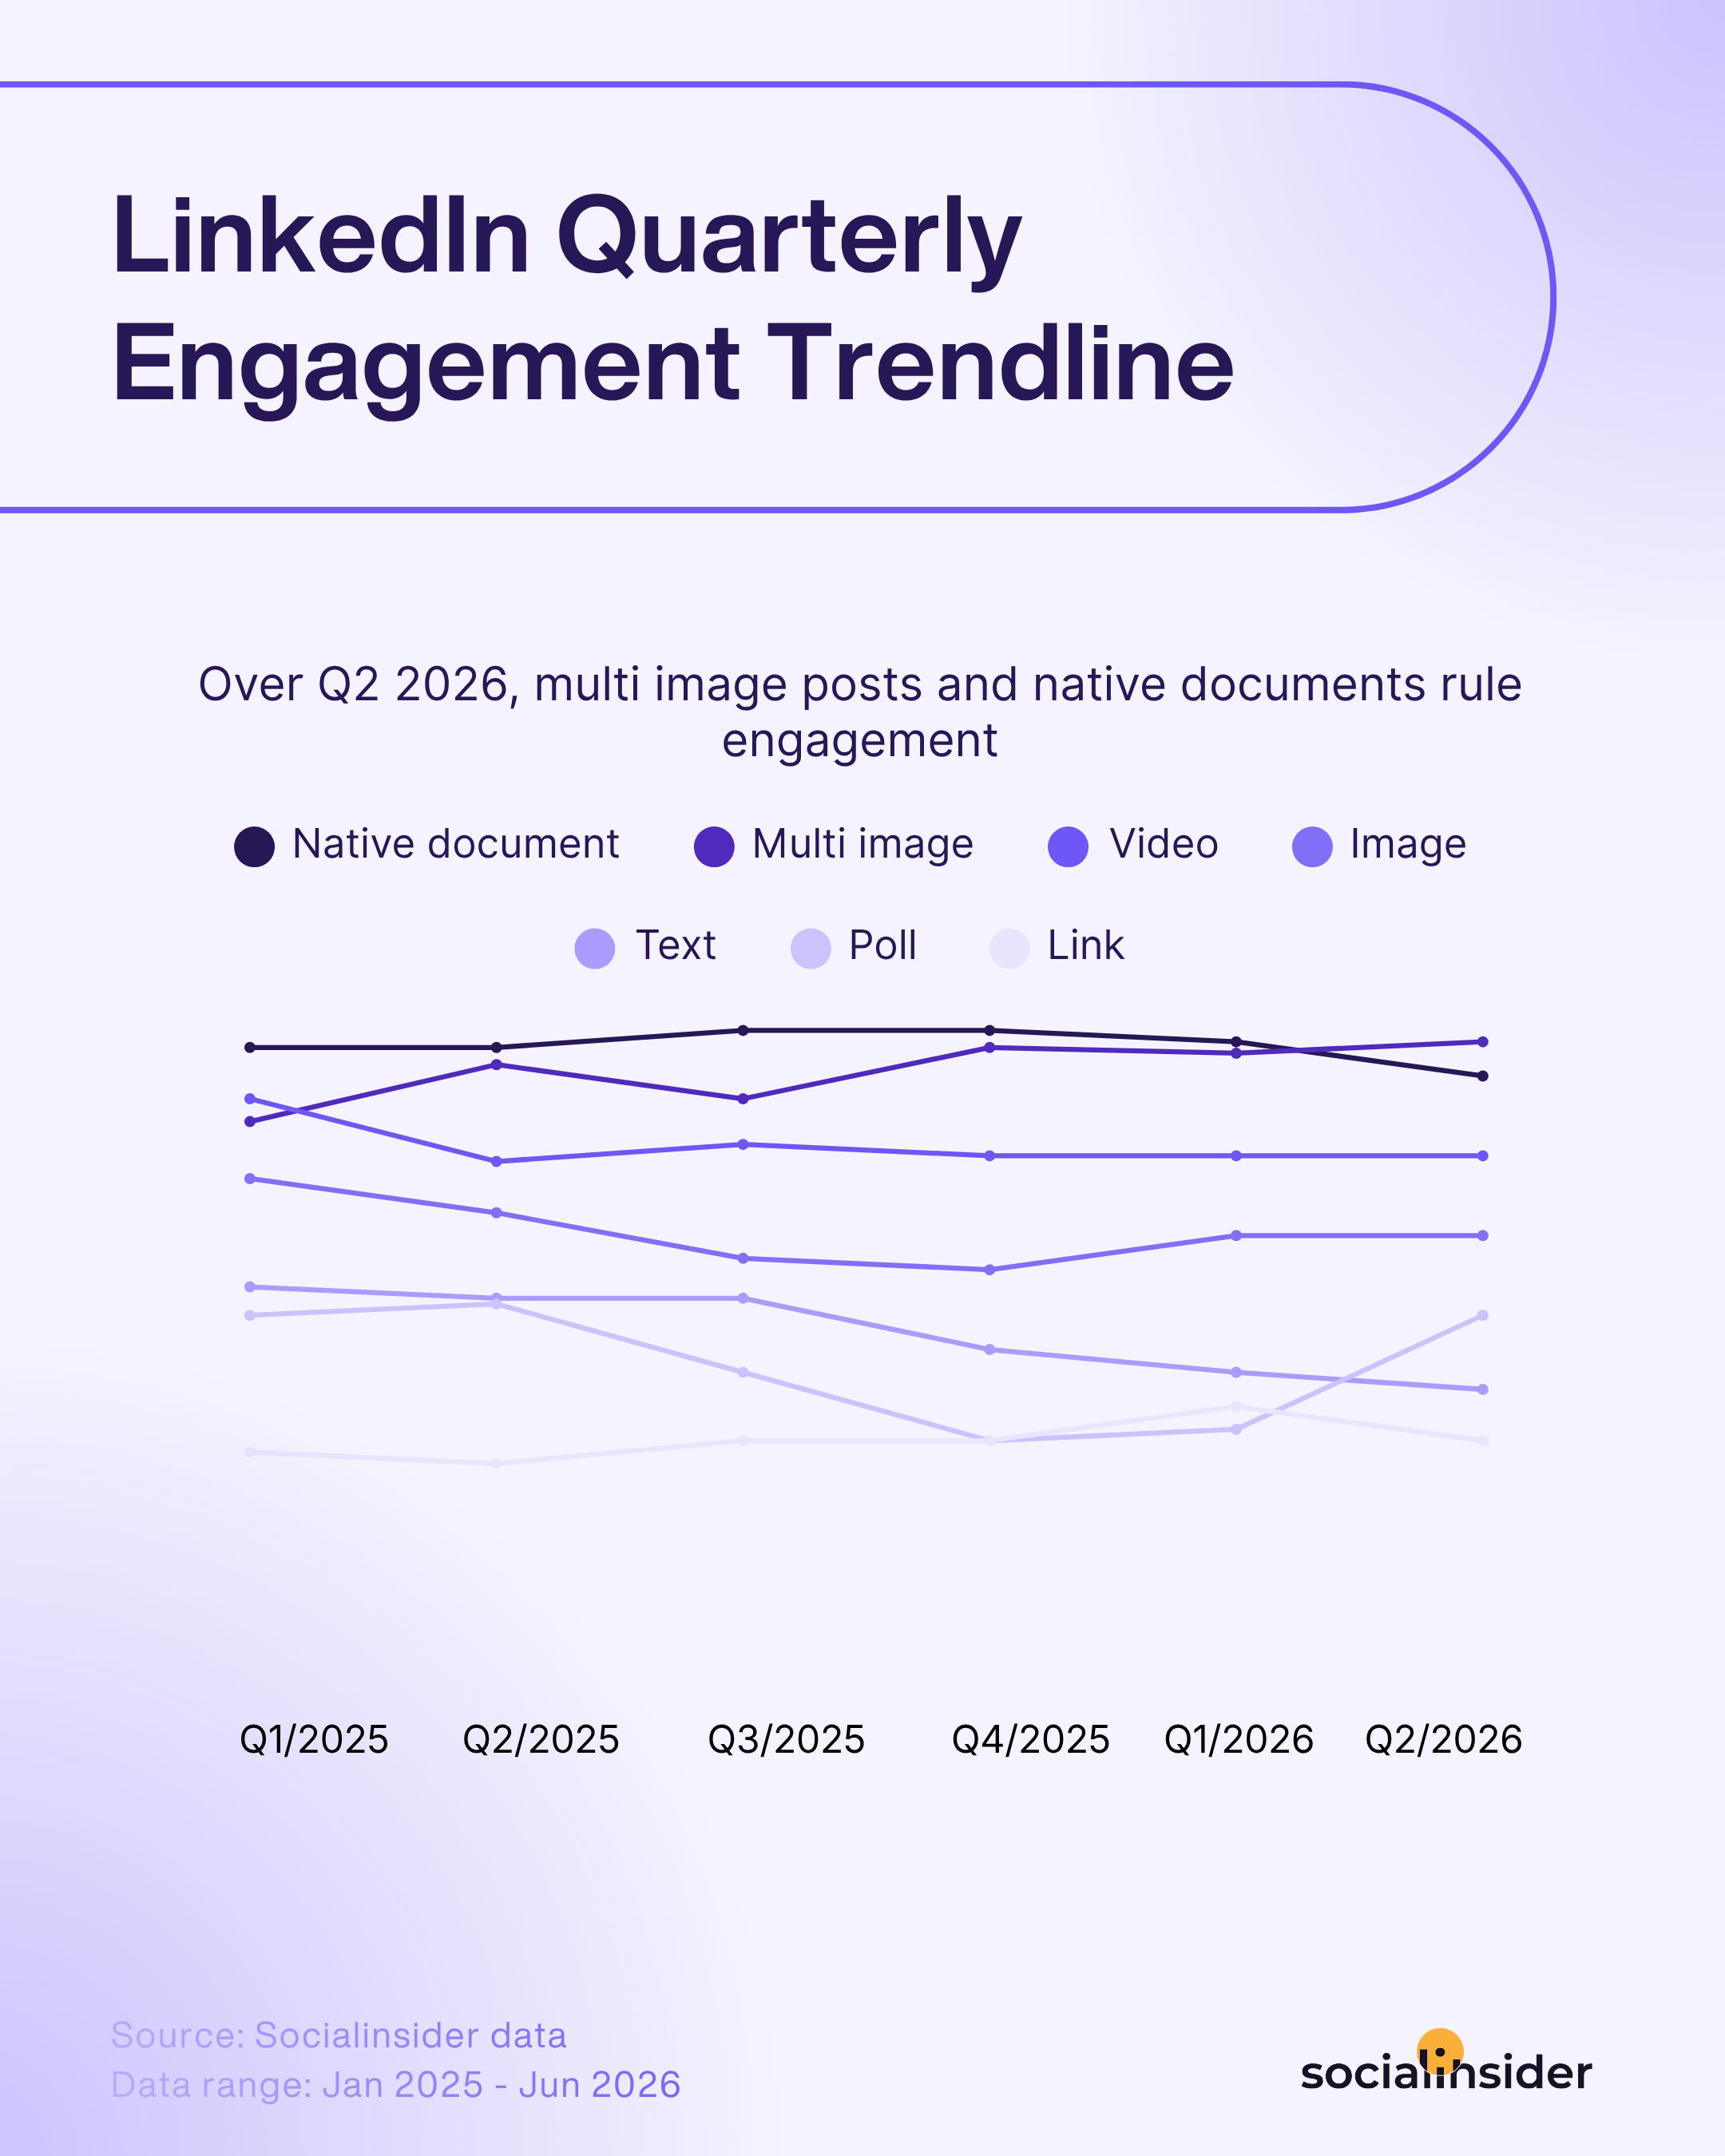
Overall, over the first half of 2026, engagement on LinkedIn remained mostly flat.
Looking at the Q2 2026 data, LinkedIn’s engagement landscape remained fairly stable overall, with most content formats seeing only minor fluctuations compared to previous quarters.
しばらくの間、ネイティブドキュメントやマルチ画像投稿は、他のすべてのコンテンツ形式を一貫して上回っています。LinkedInユーザーは、ストーリー性や価値が分かりやすく、インタラクティブに伝わるコンテンツに最もエンゲージメントしていることが強調されています。
教育系カルーセル、ステップごとのフレームワーク、業界インサイトやスライド形式の個人経験など、ユーザーはスライドしてじっくり読むことを促すコンテンツによりエンゲージメントしやすい傾向があります。
各コンテンツタイプのパフォーマンスに関して、データが明らかにした内容はこちらです。
- Multi-image posts: Multi-image posts maintained a high engagement rate in Q2 2026, climbing to 6.90% from 6.80% in the previous quarter.
- ネイティブドキュメント With an average engagement rate of 6.60%, Native documents remained one of the best-performing content formats on LinkedIn in Q2 2026, even though slipping slightly, to 6.60% from 6.90%.
- Video posts: Video content remained stable in Q2 2026, registering the same 5.90% engagement rate as in Q1.
- 画像投稿: For Image posts, engagement rate remained flat, registering the same average of 5.20%.
- テキスト投稿 Text-only posts registered a more significant decline, reaching a 3.95% average engagement rate in Q2.
- 投票投稿 Polls remained one of the weaker-performing content formats on LinkedIn, although registering a significant growth, from 3.50% average engagement rate in Q1 to 4.50% in Q2 2026.
- リンク投稿: Performance for link posts has decreased slightly, going from 3.70% to 3.30% average Linkedin engagement rate.
LinkedInインプレッション別エンゲージメントのベンチマーク
マーケティングの世界で働いて感じることが一つあります。それは、変化がとても早いということです。私たちが使うプラットフォームや、コンテンツへの人々の関わり方も常に進化しています。
時折、ソーシャルプラットフォームは新しいトレンドやベストプラクティスで私たちを驚かせます。そのたびに、“効果的”だと思っていたエンゲージメントの常識が塗り替えられます。
今年のLinkedInエンゲージメントベンチマークを見ると、特に明確なトレンドが一つ浮かび上がります。オーディエンスはこれまで以上に中身と深みを求めています。では、ひとつずつトレンドを見ていきましょう。
まず前提として、LinkedIn全体の平均エンゲージメント率は現在5.20%です。これを参考に、どのフォーマットや戦略が基準を上回るのか見ていきます。
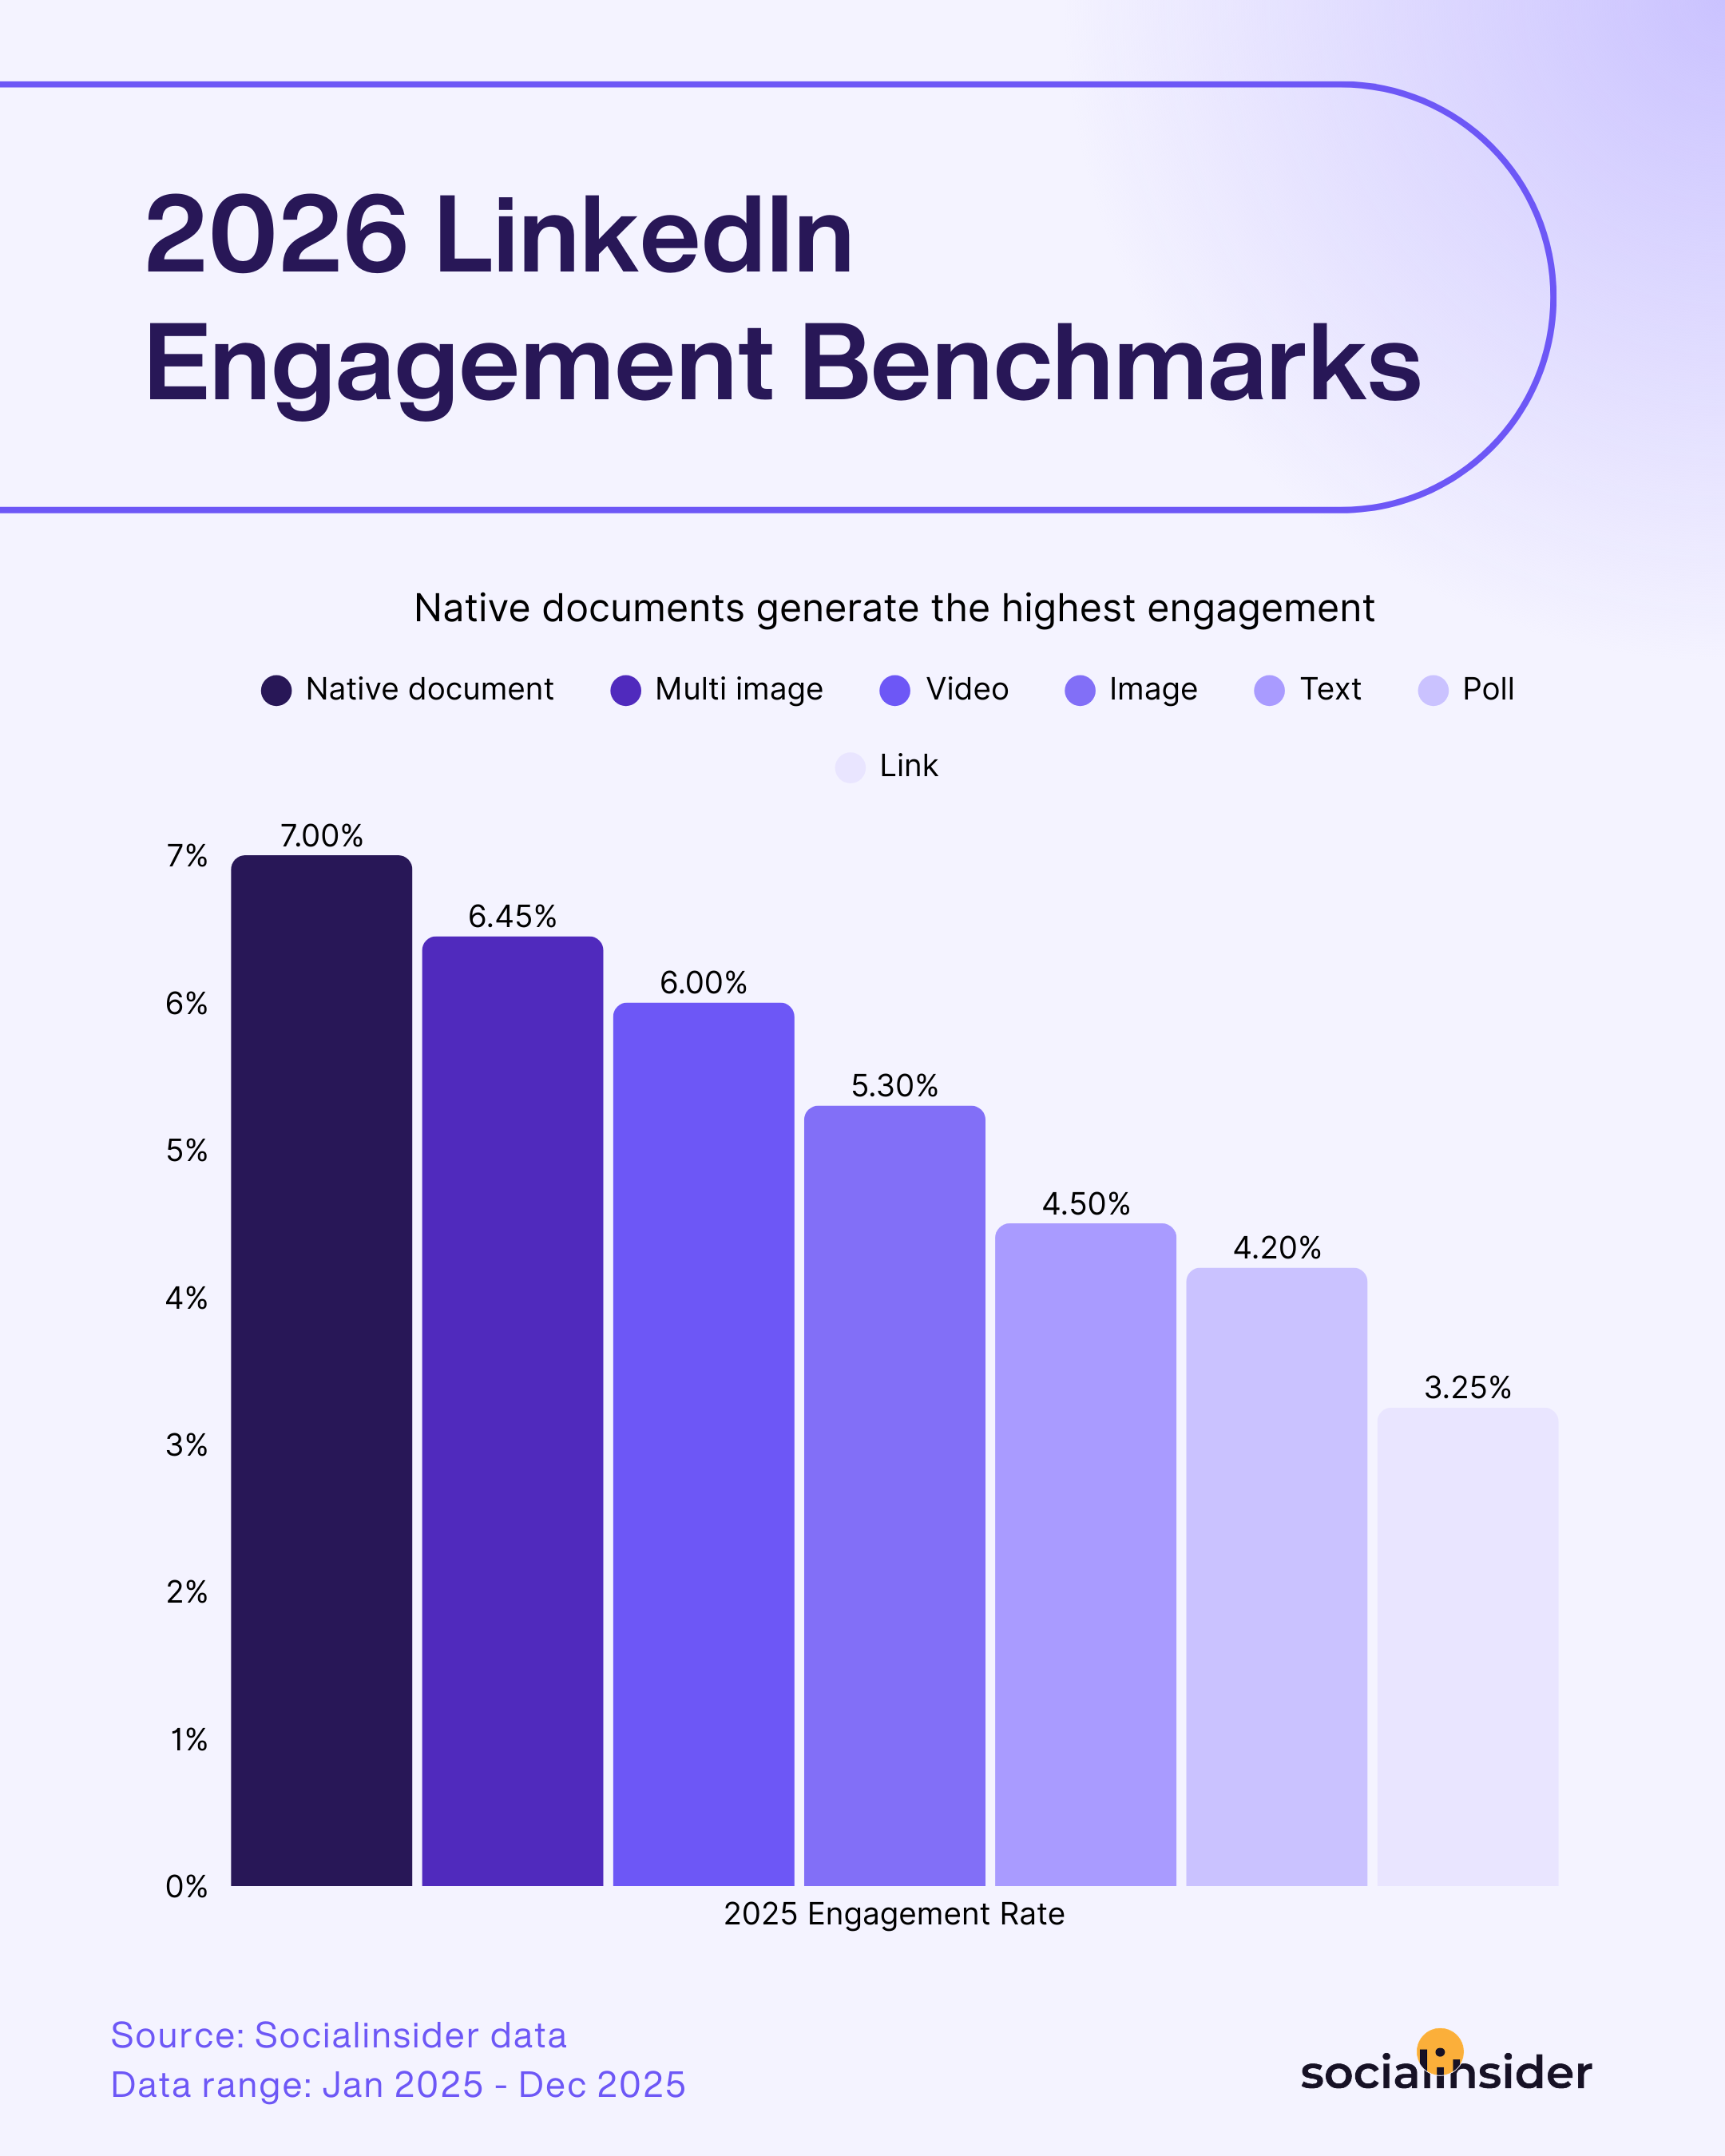
When looking at the top-performing content format on LinkedIn, native documents have pulled ahead to claim the top spot, scoring a LinkedIn average engagement rate of 7.00%, and a 14% YoY increase in performance.
ドキュメント投稿が好調な理由は、「無料価値」として機能し、学びたい人が積極的に集まるプラットフォームだからです。LinkedInは、実用的な持ち帰り(レポート、フレームワーク、テンプレートなど)を本気で探しているオーディエンスがいる数少ないソーシャルメディアです。ドキュメントはダウンロード可能なので特に有効です。保存して後から実際に使える(テンプレートやチェックリスト、フレームワークなど)点も魅力です。ユーザーフレンドリーで、カルーセル形式なら簡単に内容を確認できます。 — Julia Holmqvist、ソーシャルメディアマネージャー、Semrush
つまり、ここでの重要なポイントは何でしょうか?オリジナルのリソースや調査、ガイドを共有するブランドやプロに、ユーザーが高く評価しているということです。
さらに特に興味深いのは、LinkedInの平均エンゲージメント率が他のコンテンツ形式でも上昇していることです。動画、画像、シンプルなテキスト投稿でもリアクションが増加。それぞれ7%、9%、12%増となっています。
LinkedInでエンゲージメントが増加している理由は、このプラットフォームが純粋なビジネスネットワークから、学びや議論、個人ブランドの構築が活発に行われる幅広いコンテンツエコシステムへと進化してきたからです。同時に、多くのクリエイターやブランドがLinkedInを主要な配信チャネルとし、ネイティブなストーリーテリングや動画、ニュースレターに投資しています。これにより、ユーザーがプラットフォーム内にとどまり、より頻繁な交流が生まれています。 — Dylan Patel、ソーシャルメディア管理責任者、Born Social
Strategic tactics to increase engagement on LinkedIn
- 戦略をよりネイティブドキュメントにシフトしましょう。 Share timely updates, commentary on industry news, or emerging best practices to spark discussion and signal thought leadership—prompting more users to engage with your content.
- 実際の成果や成功事例を強調しましょう。 クライアントの声や事例、プロジェクトの成果を共有し、インパクトを証明します。信頼構築にもつながります。コメントや体験のシェアも促しましょう。
- アナリティクスを活用して長期的な成功を目指しましょう: あなたのオーディエンスでエンゲージメントが増加しているフォーマットを監視し、トレンドが変化する前に最大の関心をキャッチできるよう、コンテンツカレンダーを柔軟に調整してください。
LinkedInでエンゲージメント向上に貢献していると感じるコンテンツは、飾らない舞台裏のような投稿です。私たちは、3~6分ほどの横長クリップを投稿し、仕事の進め方やフレームワークをシンプルに紹介しています。シンプルで役立つ情報を、いわゆる“インフルエンサー風”ではない形で提供すると、エンゲージメントが非常に高くなります。 — Ian Evans、ソーシャルメディアマネージャー、tl;dv
LinkedInの平均いいね数/投稿
今年のSocialinsider LinkedInデータで明確に際立つトレンドは、効果的なエンゲージメントを生み出す万能な方法は存在しないということです。むしろ、コンテンツフォーマットの多様性が、さまざまなインタラクションでパフォーマンス最大化の鍵となります。
ブランドは、複数のフォーマットでコンテンツを継続的に再活用することを恐れるべきではありません。たとえば、人気の動画やブログ、その他のアイデアをカルーセルドキュメント形式でシェアするのもおすすめです。もちろん、一つの形式に依存せず、動画やテキストのみの投稿など、さまざまなクリエイティブフォーマットも併用しましょう。また、ドキュメント/カルーセル形式用のテンプレートを作成し、制作工程を効率化することも重要です。 — Casey Smith、シニアソーシャルメディアマネージャー、Slack
少し詳しく見てみましょう。データから次のことが分かりました。
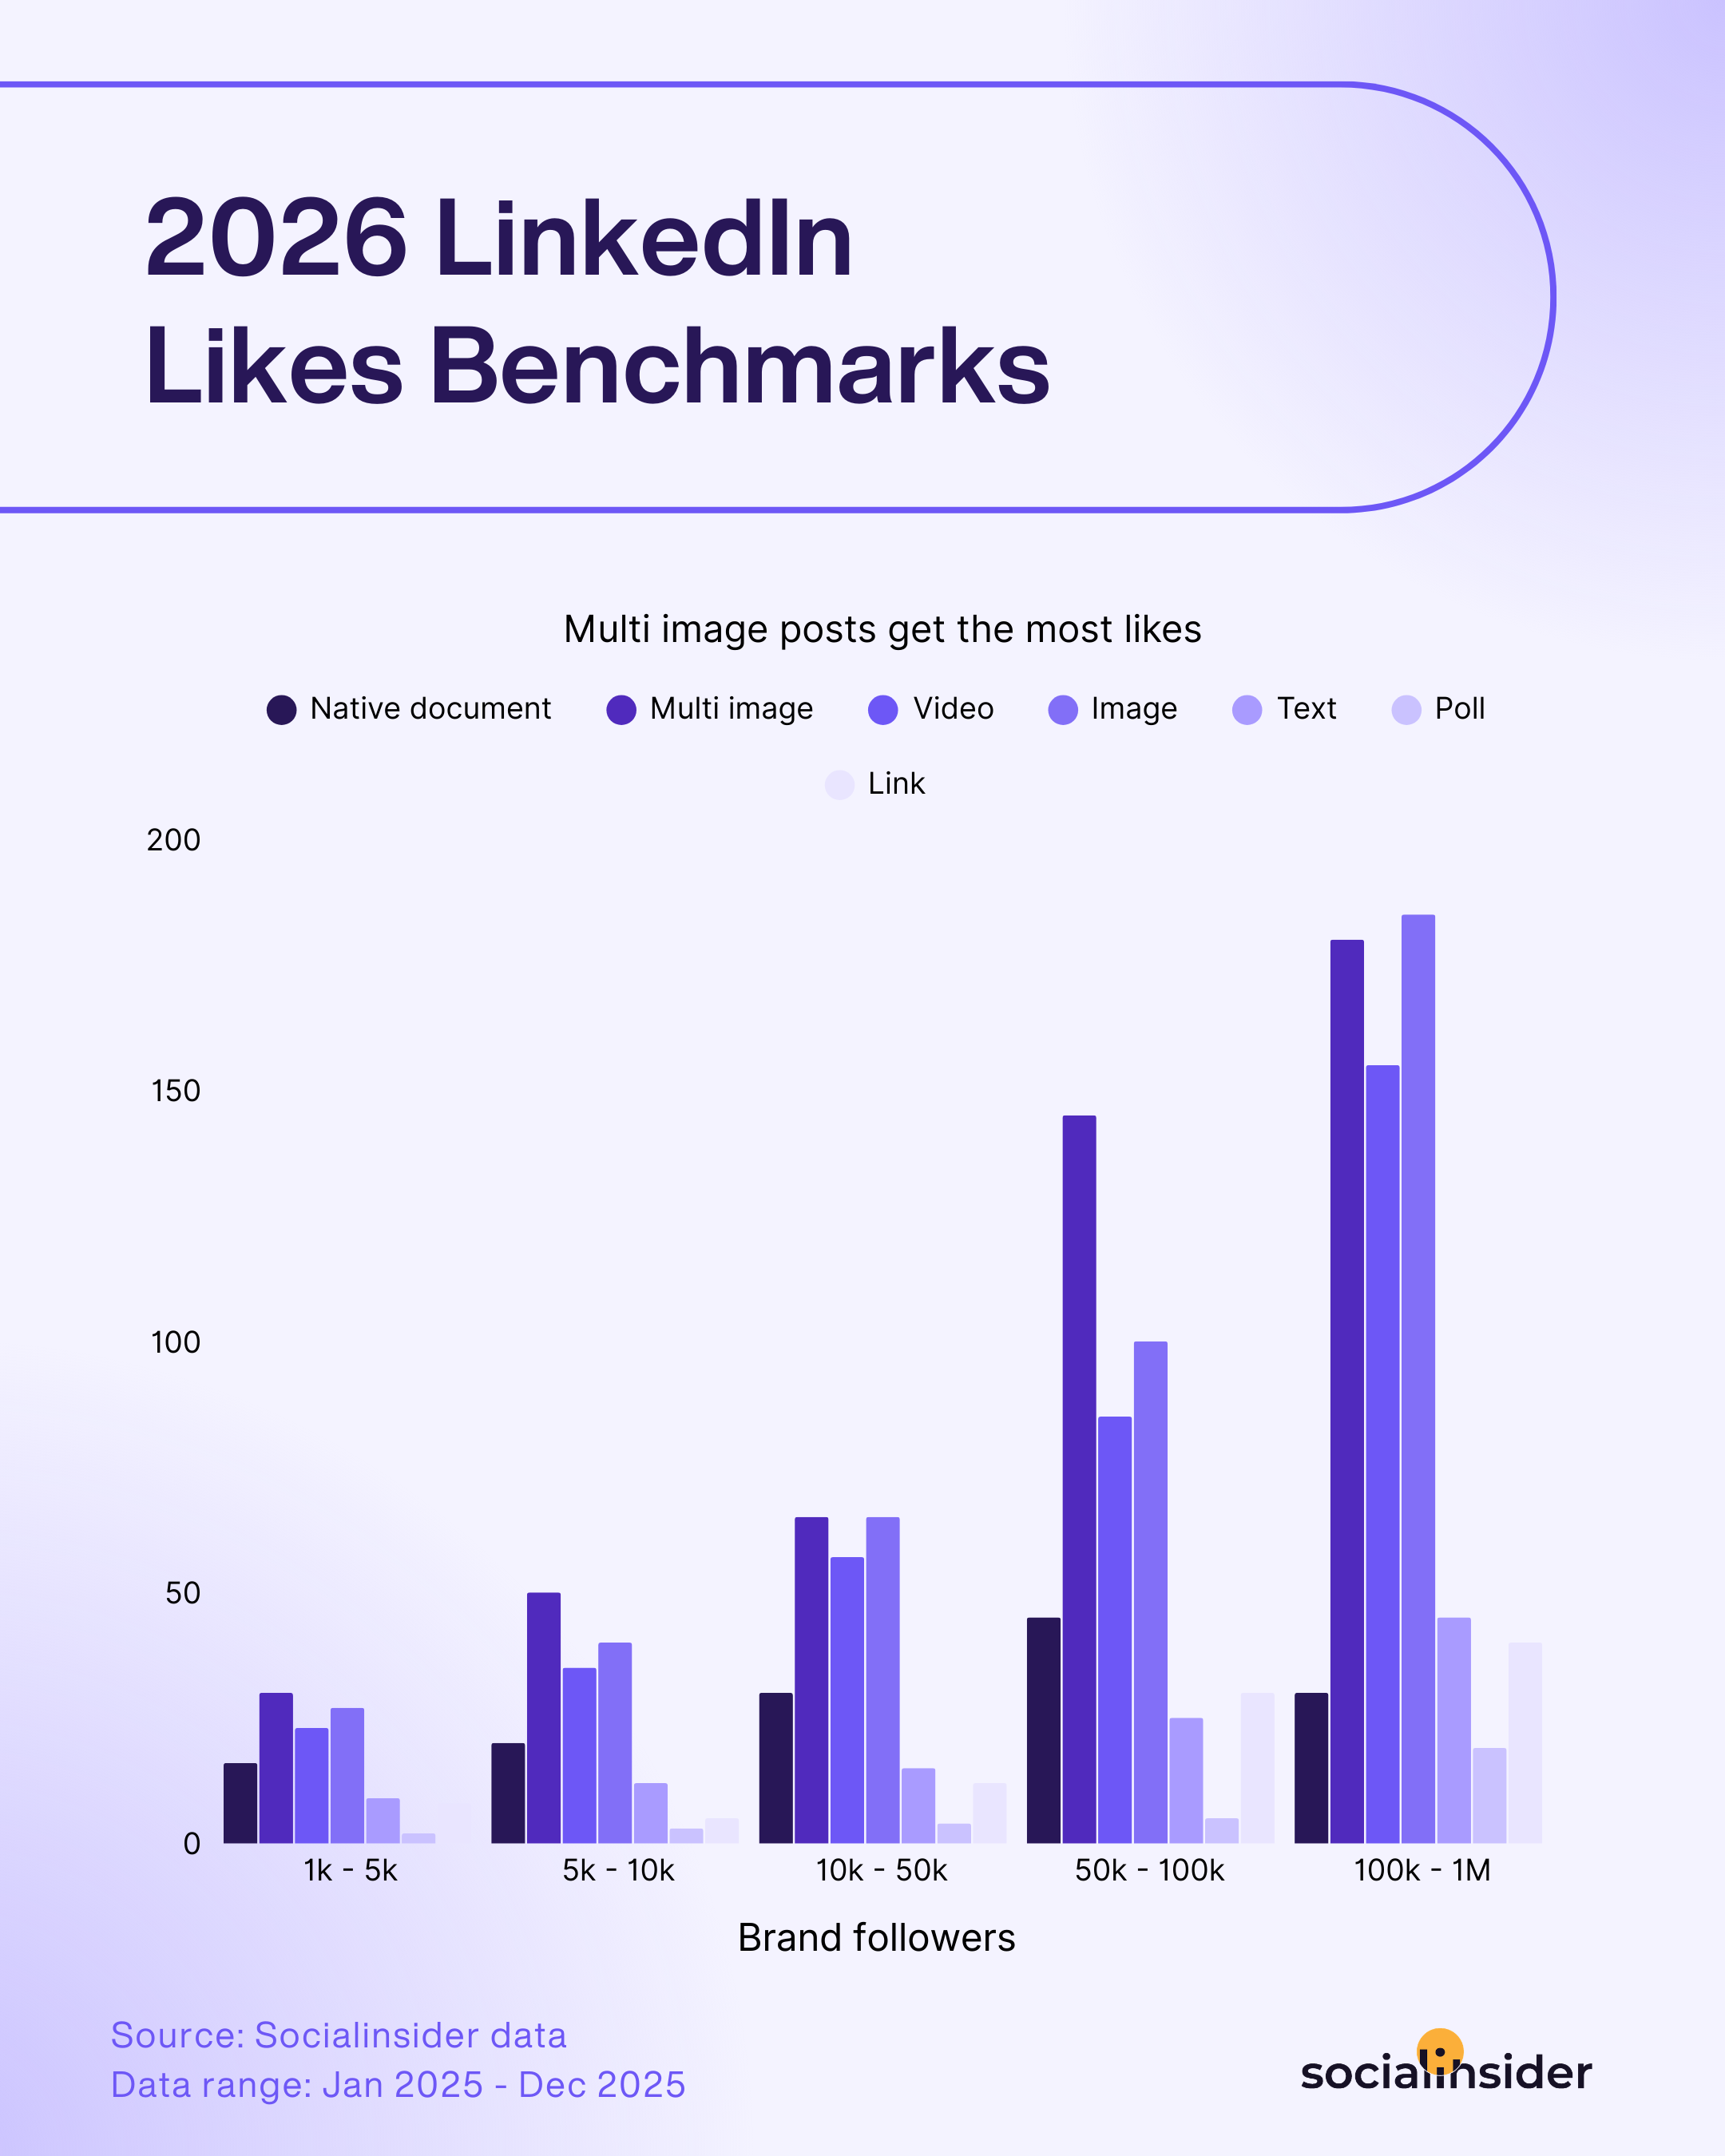
成長中のブランドページから歴史のあるコミュニティまで、ひとつだけはっきりしています。いいねを増やしたいなら、複数画像の投稿が最適です。LinkedInのフォロワー数が増えるほど、この投稿形式の効果も高まります。インタラクションを最大化するなら、間違いなくおすすめです。
今はスピーディーな動画コンテンツが主流の時代です。その中でマルチ画像投稿やカルーセル投稿は、もっと情報を求める脳の部分を満たすため、オーディエンスのエンゲージメントを生み出します。人々はストーリーテリングやコンテキスト、情報の重なり合いを求めています。単なる1枚の画像やインサイトだけではありません。カルーセル投稿なら、投稿者はインタラクティブで満足感のある形でコンテンツを届けられます。ユーザーは自分のペースでスワイプしながら、新しい情報やビジュアル、メッセージを発見できます。この発見の感覚がエンゲージメントを長く維持し、いいねや保存、コメントなど、さらなるインタラクションを促します。 — Ivy Mullins、ソーシャルメディアマネージャー、Born Social
LinkedInでいいねを増やすための戦略的な戦術です。
- 強力なビジュアルとフックを使いましょう:投稿の冒頭にインパクトのある画像や魅力的な見出しを配置してください。ユーザーの注目を集め、スクロールを止めて「いいね」でコンテンツを評価してもらいましょう。
- メッセージをパーソナライズしましょう: ターゲットの課題や関心に直接訴える表現やストーリーズを活用してください。投稿がより共感され、エンゲージメントが高まります。
- 人気コンテンツを再活用:過去のパフォーマンスが高い投稿を特定し、最新情報に合わせて更新やリミックスを行いましょう。新しいフォーマットで再シェアして、ゼロから始めずに新たなエンゲージメントを獲得します。
ミーム!Instagramだけのものだと思っている方も多いのでは?最近では、業界に特化したミームをLinkedInでシェアする人やブランドが増えています。自分の分野で“見られている”感覚は多くの人が好みますし、ミームは共感を得るのに最適です。— Eileen Mary O’Connell、シニアソーシャルメディアマネージャー、Paramount
LinkedInの投稿あたり平均インプレッション数
これまでにエンゲージメントについて説明しました。これはLinkedInの成果を評価する上で重要なメトリクスです。次に、もう一つの重要な要素であるインプレッションに注目しましょう。
メトリクスとして、LinkedInの平均インプレッションなどは、コンテンツがどれだけ効果的にユーザーへリーチできているかを示します。ブランドの認知度やオーディエンス成長を測る信頼性の高い指標です。
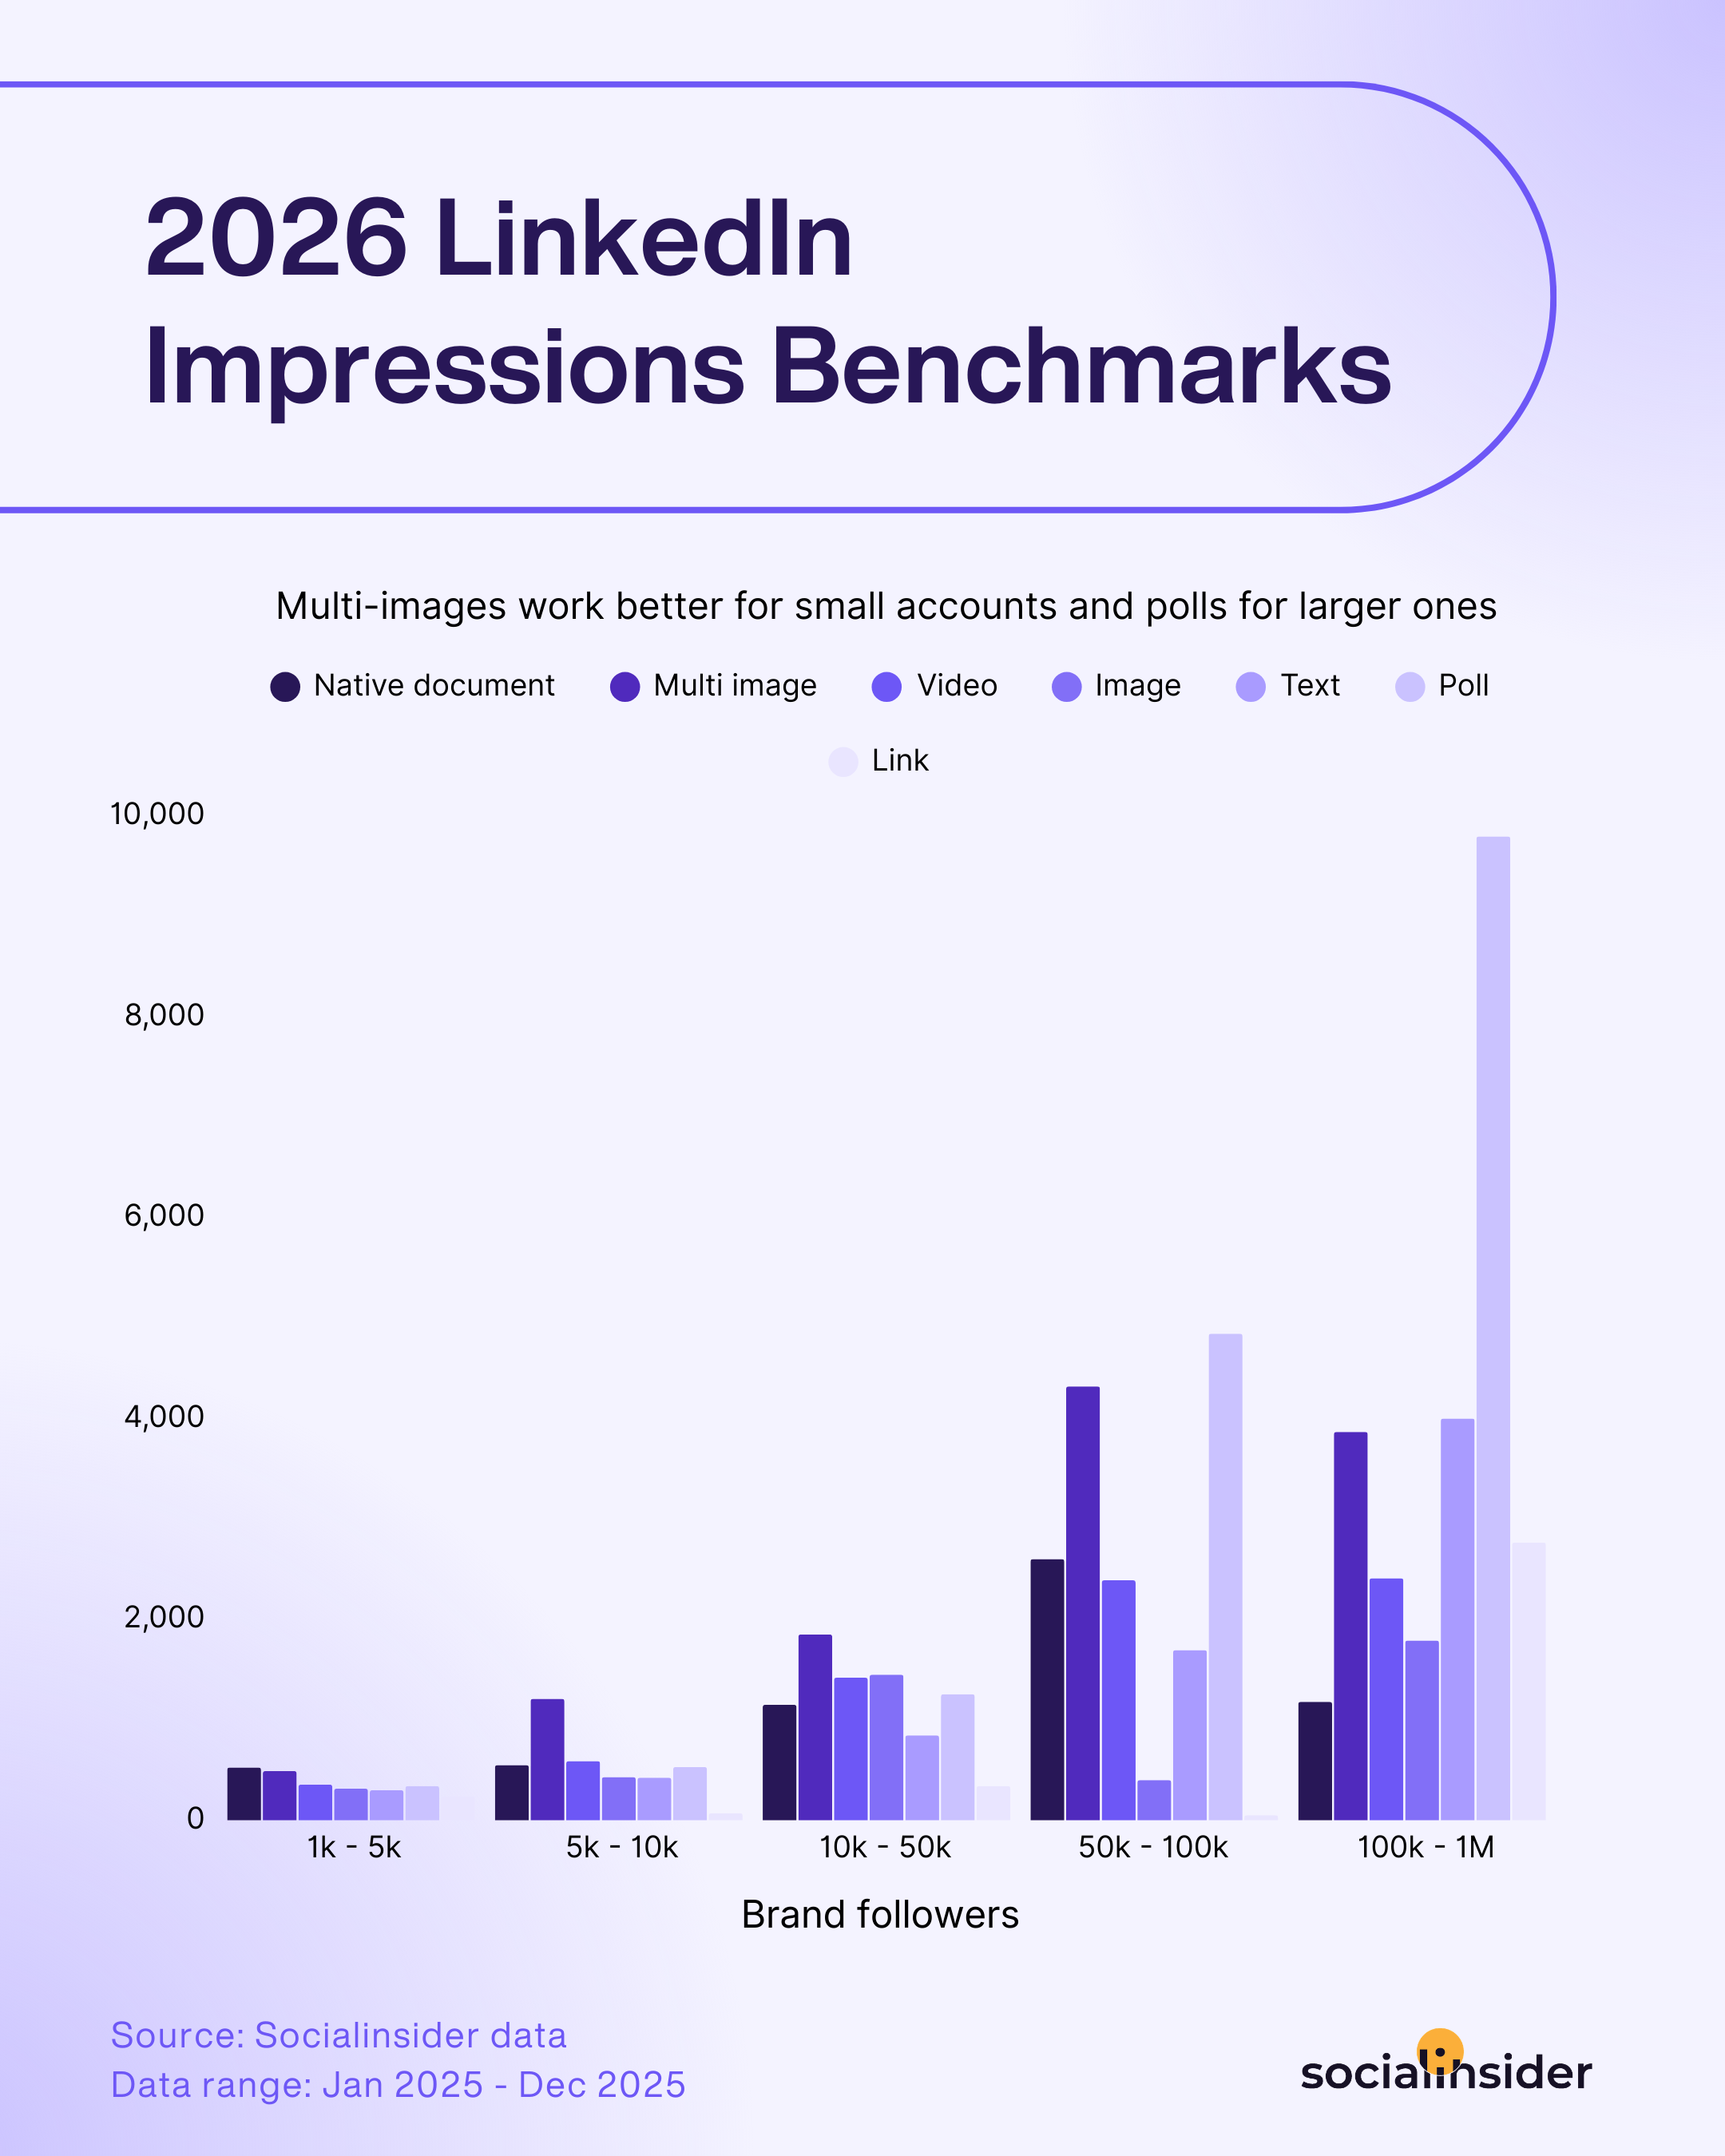
今年のベンチマークによると、コンテンツフォーマットとページサイズは密接に関連しています。フォロワーが50,000人までのページでは、マルチ画像投稿が1投稿あたりのLinkedInインプレッション数で常に最高値を記録しています。この投稿タイプは、企業成長初期のリーチ拡大に非常に効果的な選択肢です。
Multi-image posts work well because they add depth to the story and naturally create curiosity. Much like turning the page in a magazine, newspaper, or book, each slide invites the user to discover what comes next. On LinkedIn, this fits well with how users browse the platform, often between tasks or during short breaks. — Denisa Vlăduță, Senior Social Media Manager
興味深いことに、ページのフォロワーが50,000人を超えると、大きな変化が起こります。ポールが大規模なインプレッション獲得で最もパフォーマンスの高いフォーマットになります。 この変化は、オーディエンス拡大に伴いフォーマット戦略を見直す重要性を示しています。
私の経験では、大多数のオーディエンスが答えられる質問の調査が最も効果的です。つまり、まだ広く普及していないニッチなトピックや製品では行いません。既に自社ブランドについて起きている自然な会話からインスピレーションを得て、アンケートを作成してください。そして、オーディエンスのフィードバックに活用しましょう。どんなコンテンツを見たいか、質問してみてください。得られた学びを、今後のコンテンツ作りに活かしましょう。 — Casey Smith、シニアソーシャルメディアマネージャー、Slack
Strategic tactics to increase LinkedIn impressions
- リーチ拡大のためにコンテンツのフォーマットを多様化しましょう: Alternate between carousels, polls, and videos, as the data shows certain formats perform best at different audience sizes—using the right format helps amplify impressions.
- 関係者や企業をタグ付け:投稿内で業界のパートナーや従業員、協力者を適切にメンションしましょう。発見性が高まり、大きなネットワークからのシェアも促進されます。
- 従業員のエンゲージメントを促進: 従業員が投稿に反応し、シェアできるように働きかけます。従業員のリアクションやシェアは、直接のフォロワー以外にも投稿のリーチを大きく拡大できます。
創業者主導のブランディングの台頭により、ブランドは従業員自身のパーソナルネットワークをコンテンツエコシステムの重要な要素として活用するようになっています。リーダーがキャリアや企業構築のリアルな体験をよりオープンに共有するにつれ、このプラットフォームは業界を問わずプロフェッショナルが自身のマイルストーンや経験を安心して発信できる場所へと進化しています。今後も、プロフェッショナル成長や自己開発に積極的なオーディエンスに響く視点をLinkedInで共有する声が、ますます増えていくと期待しています。 — Eunice Cancino、ソーシャル&コンテンツストラテジスト
LinkedInの動画1本あたりの平均視聴回数
エンゲージメントとインプレッションを確認した後は、ソーシャルで長年パワフルな存在とされてきたフォーマット、動画コンテンツに注目しましょう。最も大きなLinkedInページが依然として最多の動画視聴回数を集めているのは事実です。しかし、今年のデータでもっと重要なのは大きな変化です。全てのページサイズで視聴回数が減少し、平均で前年比36%の減少となりました。
LinkedInは動画中心のプラットフォームではありません。利用者はTikTokやInstagramのように無限スクロールするためにLinkedInを開くことはありません。ネットワーク外まで動画を拡散させるディスカバリーエンジンやFYPも実質存在せず、バイラルの仕組みも全く異なります。LinkedInはプロフェッショナルな知識共有のために作られたものです。テキスト投稿、インサイト、ドキュメント、フレームワークが主軸です。動画機能を増やそうという試みは見受けられますが、まだプロダクトもユーザー行動もそこまでは至っていません。 — Julia Holmqvist, Social Media Manager, Semrush
What’s driving this trend? Rising competition and changing user habits are likely having a strong impact on how video content performs, regardless of audience size.
現代の環境では、継続的な実験や新しいクリエイティブなアプローチがこれまで以上に重要です。コンテンツピラーを多様化し、オーディエンスの関心がどこに移っているかに細かく注目してください。それが戦略の持続性を高めます。
Strategic tactics to increase your LinkedIn video views
- Pair your video with a descriptive, actionable post summary. A strong supporting text can increase curiosity and encourage users to click play.
- キャプションや画面上のテキストを埋め込むMany users watch on mute. Adding captions and key messages ensures your content is accessible and engaging, boosting completion rates.
- 動画でトレンドやよくある質問に答えましょう: 業界の課題や注目トピックを動画で解説することで、ブランドの迅速さと信頼性をアピールできます。
多くのクリエイターが他のプラットフォームで使っている動画フォーマットをそのまま持ち込んでいるため、成果が落ちているのかもしれません。動画自体のパフォーマンスは良いですが、LinkedInのオーディエンスはおそらく違うものを期待しています。
多くのコンテンツが同じ構成です。フック、インサイトや価値、CTA。このフォーマットは効果的ですが、今や飽和状態になっています。LinkedInの利用者は、よりプロフェッショナルで独自性のあるコンテンツを求める傾向が強いです。他で見かけるパターンをLinkedInでも目にすることで、エンゲージメントが低下している可能性があります。 — Fernando J、シニアコンテンツストラテジスト
LinkedIn投稿頻度のベンチマーク
LinkedInの投稿頻度ベンチマークを見ると、プラットフォームの進化するパターンがさらに明確になります。2025年を通して、ブランドは意図的に投稿回数を増やしています。特にビジュアル重視のフォーマットで顕著です。
数値が興味深いストーリーを物語っています。画像投稿と動画が大きく増加しています。月間平均の画像コンテンツは5投稿から7投稿に増加し、動画の頻度も月2投稿から4投稿へと倍増しました。ネイティブドキュメントもフィード上での存在感がわずかに向上し、昨年に比べて平均で2倍になっています。
私の見解では、この傾向はより大きな変化を示しています。ブランドは、短い時間で注目を集め、ユーザーのエンゲージメントを促すフォーマットへの投資を強化しています。
Strategic tactics to create a high-performing LinkedIn content strategy
- コンテンツを事前にまとめて作成するDedicate specific days each month to create and schedule posts, making it easier to maintain a consistent, higher frequency without last-minute stress.
- プロセスやテンプレートをドキュメント化する: 各投稿タイプ(お知らせ、ヒント、クライアントストーリー)用のテンプレートを作成し、ベストプラクティスをまとめます。これにより、チームの誰でも迅速にコンテンツを作成できます。
- 「アイデアバンク」を維持します。: Keep a central shared document or digital board where anyone can drop potential post ideas or inspiration as they arise for quick reference and less brainstorming pressure.
LinkedInオーディエンス成長ベンチマーク
現在、すべてのソーシャルプラットフォームで成長はますます難しくなっています。LinkedInも例外ではありません。2025年、LinkedInの平均フォロワー成長率はすべてのページ規模で明らかに減速しました。この傾向は特に大規模アカウントで顕著です。
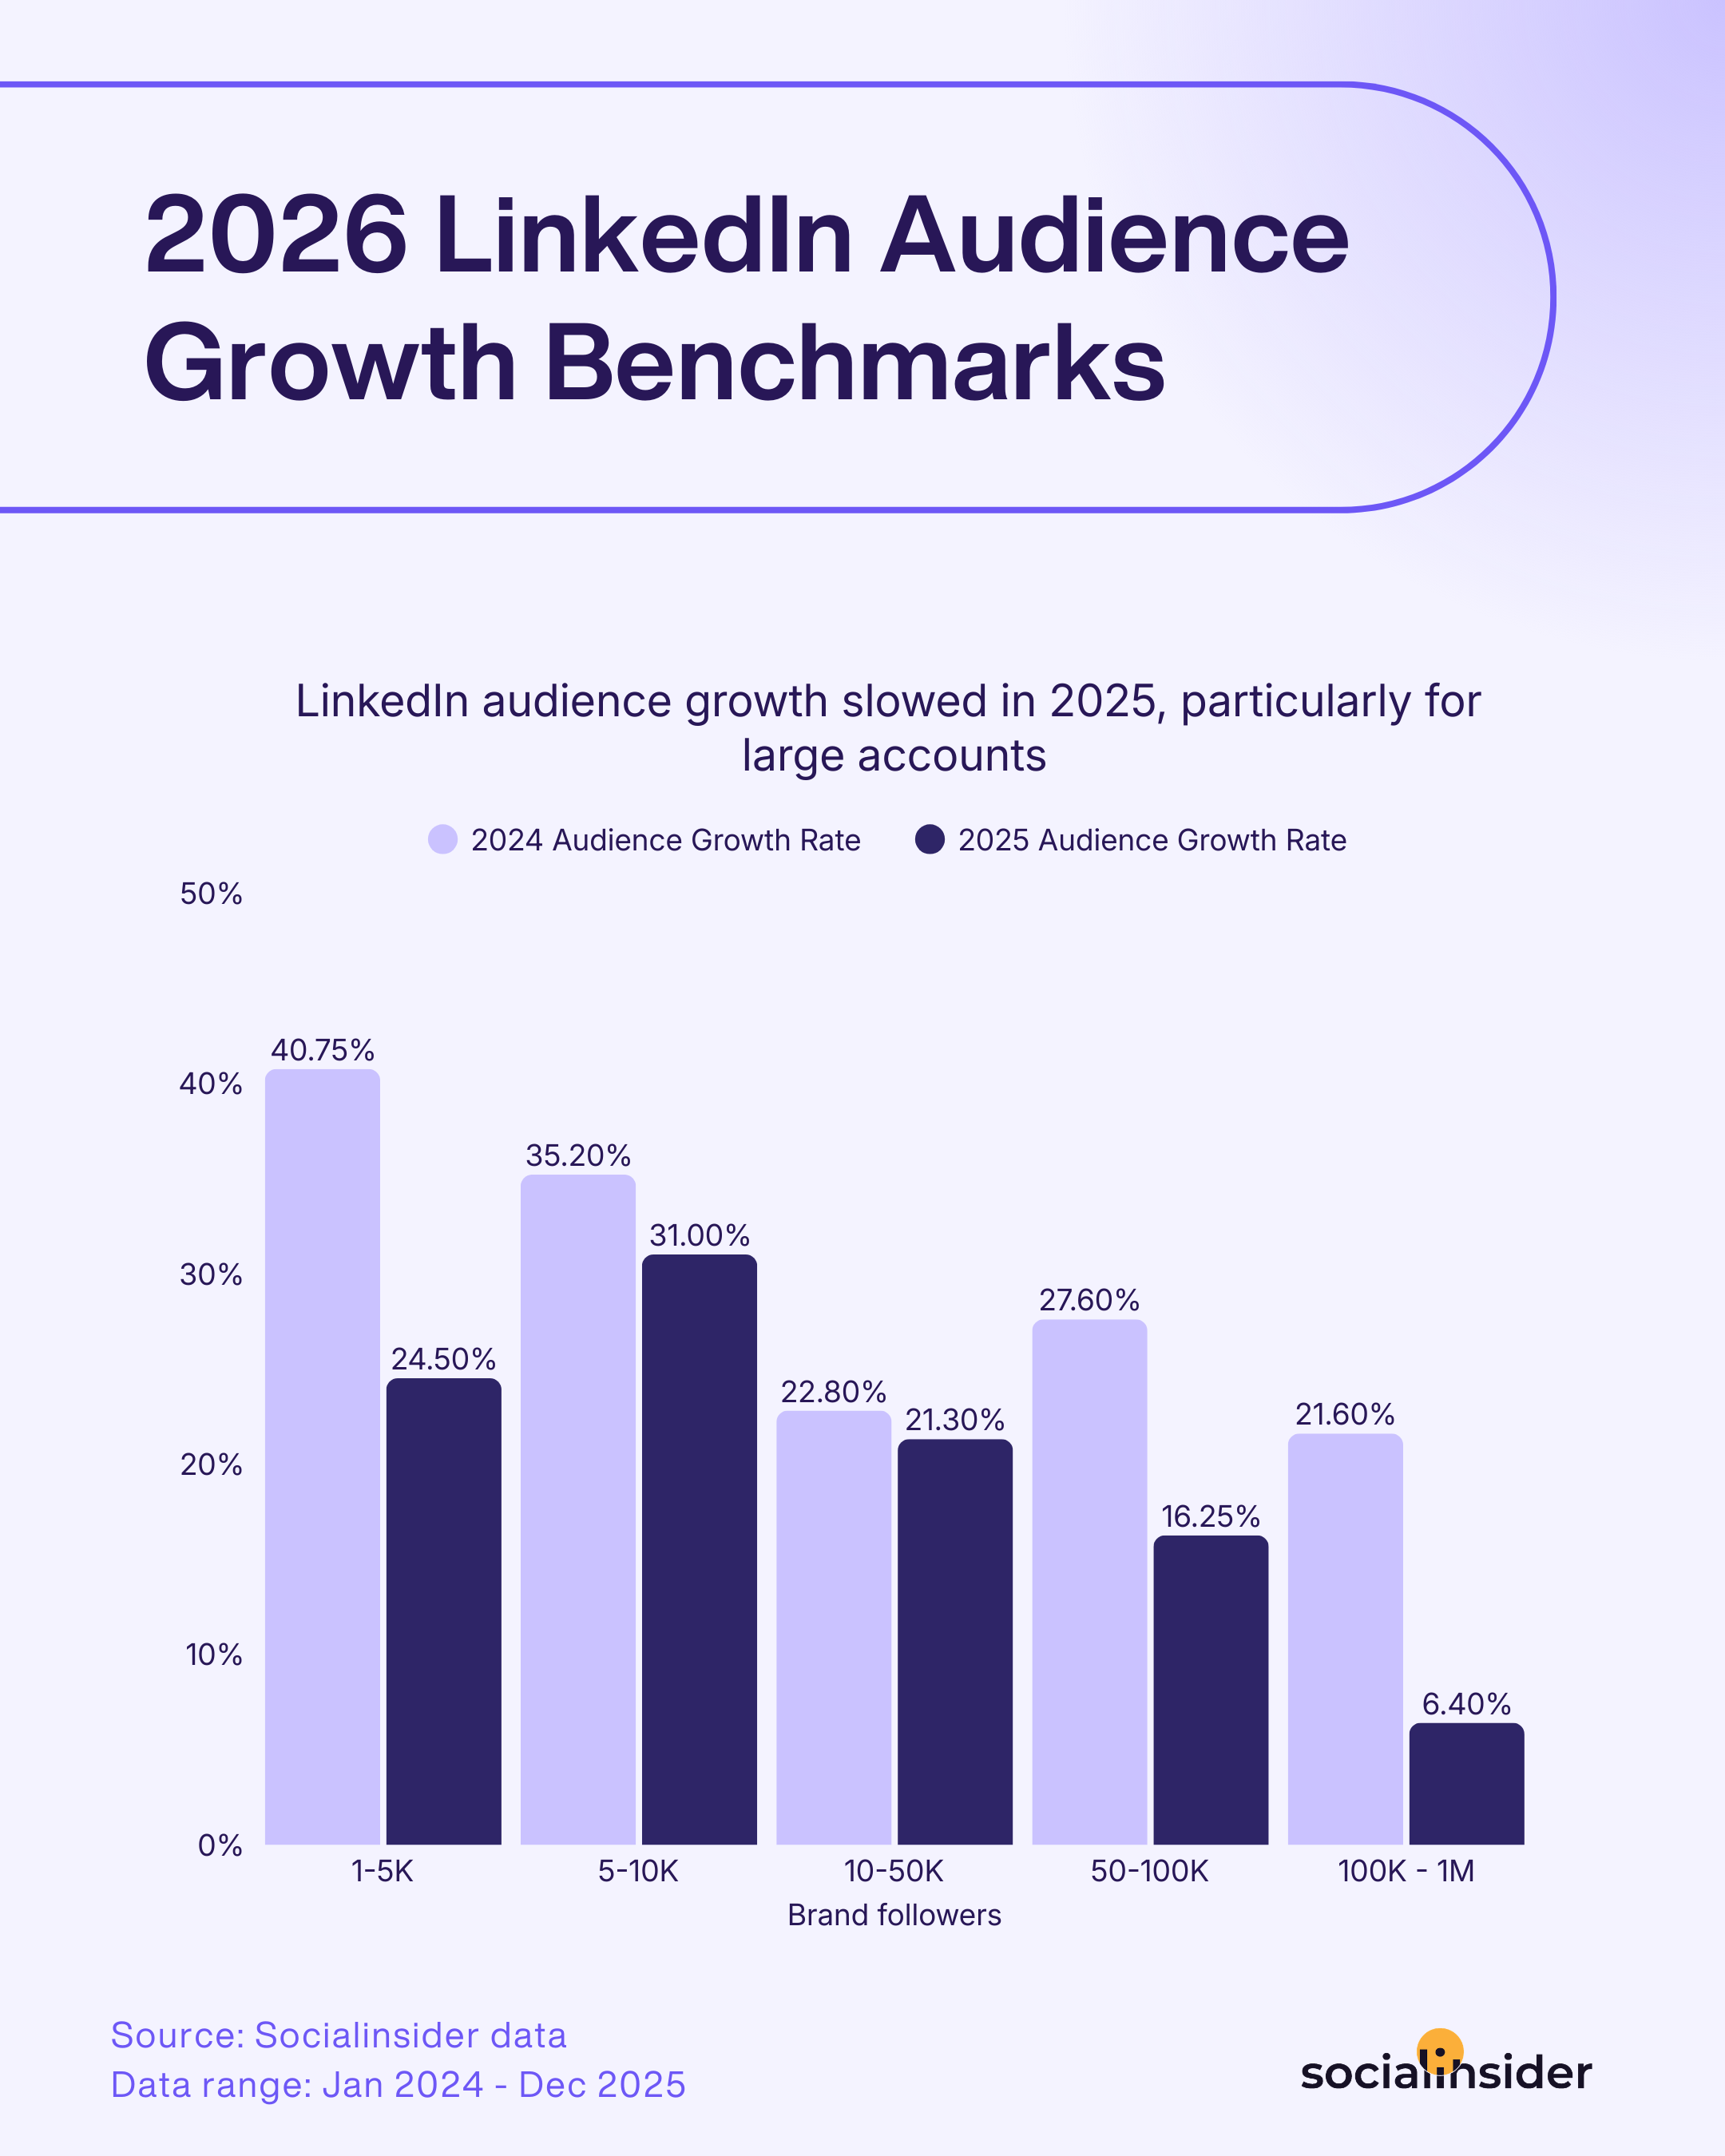
フォロワーが1〜5,000人の小規模ページでは、平均成長率が24.5%と健闘していますが、フォロワーが100,000〜1,000,000人のアカウントでは、成長率が大きく減少し、わずか6.4%となりました。
この減速は特に大規模なコミュニティで顕著です。既に確立したオーディエンスを拡大するには、これまで以上に多くの労力と戦略的な思考が必要であることを示しています。
継続して成果を出し、LinkedInで健全な成長率を維持しているブランドは、絶えず適応し、結果を分析し、オーディエンスの関心に合ったコンテンツを提供し続けています。
この停滞の要因は、『キャリアをコンテンツ化』する流れがメインストリームのソーシャルチャンネルで当たり前になりつつあることにあると考えています。かつては私生活のハイライトを共有する場だったプラットフォームに、ユーザーは仕事の実績やキャリアストーリー、リーダーシップの見解までも統合し始めています。従業員発信のコンテンツの増加により、職場のことを投稿する際の「許容・回避」の線引きが曖昧になってきています。オーディエンスはTikTokやInstagramのFor Youページやフィードで仕事を見つけたり決めることもあります。LinkedInがオンラインキャリアハブとして独占的だった時代は終わりつつあり、今やキャリアに関する会話やチャンスは複数の大手ソーシャルプラットフォームで存在しています。ユーザーはもはや一つのプラットフォームに集中する必要はなくなったのです。 — Bronte Chandler、アソシエイトディレクター・ソーシャルメディア、Born Social
Strategic tactics to grow your audience on LinkedIn
- Launch specialized LinkedIn Live events or webinars: Host exclusive, interactive events (Q&As, interviews, industry panels) and promote them broadly—live content draws new audiences and encourages non-followers to connect.
- 業界の仲間とコラボレーション Partner on co-branded posts, joint campaigns, or shoutouts with complementary brands or professionals, introducing each other’s networks for organic follower expansion.
- 継続的なミニシリーズやエキスパートによるヒントを提供: 毎週または隔週で実践的なアドバイスを含む教育シリーズを開始します。訪問者が次回を見逃さないよう、フォローする理由を定期的に作りましょう。
メソドロジー
この調査結果は、2024年1月から2025年12月までアクティブだった16,645のLinkedInビジネスページから収集した130万件のLinkedIn投稿を分析したものです。
本分析で参照したコンテンツフォーマットは、以下の通りです。
- ネイティブドキュメント:LinkedInに直接アップロードされたPDFで構成される投稿タイプです。カルーセルに似ています。
- マルチイメージ:複数の写真を一度にアップロードする投稿タイプです。アルバムのように表示されます。
- テキスト投稿:テキストのみで構成されたLinkedInの投稿です。
- 投票:投票可能な質問です。
- 画像:画像をアップロードした投稿です。
- ビデオ:動画をアップロードした投稿です。
LinkedInのメトリクスは以下のように定義します。
- インプレッションによるエンゲージメント率:繰り返し閲覧したユーザーのうち、あなたのLinkedIn投稿にエンゲージメントした人数を示します。エンゲージメント数をインプレッション数で割り、100を掛けて算出します。LinkedInでも同じ計算式が使われています。
- 投稿ごとの平均インプレッション数は、1投稿あたりが平均で獲得するインプレッション数を示します。
- 動画あたりの平均視聴回数は、1本の動画が平均して獲得する視聴回数を示します。
- 月あたりの平均投稿数:LinkedInページが平均して投稿する件数です。
ご注意: 本調査は2025年の数値を2026年として表示しています。公開時点では年初につき、分析のための十分なデータがありませんでした。そのため、四半期ごとにアップデートを提供し、年の進行とともにより多くのデータをご覧いただけます。
詳細なLinkedInパフォーマンスメトリクスを取得します。
洞察に満ちたLinkedInアナリシスを実行して、戦略的なコンテンツ最適化のアイデアを獲得しましょう!
リアルタイムのインサイトでソーシャルメディア戦略を強化しませんか?
戦略的なインサイトを獲得し、全チャネルのソーシャルパフォーマンスを分析します。異なる期間のメトリクスを比較し、レポートを数秒でダウンロードできます。