ネイティブインサイトを超えるLinkedInアナリティクス
Socialinsiderは、使いやすいプラットフォームでLinkedInのエンゲージメントとパフォーマンスの詳細なインサイトを提供します。
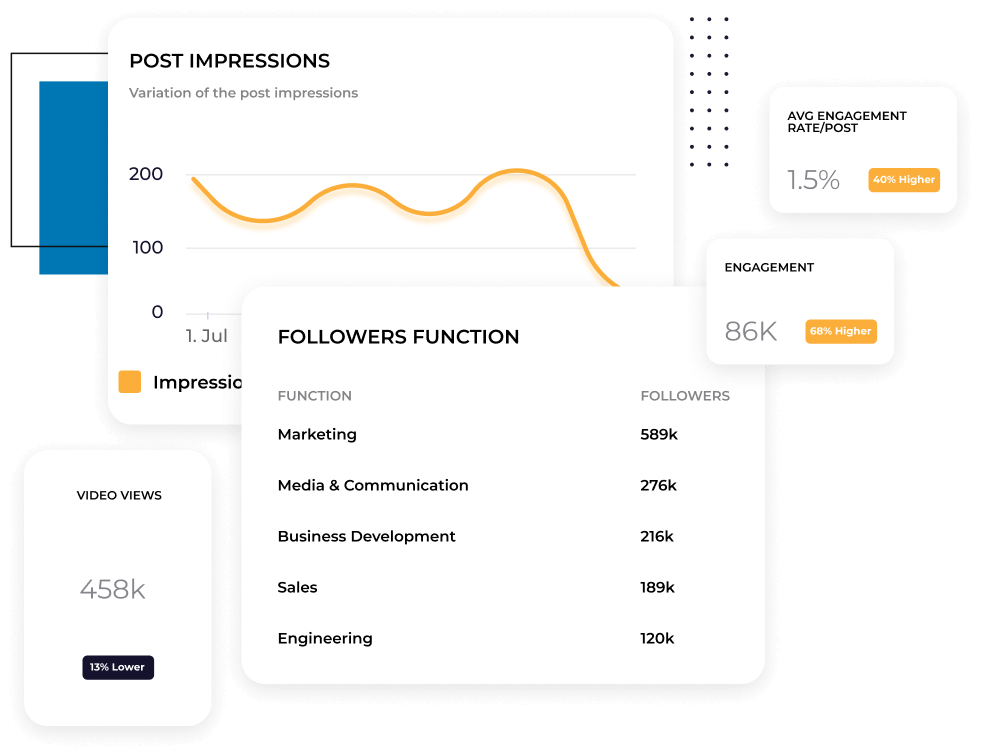


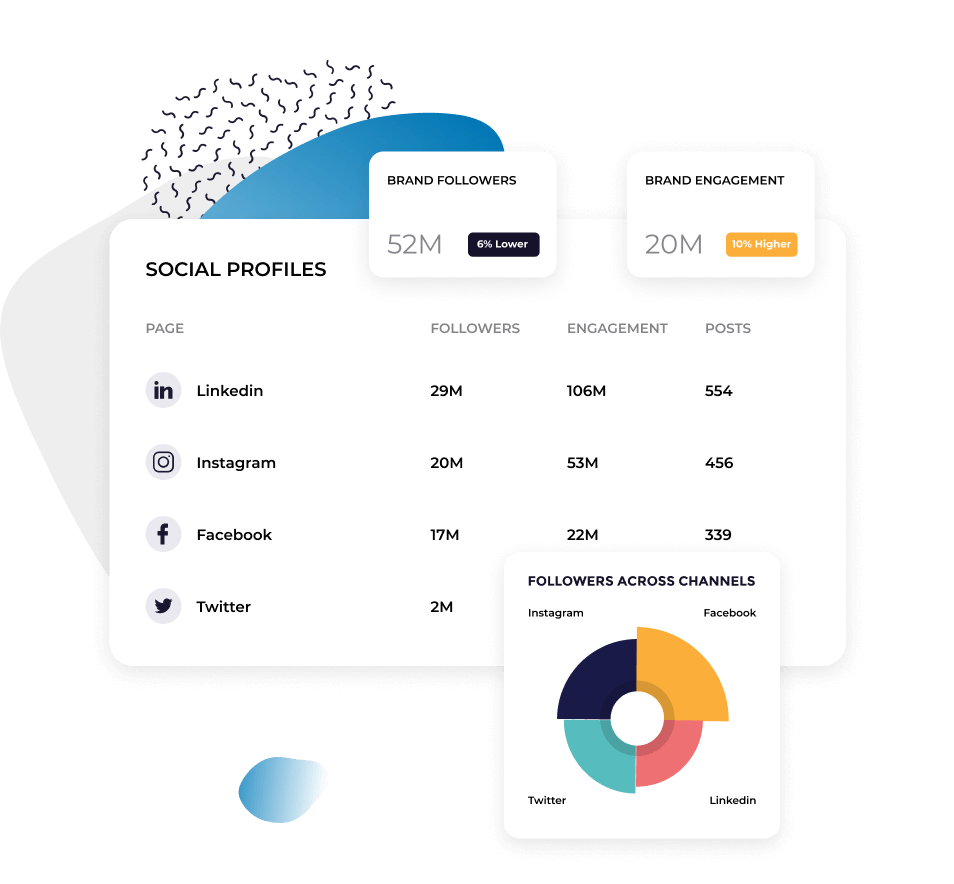
すべてのLinkedInメトリクスを1つのダッシュボードで確認できます
エンゲージメント、インプレッション、クリック、動画の視聴回数、フォロワー数の成長をひとつの画面でトラッキングできます。LinkedInのネイティブアナリティクスやスプレッドシートを行き来する必要はありません。ダッシュボード上でコンテンツのパフォーマンスを日、週、月ごとに自動表示。毎回ビューを作り直す手間は不要です。
投稿レベルで効果を確認
アカウントレベルのメトリクスでは平均値が分かります。投稿レベルのアナリティクスで、どのフォーマット・トピック・メッセージがあなたのオーディエンスのエンゲージメントを生み出しているかが明確になります。コンテンツ全体の傾向を見つけて、成果の出ているものに注力しましょう。


あなたのコンテンツが誰にリーチしているか正確に把握できます。
職種、業界、企業規模など、オーディエンス属性を把握できます。ターゲットとしている意思決定者へコンテンツが届いているのか、違う層を引き寄せてしまっていないかを確認しましょう。Socialinsiderは、調整に必要な細かなデータを提供します。
LinkedInのメトリクスを他のチャネルと比較してください
LinkedInが他のソーシャルメディアプラットフォームとどう比較されるか、クロスチャネルビューで確認できます。エンゲージメントが最も高い場所、成長が最速のポイント、投資過剰や不足の箇所を把握しましょう。
お客様の声
"「カスタマーサービスも私のお気に入りの機能の一つです。皆さんは本当に素晴らしいです。御社のチームはとてもレスポンスが早く、親切で丁寧です。これは普通ではありません。」"

"Socialinsiderのおかげで、私たちが他のフォローしているアカウントと比較して、改善しているのか低下しているのかが明確に分かりました。"

"Socialinsiderでは、競合分析により市場に対するパフォーマンスのインサイトを得ることができます。"

"インスタグラムのハッシュタグに対するセンチメント分析は素晴らしいです。この新しいソーシャルメディアリスニングダッシュボードは、長期的なプランニングにとても役立ちました。"

"私たちは、すべての40社のソーシャルメディアクライアントにこのソーシャルメディアアナリティクスダッシュボードを活用しています。すべてのパフォーマンスデータを一括で管理できます。"

"Socialinsider導入により、チームの効率が向上しました。ソーシャルメディアのデータ収集に時間をかける必要がありません。代わりに、インサイトや分析に集中できます。"

"簡単な戦略変更の計画や特定のソーシャル投稿のパフォーマンスを確認する際、日々のソーシャルメディアインサイトにSocialinsiderを活用しています。"

"平均して、ブランド向けのソーシャルメディアレポート作成はSocialinsiderなら1~2時間で完了します。以前はデータ収集に丸一日かかっていました。"

"Socialinsiderは年間16,000ドル以上のコスト削減に貢献しています。月次レポートや複雑な長期分析にかかる時間も大幅に短縮できました。"

SocialinsiderでLinkedInエンゲージメント率を追跡する方法
Socialinsiderのソーシャルメディアアナリティクスと競合分析ツールで、ソーシャルメディアのパフォーマンスを計測し、監査を実施、成果を比較できます。
まずはSocialinsiderの無料トライアルアカウントを作成してください。
管理しているプロフィールを連携してください
任意のLinkedInビジネスアカウントのエンゲージメントメトリクスをすべて取得できます。
過去投稿データを分析します。
Perform a cross-channel analysis to evaluate your LinkedIn performance.

競合のインサイトを取得し、
ソーシャルメディアアナリティクスのメトリクスを確認しましょう。
よくあるご質問
ご質問がありますか?私たちが答えます。
What are LinkedIn analytics?
LinkedInアナリティクスは、あなたのLinkedIn企業ページのパフォーマンスを可視化するデータとインサイトです。LinkedInアナリティクスには、オーディエンス、コンテンツ、リーチ、広告キャンペーンなどに関するメトリクスが含まれています。
LinkedInアナリティクスで確認できる主なメトリクスは次のとおりです。
- ページビュー: 会社ページが閲覧された回数
- フォロワー: ページのフォロワー数
- 投稿インプレッション: 投稿が表示された回数
- リアクション: 投稿に対するリアクション(いいね、サポート、祝福など)の数
- クリック数: 投稿内リンクがクリックされた回数
成長やパフォーマンスはグラフで確認でき、フォロワー数や投稿の成果、他のKPIが時間とともに改善しているか追跡できます。
LinkedInアナリティクスに注目することで、ページの成長や投稿がオーディエンスに響いているか、LinkedInマーケティング戦略が機能しているかを確認できます。
なぜLinkedInアナリティクスを追跡するのですか
では、ここで本題です。なぜわざわざLinkedInアナリティクスを追跡する必要があるのでしょうか。
なぜそれが重要なのでしょうか。
マーケティングチームにどんな価値をもたらすのでしょうか。実際に変化を生み出せるのはどこか。
LinkedInのアナリティクスを追跡することで、会社には主に4つの大きなメリットがあります。
ターゲットオーディエンスをより深く理解
LinkedInアナリティクスでは、ページ訪問者(企業ページを訪れた人)やフォロワー(実際に企業ページをフォローしている人)に関するデータへアクセスできます。
こうしたデータには以下が含まれます。
- 地域
- 業界
- 企業規模
- 職種
- 役職レベル
これにより自社のオーディエンス像を明確に把握できます。また、適切なターゲット層にリーチできているかを確認できます。
例えば、自社商品のターゲットがB2Bの経営者層なのに、フォロワーの多くが新入社員の場合、発信内容を見直して新たなオーディエンスを惹きつける必要があります。
適切なソーシャルメディアペルソナをターゲットにできれば、オーディエンスの属性データと投稿パフォーマンスで、どのコンテンツが最も響いているかを把握できます。
これらのデータにより、オーディエンスが誰なのか、何を求めているかを明確に知ることができます。
コンテンツ戦略を改善
LinkedIn企業ページのアナリティクスで、投稿ごとのパフォーマンスが一目でわかります。リーチやインプレッション、リアクション、コメント、シェアなどが確認できます。どれだけ多くの人がコンテンツを見ているか、どれだけ反応しているかを把握すれば、どの投稿タイプが最も共感を呼んでいるかがわかります。
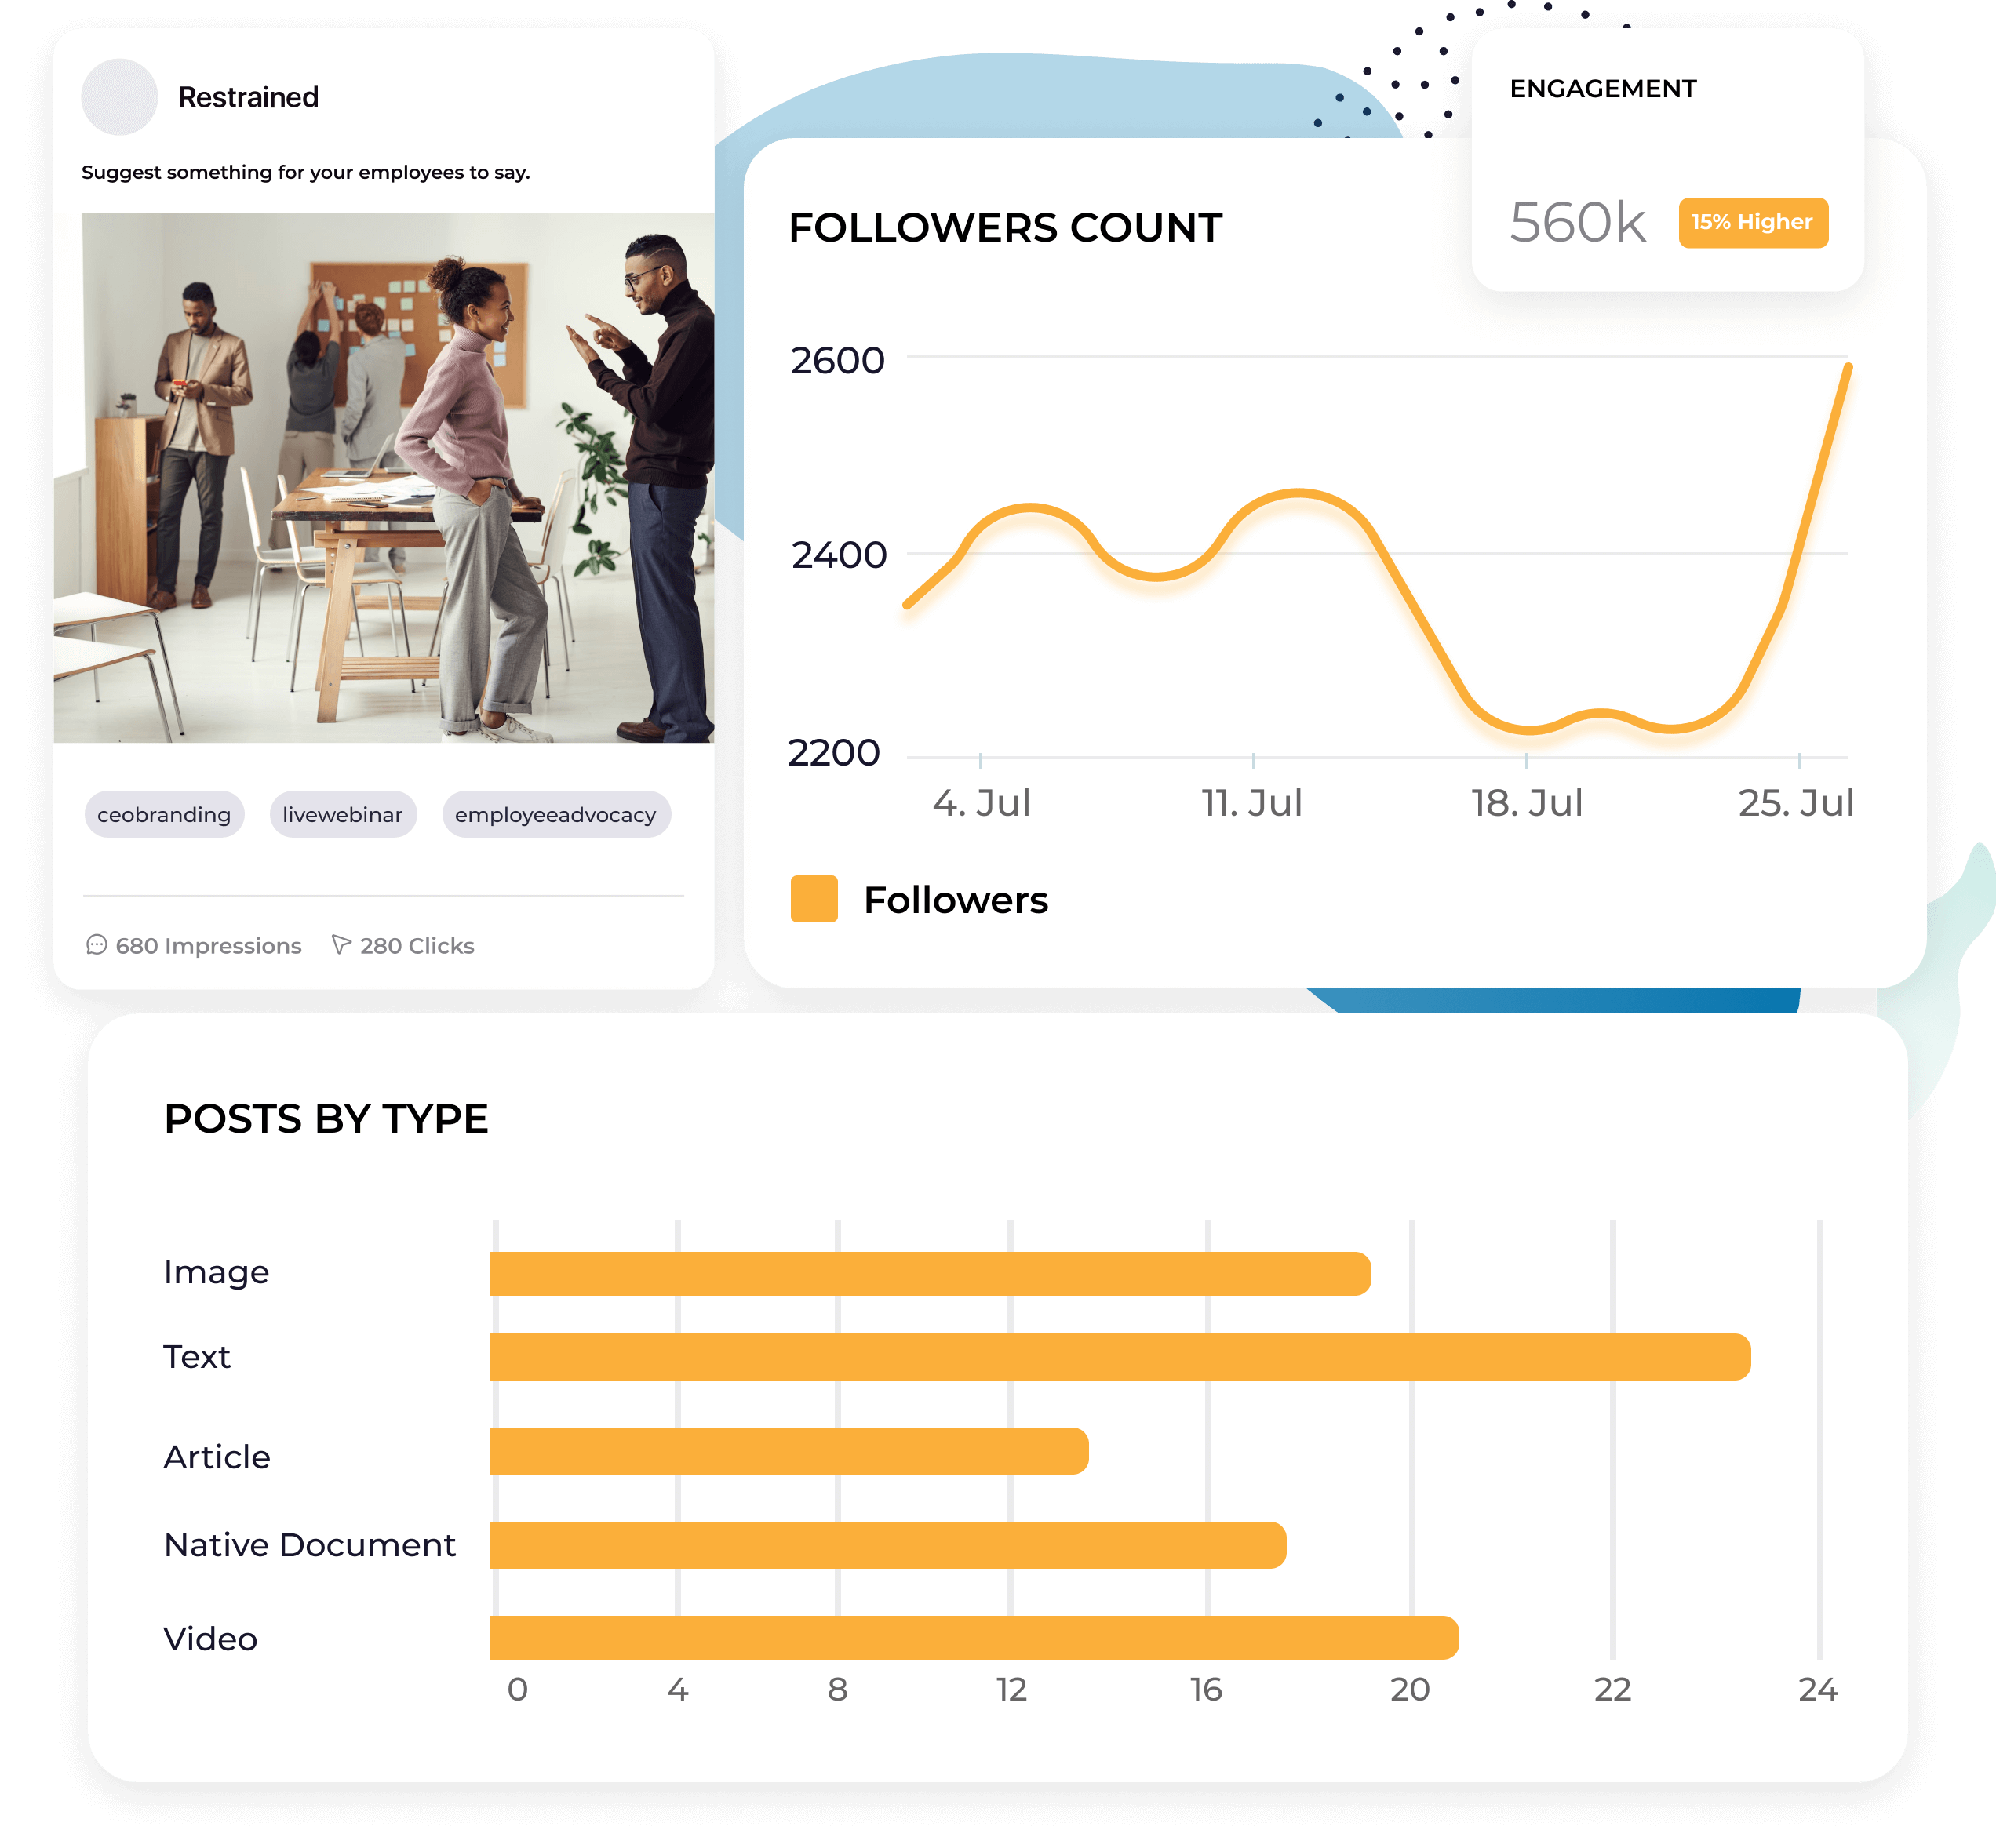
LinkedInでは様々な投稿タイプが作成できます。例を挙げると:
- テキストのみの情報投稿
- 画像投稿
- 動画投稿
- PDFスライド投稿
投稿アナリティクスでパターンは見えてきますか? どの投稿がより多くの人にリーチし、エンゲージメントを生み出しているでしょうか。
そのコンテンツタイプを戦略に積極的に取り入れることで成長を継続。コンテンツ戦略の改善とリーチ、エンゲージメント、ROI向上が実現できます。
LinkedInのROIを向上させる
最大のメリット、そしてLinkedInアナリティクスを追跡すべき理由は、より高いROI(投資対効果)の実現に役立つ点です。
こう考えてみてください。オーガニック・スポンサード投稿の各メトリクスを追跡しなければ、求めている反応が得られているか全く分かりません。オーディエンスの反応が把握できない状態では、効果を測れないままコンテンツを発信し続けてしまいます。
結局、LinkedInマーケティングの目的は、ターゲットオーディエンスにリーチし、顧客への転換につなげることです。投稿のパフォーマンス把握ができなければ、プラスのROIは得られません。投稿の成果に応じて戦略を柔軟に調整しつづければ、さらにROIを高められます。
LinkedInアナリティクスへのアクセス方法は?
There are two main ways of getting LinkedIn analytics data for your company page, and we’re going to walk you through each one.
How to access your LinkedIn business page analytics via the native app
Firstly, LinkedIn offers its own built-in analytics for you to check out. These are basic stats that help give you a level one understanding of how your company page is doing.
To access your LinkedIn analytics directly on LinkedIn, head over to your company page and check out your Dashboard.
Your dashboard summary shows you details like:
- A few actionable insights
- Your recent posts
- Top key metrics like search appearance, page visitors, new followers, and impressions
- Trending employee posts
Your Analytics dashboard breaks up your LinkedIn page data into sections like:
- Content: Metrics that share the effectiveness of your posts
- Visitors: Demographics and sources of your page visitors
- Followers: Demographics and sources of your page followers
- Leads: Download leads you’ve collected from lead generation forms you’ve shared on LinkedIn to upload to your CRM
- Newsletters: If you have a LinkedIn newsletter, track performance (i.e., subscribers, views) here
- Competitors: Compare basic page details with your competitors
- Employee advocacy: Get insights into content recommended to employees
Many companies are satisfied with the level of analytics they receive from their LinkedIn pages. However, there’s another way to access even more analytics if you’re looking to dive even deeper.
How to access your LinkedIn analytics using a third-party analytics platform like Socialinsider
If you want to dive even deeper into your LinkedIn analytics, do so with the help of a third-party analytics platform. Socialinsider is the perfect solution.
Start by creating a Socialinsider account—if you haven’t done so already. Log in and connect your LinkedIn page so you can view your own data within the Socialinsider dashboard.
To do so, click Connect social accounts at the top of your home dashboard. You’ll then need to log in with your LinkedIn credentials so that you can get full social media analytics access inside Socialinsider.
The LinkedIn analytics you get using Socialinsider include:
- A summary report that you can customize by adding as many different metrics as you want. These will be available at a glance before diving into deeper reports.
- A content report that walks you through data like the number of posts you’ve shared in a given time period, your average posts/day, posts by type, top posts, and even the worst performing posts so you can find patterns.
- Engagement insights that showcase metrics like total engagements (i.e., likes, comments, shares) alongside KPIs like engagement rate (with or without clicks), average engagement, post types sorted by engagement, and more. You can even see the best day and time to post based on your average engagement. Plus, break down individual engagements, like comments, shares, clicks, and video views.
- Reach insights that share basic data on how many people you’ve reached with your LinkedIn content within a given time period.
- Impressions data that lets you see how many people have seen your content and find the best day and time to post based on your average impressions.
- An audience demographics report that lets you see analytics like follower count and growth, geographical distribution of your followers, and details about your followers at work.
- A section about your LinkedIn posts that give you a birds eye view of your recent posts in order of how well they performed, plus basic engagement metrics for each one.
- A head-to-head comparison dashboard that lets you analyze other company pages from a different region into your Socialinsider dashboard.
- Campaign reports based on posts you’ve tagged inside your Socialinsider account as being part of a specific campaign and their overall performance.
You can also download any and all of these LinkedIn analytics reports by clicking Download in the top right corner to share your LinkedIn page analytics with other team members. Formats available include CSV, PPT, PDF, and XLS. You can import LinkedIn data to Google’s Looker Studio, too.
追跡すべきLinkedInページのメトリクスは?
LinkedInでコンテンツのパフォーマンスを正確に把握し、活動や全体戦略を調整するために追跡すべき指標が複数あります。
最適なLinkedInコンテンツメトリクスを追跡することで、戦略が機能しているかどうか判断できます。エンゲージメントやリーチなど様々なカテゴリーのアナリティクスで、コンテンツの成果やオーディエンスの情報などを理解します。
主なアナリティクスカテゴリは以下の通りです:
- コンテンツアナリティクス
- ビジターアナリティクス
- フォロワーアナリティクス
- リードアナリティクス
- ニュースレターアナリティクス
- 競合アナリティクス
- 従業員エンゲージメントアナリティクス
- LinkedInトラフィックアナリティクス
それぞれのカテゴリーに分けて、トラッキングすべきLinkedInプロファイルアナリティクスを解説します。
コンテンツアナリティクス
LinkedInのコンテンツアナリティクスは、投稿ごとや全体のパフォーマンスを把握するものです。オーガニックコンテンツの成果が全体のマーケティング戦略に大きく影響するため、多様なメトリクスやKPIが重要となります。
幸いにも、Socialinsiderが強力にサポートします。ここではSocialinsiderダッシュボードで確認できる、特に重要なLinkedInメトリクスを紹介します。
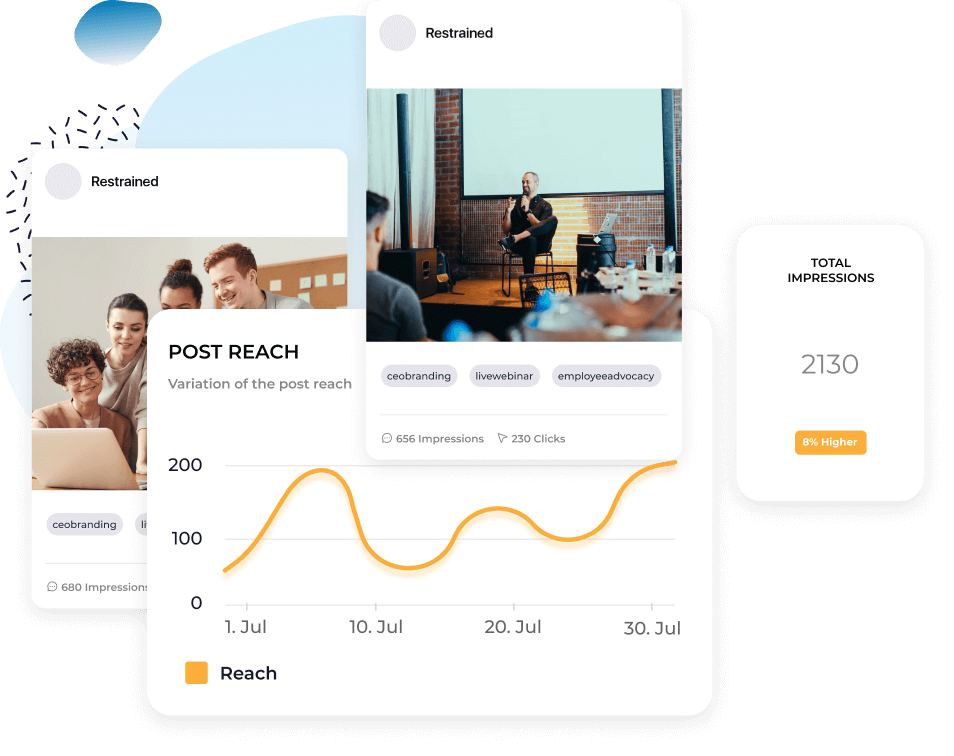
リーチ(Socialinsiderで確認可能)
リーチは、あなたのLinkedInコンテンツを見たユニークユーザー数です。各投稿ごとのユニークビューア数となります。
投稿ごとのリーチの人数を把握することで、LinkedInアルゴリズムに対して自社コンテンツの成果を評価可能です。理想的には、投稿リーチはアカウントのフォロワー数以上であることが望ましいです。
注記:LinkedInのネイティブアナリティクスダッシュボードでこの指標を見る場合、「ユニークインプレッション」と表記されます。
インプレッション(Socialinsiderで確認可能)
インプレッションは、投稿が閲覧された合計回数を指します。リーチよりも大きい値になることが多く、個人単位でなく全ての表示回数をカウントします。同じユーザーが2回投稿を見れば、リーチは1としてカウントされますが、インプレッションは2となります。
インプレッション数がリーチより多ければ、多くの人が繰り返しコンテンツを見ている証であり、オーディエンスに響いている良いサインです。
エンゲージメント(Socialinsiderで確認可能)
エンゲージメントは、コンテンツへのインタラクション数を示します。LinkedInでは以下を含みます:
- いいね・リアクション
- コメント
- リポスト
- リンククリック
- 動画視聴回数
- フォロー
投稿してもエンゲージメントがなければ、コンテンツ戦略の見直しが必要です。リアクションやコメントが付いていなければ、オーディエンスに十分に響いていない可能性があります。様々なコンテンツタイプを試して、エンゲージメントを増やしましょう。
クリック数(Socialinsiderで確認可能)
クリック数は、LinkedIn投稿がクリックされた総回数です。シェアしたリンク・「もっと見る」などへのクリック、会社ページや共有したドキュメントへのクリック等が含まれます。
Socialinsiderではクリックを含む・含まないエンゲージメントデータを比較できます。これは、管理者権限付きLinkedInアカウントを接続することでクリックデータにアクセスできるためです。
この機能により、競合とのエンゲージメント率比較をより正確に行えます。また、社内用としてクリックを含めたエンゲージメント率も取得可能です。
リアクション(Socialinsiderで確認可能)
LinkedInのリアクションは、投稿に対する様々な反応を指します。以前は「いいね」のみでしたが、現在は:
- いいね
- 祝福
- 支持
- 称賛
- 洞察的
- おもしろい
多くの人は「いいね」だけですが、他のリアクションが増えれば、コンテンツの印象把握につながります。特に「いいね」以外の反応は、投稿により多くの関心と時間をかけている証拠です。
コメント(Socialinsiderで確認可能)
コメントは、投稿にコメントした人数を示します。LinkedIn運用が進むにつれ、コメント数の増加を目指しましょう。
コメントを増やすには、投稿の締めくくりに質問を入れると効果的です。トピックに関する対話を促し、オーディエンスのエンゲージメントを高めましょう。
リポスト(Socialinsiderで確認可能)
リポスト(シェアとも呼ばれる)は、誰かがあなたの投稿を自分のプロファイルや会社ページにシェアした回数を指します。リポストで新たなオーディエンスにアプローチできるので、リポスト数の増加も重要です。
まずは従業員によるリシェアを推進しましょう(従業員エンゲージメントアナリティクスのセクションでも解説します)。オーディエンスが楽しめるコンテンツ作成も続けてください。
エンゲージメント率(Socialinsiderで確認可能)
エンゲージメント率は、総エンゲージメントを総フォロワー数・リーチ・インプレッションいずれかで割り、100を掛けてパーセンテージで算出します。3パターンのエンゲージメント率計算をSocialinsiderダッシュボードで確認でき、オーディエンスのエンゲージ度を可視化できます。
エンゲージメント順の投稿ランキング(Socialinsiderで確認可能)
Socialinsiderダッシュボードの投稿セクションで、エンゲージメント順に上位投稿を一覧できます。さらに、下記で絞り込めます:
- エンゲージメント率
- 日付
- エンゲージメント/インプレッション率
- インプレッション
- クリック
- 視聴回数
傾向も分析して、どの投稿タイプが上位に残りやすいかパターンを見つけましょう。
インプレッション順のコンテンツフォーマット(Socialinsiderで確認可能)
Socialinsiderのインサイト内、インプレッションタブで投稿タイプ別インプレッション棒グラフが確認できます。リンクシェア、画像、動画、投票、ネイティブドキュメント、テキスト、カルーセル等のうち、どの投稿タイプが最もインプレッションを獲得しているか分かります。効果的な形式を増やしましょう。
動画視聴回数(Socialinsiderで確認可能)
Socialinsiderのエンゲージメントタブで様々な動画関連メトリクスを確認可能です。中でも重要なのが動画視聴回数です。
動画視聴回数は、ご自身の動画がどれだけの回数再生されたか表示します。LinkedInでは、3秒以上視聴されるとカウントされ、同じユーザーが複数回見てもそのたびにカウントされます。
さらに下記メトリクスも取得可能です:
- 動画ごとの平均視聴回数
- 総視聴時間
- 動画ごとの平均視聴時間
コンテンツピラー分析(Socialinsiderで確認可能)
コンテンツピラーは、ビジネスが発信する主要トピックです。Socialinsiderでは投稿をコンテンツピラーごとにタグ付けし、キャンペーンタブで管理できます。
これにより、どのコンテンツピラーがLinkedInで特に好調か把握できます。トピックによってLinkedIn向きと他プラットフォーム向きが分かれる場合もあるため、戦略調整に役立ててください。
次は、LinkedIn会社ページを確認しているユーザーの情報を知るために、ビジターアナリティクスを見ていきましょう。ネイティブダッシュボードで確認できます。
LinkedInビジターメトリクスの各セクションを順に見て、収集できるデータと戦略への活用方法を説明します。
ビジターアナリティクス
ビジターハイライトでは、次の3つの主要インサイトが分かります:
- ページビュー:会社ページの閲覧回数
- ユニークビジター:会社ページを訪れたユニークユーザー数
- カスタムボタンクリック:ページ上部カスタムボタンが、レポート期間中にクリックされた回数
このハイライトセクションで、会社ページ全体のパフォーマンスが一目で分かります。
ビジターメトリクス
このエリアでは、ページトラフィックを基にしたビジターメトリクスを確認できます。期間でフィルターをかけ、グラフの推移をリアルタイムで見られます。ページ各セクションの閲覧人数や、ページビュー回数、ユニークビジターも分かります。
ビジターデモグラフィック
ここでは、定期的にページを訪れているユーザーの属性を、プロフィールデモグラフィックから分析可能です。
詳細情報は:
- 職種
- 所在地
- 役職レベル
- 業種
- 企業規模
コンテンツが狙ったターゲット層に届いているか把握するのに役立ちます。
ライフページトラフィック
ライフページは、LinkedIn上で会社カルチャーを求職者へアピールするカスタムページです。会社の事業やスタッフ、雰囲気等を詳しく伝えられ、採用時期には特に有効です。
ライフページのパフォーマンスデータもビジタータブから取得できます。総ビジター数やユニークビジター数を確認し、ライフページが閲覧されているか追跡しましょう。
フォロワーアナリティクス
LinkedInネイティブアナリティクスダッシュボード3つ目のタブでは、「フォロー」ボタンを押してあなたの会社ページをフォローしているユーザーの詳細が分かります。
LinkedInアナリティクスツールで取得可能なフォロワーメトリクスを詳しく見ていきましょう。
フォロワーハイライト
ハイライトエリアで、LinkedInフォロワーについてすぐに分かるインサイトを取得できます。内容は:
- 総フォロワー数:プラットフォームで会社をフォローしている合計人数
- 新規フォロワー:過去30日間のフォロワー増加数と成長率
フォロワーメトリクス
このセクションでは、期間内のフォロワーの増減を折れ線グラフで可視化できます。増減が入れ替わる時もありますが、全体的な上昇傾向を目指しましょう。
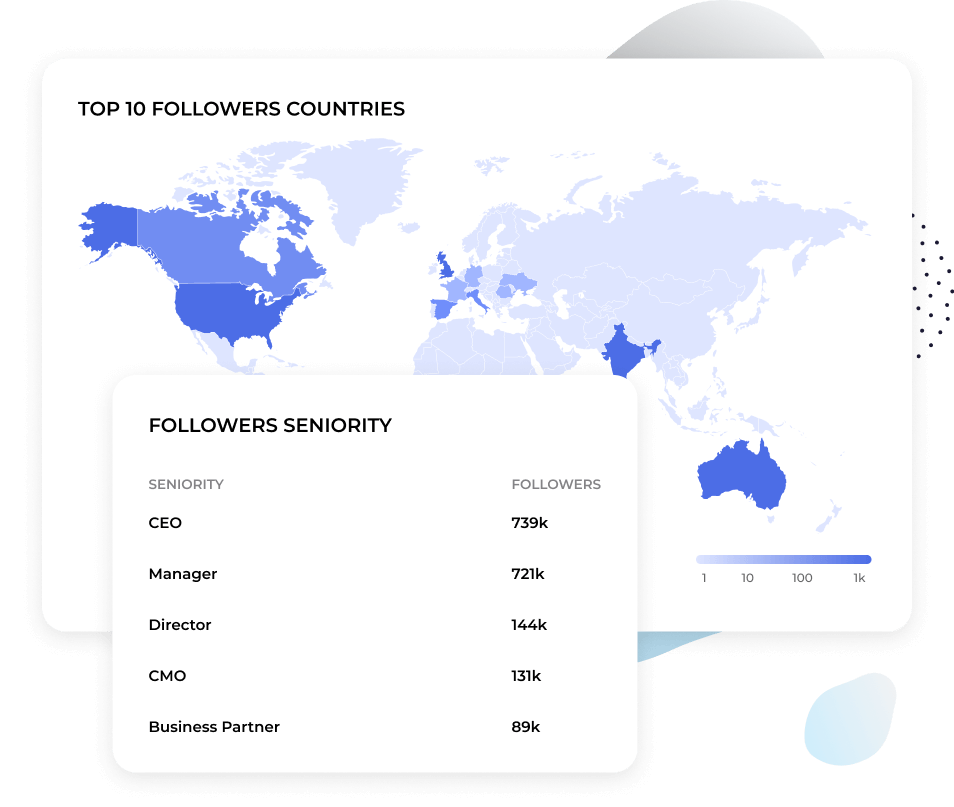
フォロワーデモグラフィック
このセクションは、ビジターデモグラフィックとほぼ同様の内容です。LinkedIn設定済みの属性情報から、フォロワーの詳細を把握できます:
- 職種
- 所在地
- 役職レベル
- 業種
- 企業規模
全フォロワー
このセクションには、会社ページのすべてのフォロワー及びその詳細情報、さらにフォロー日の新しい順で表示されます。
リードアナリティクス
LinkedInはプロフェッショナル向けネットワーキングプラットフォームなので、リード獲得も可能です。リード生成に特化したアナリティクスレポートも用意されています。
このセクションでは、実施中または実施済みのリードジェネレーションキャンペーン、作成日、ステータス、獲得リード数を確認できます。全リードのファイルをダウンロードし、CRMなどで育成も可能です。
ニュースレターアナリティクス
自社でLinkedInニュースレターを開始している場合は、このセクションも要チェックです。ニュースレターの成果把握に役立ちます。
LinkedInニュースレターアナリティクスで確認できるセクションを解説します。
トレンド
指定期間でのニュースレターのトレンドを確認できます。主な指標は:
- 記事ビュー:ニュースレターが閲覧された回数
- 新規登録者:ニュースレターに新たに登録した人数
成長の推移もグラフで表示されます。
記事トータル
このセクションでは、下記の主要指標も取得可能です:
- インプレッション:ニュースレターが獲得した全ビュー数
- エンゲージメント:ニュースレターのエンゲージメント総数
- 記事ビュー:記事が開かれて読まれた回数
購読者デモグラフィック
購読者を下記属性でフィルター可能です:
- 職種
- 所在地
- 役職レベル
- 業種
- 企業規模
新規購読者
最近登録した購読者を新しい順に表示します。プロフィールスニペットで役職や接続レベルを確認できます。
競合アナリティクス
続いては、LinkedIn競合アナリティクスです。まず比較対象とするページを追加してください。
その後、競合との成長比較に役立つ新しいセクションにアクセスできます。
競合ハイライト
過去30日間の投稿数やエンゲージメント率を競合と比較できます。
新規フォロワーメトリクス
このチャートで、過去30日間の新規フォロワー数を競合と比較できます。
オーガニックコンテンツメトリクス
競合内でのエンゲージメント総数と投稿総数ランキングも確認可能です。
従業員エンゲージメントアナリティクス
このセクションでは、従業員エンゲージメントにおいて追跡すべきメトリクスを提示します。従業員がプラットフォームでどれだけ積極的に活動しているか可視化されます。LinkedInはプロフェッショナル重視のため、従業員が勤務先ブランドを積極的に宣伝・言及するケースが多いです。
従業員エンゲージメント(Employee advocacy)は、チームメンバーが自社を積極的にPRする活動です。これにより、より広い層へのリーチ・リードや売上拡大が期待できます。
従業員エンゲージメントキャンペーンを運用したい場合も、このセクションを活用しましょう。主な内容は:
- 投稿している従業員数
- 従業員と交流しているLinkedInメンバー数
- 従業員向けにオススメされたコンテンツ
達成したい狙いによって、さまざまなメトリクスをここで追跡できます。
LinkedInで投稿アナリティクスを見るには?
プラットフォームの優れたレポーティング機能のひとつは、LinkedInの各投稿のアナリティクスを個別に確認できる点です。この機能は、LinkedIn自身のプラットフォーム内のコンテンツアナリティクス内にあるコンテンツエンゲージメントセクションに含まれます。
ここでは、投稿ごとにエンゲージメントデータがわかりやすいグラフで確認できます。次の情報が表示されます:
- 投稿タイトル
- オーディエンス
- ブースト有無
- 投稿者
- 作成日
- インプレッション
- 視聴回数
- クリック数
- CTR
- リアクション
- コメント
- リポスト
- フォロー数
- エンゲージメント率
- エンゲージメント
さらに、Socialinsiderのダッシュボードなら、これらすべての情報やそれ以上の内容も確認できます。投稿セクションに移動し、各投稿下部のアナリティクスを表示をクリックすれば、さらに詳細なLinkedInアナリティクスレポートを取得できます。
ここでは、次のような項目も確認できます:
- ハッシュタグ
- リアクション
- コメント
- シェア
- リーチ
- インプレッション
- リンククリック
- エンゲージメント
- エンゲージメント率
- エンゲージメント/インプレッション率
- エンゲージメントの時間別分布
さらに、Socialinsiderの投稿セクションでは、エンゲージメントやエンゲージメント率、クリック数など、さまざまなメトリクスで投稿を並べ替えて、最もパフォーマンスの高い投稿を簡単に見つけられます。
このように、上位投稿を順番に表示し、それぞれの詳細もすぐに確認できます。
LinkedInアナリティクスレポートの読み方
アナリティクスを分析したいけれど、レポートの読み方がわからないと感じていませんか?LinkedInでインサイトをしっかり理解するための分析方法について説明します。
まずはパフォーマンストラッキングから始めましょう。ここでは各投稿のパフォーマンスや、全体のLinkedInアナリティクスに関わる主なメトリクスを確認できます。
たとえば、次のような指標を見てください:
- トップ投稿
- 投稿タイプ
- 得られているリーチやエンゲージメント
- 前回レポート期間からリーチ・エンゲージメントがどれだけ増加したか
次に、オーディエンスのデモグラフィックに進んでください。以下のデータが参考になります:
- 総フォロワー数
- フォロワー増加数
- フォロワー属性
フォロワー数は見かけの数字と思われがちですが、成長の推移を見ることも大切です。それは、どれだけ多くの人があなたのビジネスやコンテンツに関心を持ち、実際にフォローしているかを示します。
次にコンテンツ最適化のアイデアも考えましょう。パフォーマンストラッキングですでに重要なメトリクスを確認しています。これらの情報から、
- 現状のコンテンツ戦略は効果を発揮しているか
- 他より高パフォーマンスな投稿タイプがあるか
- 高パフォーマンスなコンテンツをさらに多くシェアすることで戦略を最適化できるか
そして、LinkedIn広告予算も検討しましょう。さらにリーチやエンゲージメントを高めるため、ブーストしたい投稿はありませんか?既に成果の出ているコンテンツを強化することで、より多くのオーディエンスに届けることができます。
最後に、全体の戦略調整も見直してください。正しいオーディエンスにリーチできていますか?もしできていなければ、コンテンツが適切なターゲットに届くよう、どう軌道修正できるかを考えます。
以上の情報が、LinkedInのパフォーマンスを正しく把握し、データを適切に読み解き、アクションにつなげる一歩になります。
LinkedInアナリティクスデータをエクスポートする方法
LinkedInパフォーマンスレポートをエクスポートする方法は2つあります。LinkedInダッシュボード内、またはSocialinsiderのようなサードパーティのレポートツールを利用することができます。
LinkedInのデータを直接エクスポートするには、LinkedInアナリティクスダッシュボードにアクセスしてください。エクスポートしたいレポート(コンテンツ、訪問者、フォロワー、競合、リード、従業員アドボカシー)を選択し、該当するタブをクリックします。
その後、ダッシュボード右上のエクスポートボタンをクリックします。期間(直近1週間、1ヶ月、四半期など)を選択し、エクスポートを完了させます。
XLSファイル形式でレポートをダウンロードでき、Microsoft Excelで開いて編集や追加が可能です。
また、先ほどご紹介したように、Socialinsiderのような高機能なソーシャルメディアアナリティクスツールを使ってLinkedInデータをエクスポートすることもできます。アカウントにログインし、LinkedInプロフィールアナリティクスダッシュボードにアクセスしましょう。
利用可能な個別レポート(サマリー、コンテンツ、エンゲージメント、リーチ、インプレッション、オーディエンス、投稿、比較、キャンペーン)をエクスポートできます。まず、共有したい期間を選択します。次に、レポートダッシュボード右上のダウンロードボタンをクリックします。
レポートのダウンロード形式は、XLS(Microsoft Excel)、PDF(ドキュメント)、PPT(Microsoft PowerPoint)から選択できます。
追跡したい主要メトリクスをサマリーページにまとめて、PDFとしてエクスポートするのが、LinkedInパフォーマンスレポートを簡単に作成するもっとも手軽な方法です。必要な情報がすべて含まれているため、チームで追加作業は不要です。あとはエクスポートするだけで、すぐにプレゼンテーションが可能です。
個人のLinkedInプロファイルのアナリティクスはどのように確認できますか。
ご自身のLinkedIn個人プロフィールのパフォーマンスを確認したいですか?LinkedIn内でも確認できます。第三者のレポートツールで個人用のLinkedInアナリティクスを閲覧することはできませんが、LinkedInのツール内では基本的な概要を把握できます。
LinkedInプロフィールページを開き、アナリティクスセクションまでスクロールしてください。プロフィール画面から、過去1週間のプロフィールビュー数、投稿インプレッション数、検索表示回数を一目で確認できます。
すべてのアナリティクスを表示をクリックすると、さらに詳細が確認できます。
LinkedInプロフィールのアナリティクスでは、以下のインサイトを確認できます。
- 投稿インプレッション: 過去7日間であなたのLinkedIn投稿が何回インプレッションされたか、その%変化率も表示されます
- フォロワー: 現在のフォロワー数と、過去7日間でどれだけ増減したかが分かります
- プロフィールビューアー: 過去90日間にプロフィールを閲覧したユニークユーザー数です
- 検索表示回数: 直近1週間であなたのプロフィールが他のユーザーの検索結果に何回表示されたかが表示されます
また、プロフィールをアクティブに保つための推奨タスクや利用可能なクリエイターツールも管理できます。
LinkedInアナリティクスデータをさらに活用しましょう
Socialinsiderの無料トライアルを始めて、ネイティブLinkedInアナリティクスでは見えないデータを確認しましょう。