2026 Organic Facebook Engagement Benchmarks
Get the latest Facebook organic engagement benchmarks to understand its impact in the marketing world and better interpret your own metrics.

One of the questions I hear most often from social media leaders when reviewing their Facebook performance is simple: “are these numbers actually good?”
メトリクス単体、例えばエンゲージメント、視聴回数、コメント、フォロワー増加は、コンテキストがなければ大きな意味はありません。ここでFacebookオーガニックベンチマークが重要な役割を果たします。これにより、単なる数字を成果報告時に意味のあるインサイトへ変換できます。
Socialinsiderでは、130,000以上のビジネスページから2,500万件のFacebook投稿を分析しました。ブランドがこのプラットフォーム上でどのようにパフォーマンスしているかを把握するためです。このレポートでは、Facebookエンゲージメント率のベンチマーク、コンテンツ形式、インタラクション、投稿頻度、フォロワー数など、主要な指標を確認できます。
エグゼクティブサマリー
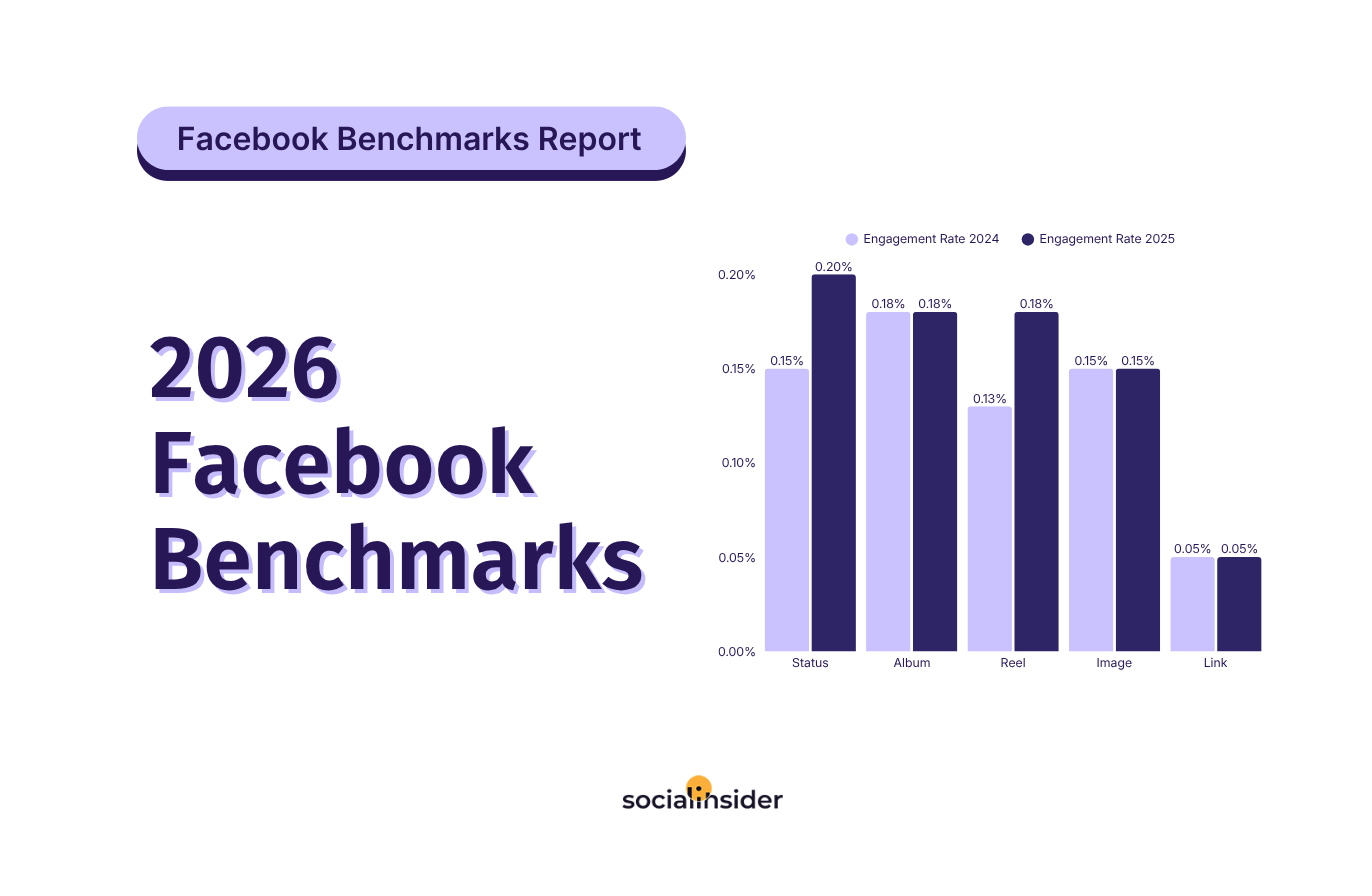
- Facebookの平均エンゲージメント率は現在0.15%で、前年比で横ばいです。
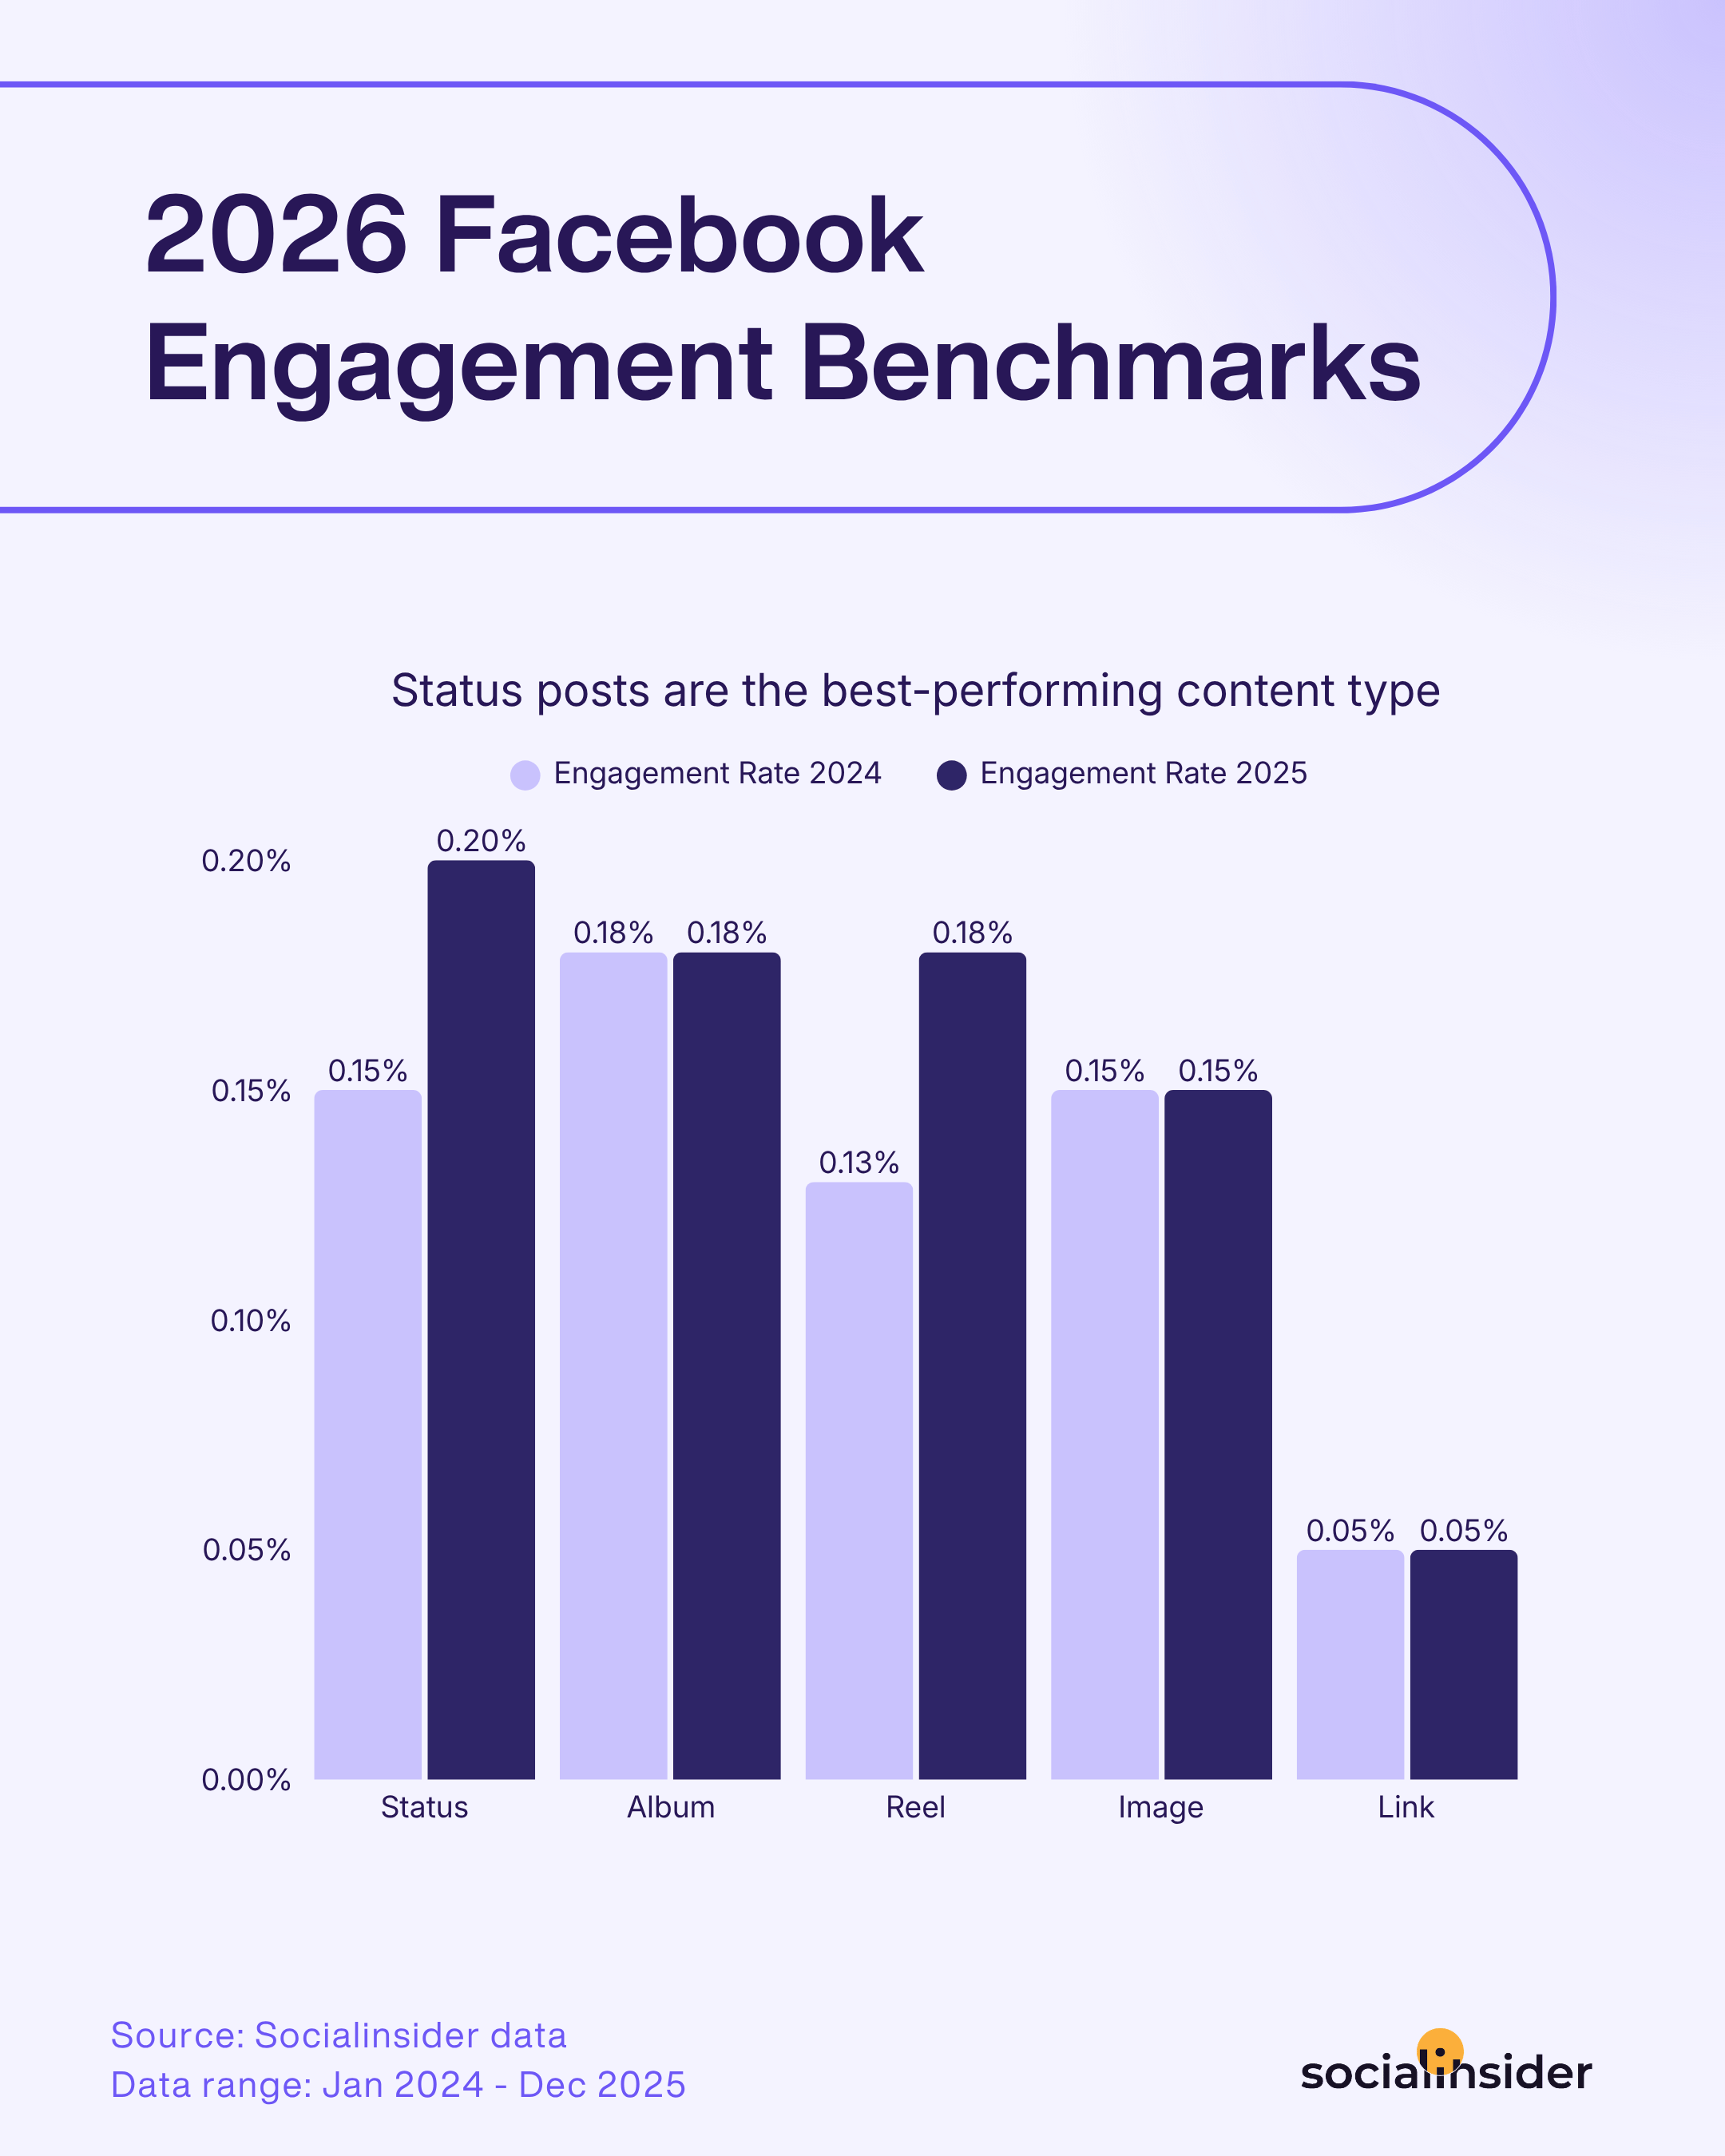
- ステータス投稿はFacebookで最も成果を上げるコンテンツフォーマットです。
- 小規模ページではアルバムが有利です。一方、中~大規模アカウントではステータス投稿がエンゲージメントを圧倒します。
- ステータス投稿はFacebook上で最も多くの会話を生み出します。
- アルバムは全てのFacebookページでシェアと視聴回数をリードします。
- 前年比で、ブランドは投稿数を22.00%減少させました。現在、平均して月に39件の投稿を行っています。
- Facebookのオーディエンス成長率は前年比で2倍になりました。2025年には12.20%から23.20%に増加しています。
Facebook四半期ベンチマーク
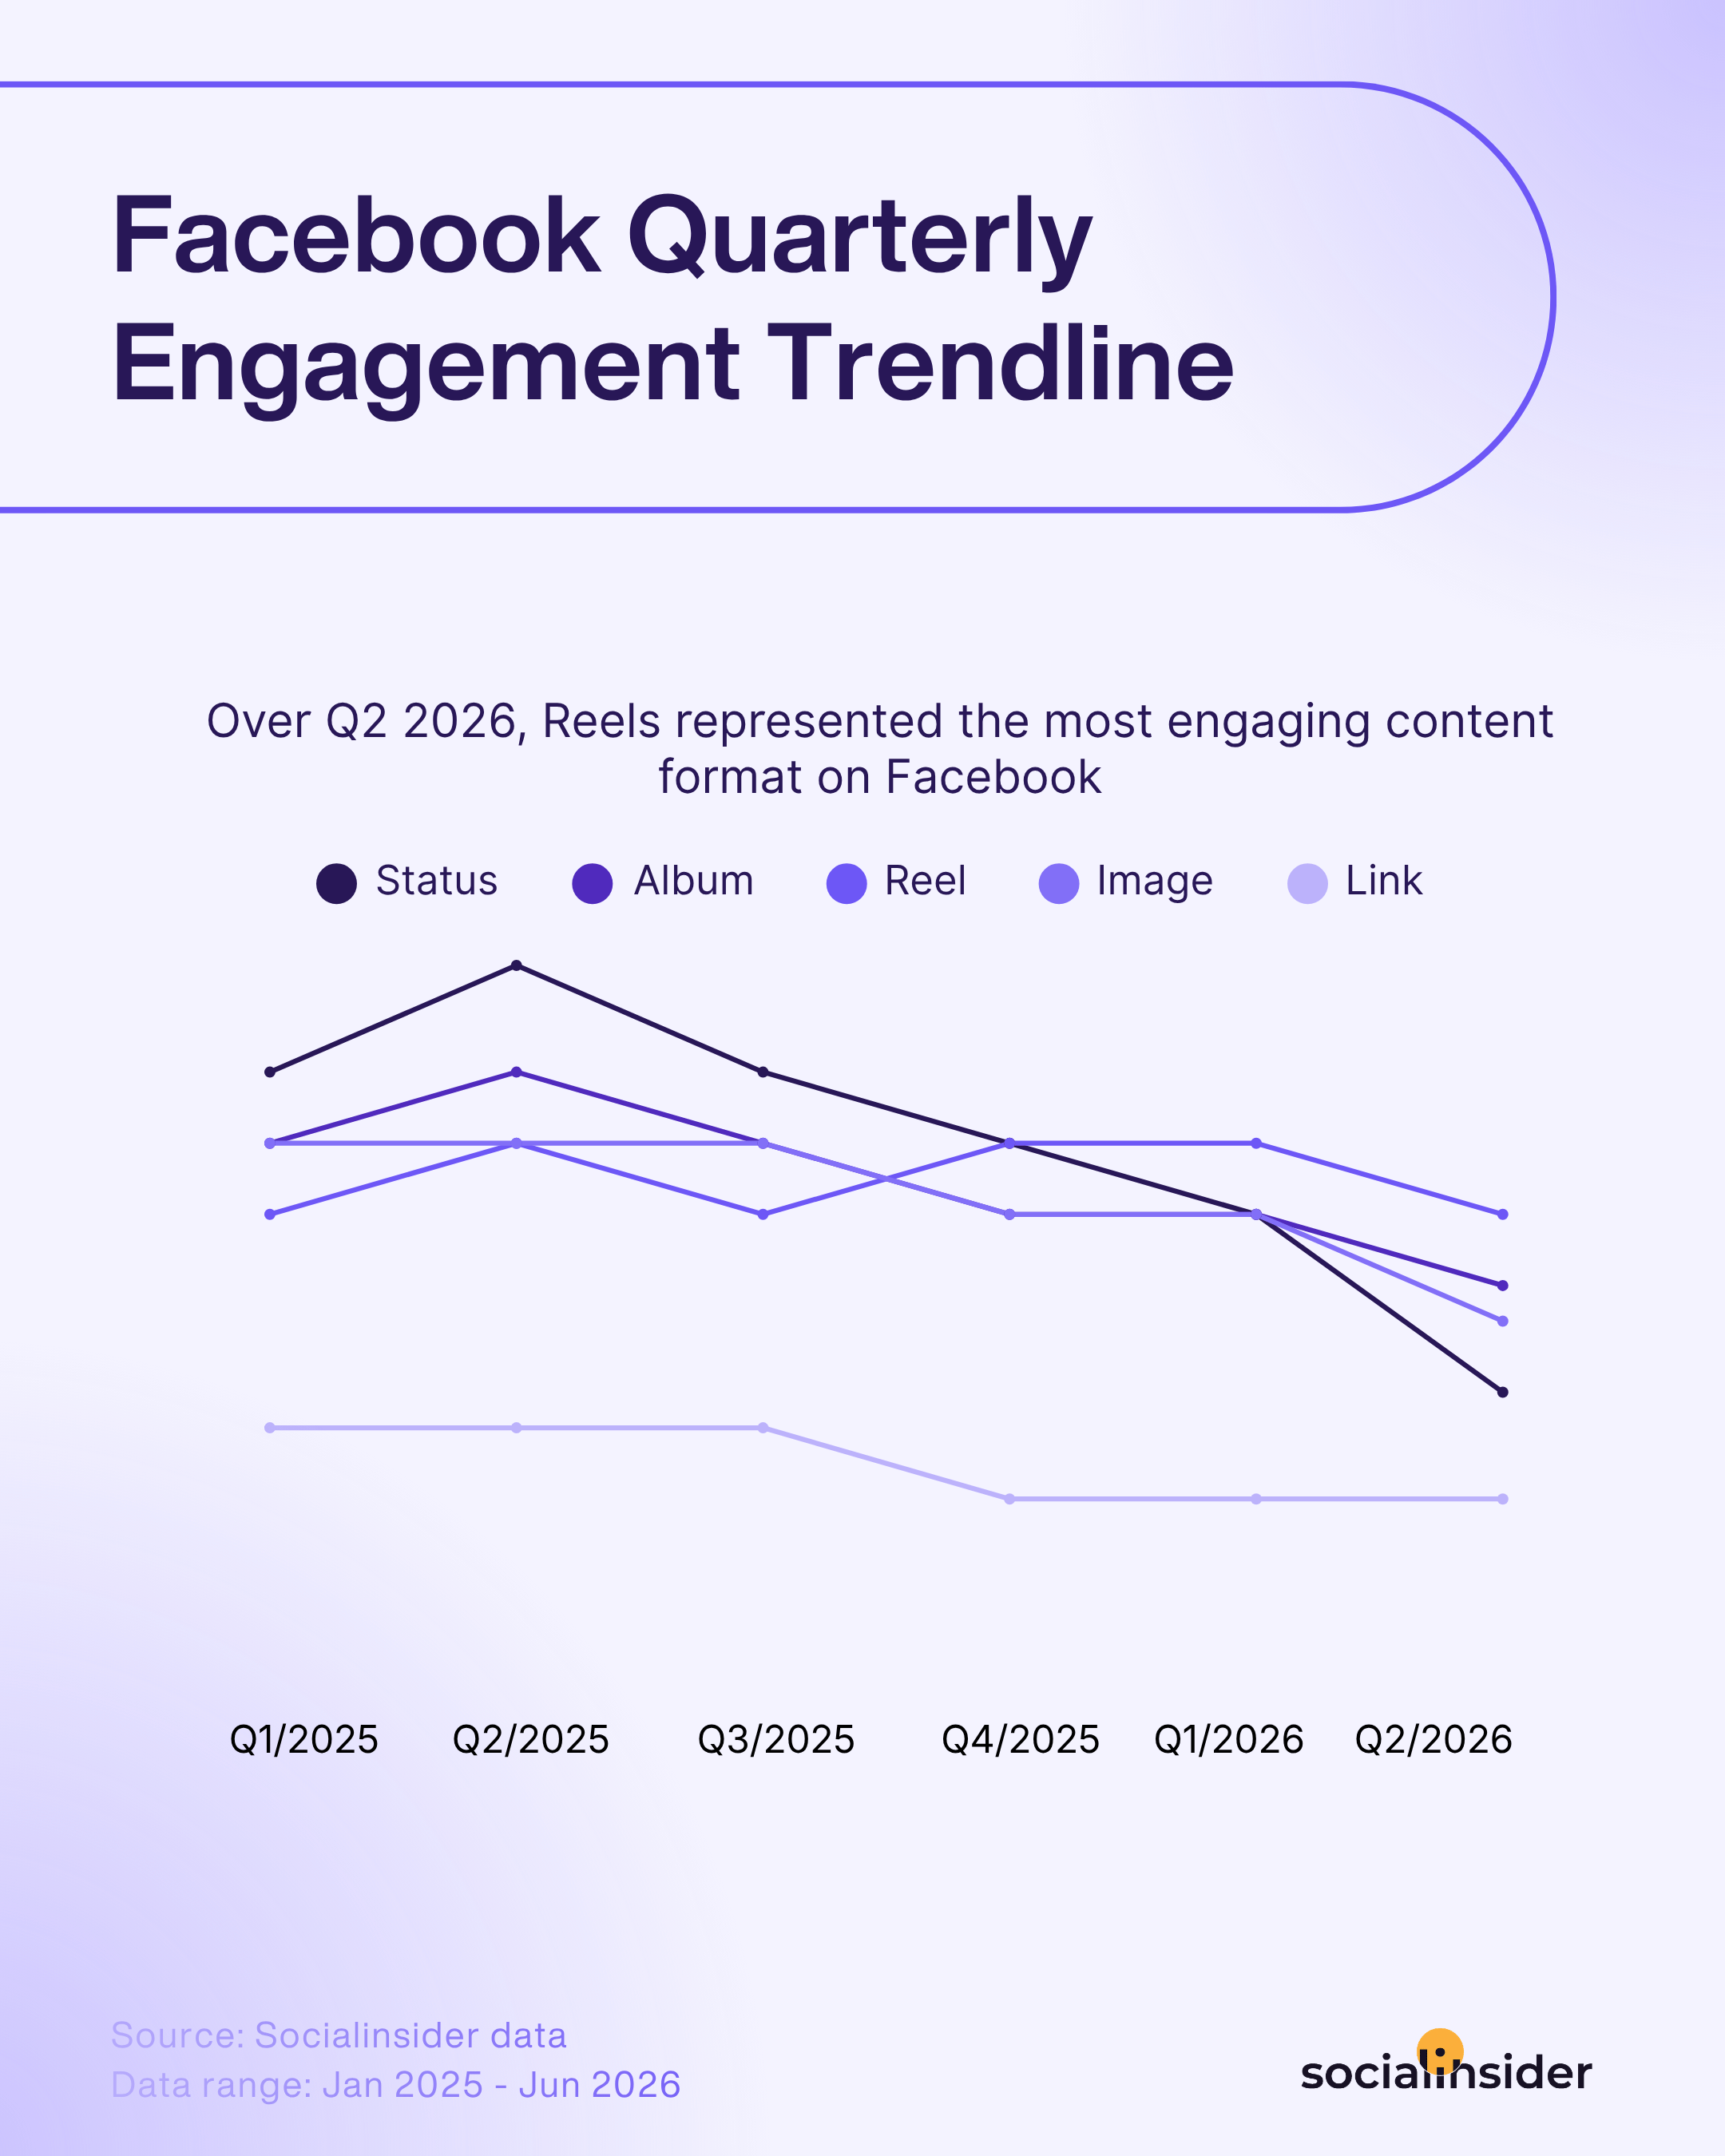
Facebook's engagement rate declined across nearly every content format in Q2 2026, with Reels falling to 0.13% (from 0.15% in Q1), but still remaining the most engaging format. To me, this is proof that Facebook continues to move further toward a video-first content ecosystem.
Looking at the full picture, this is how each content format performed in Q2 2026:
- リール: Reels have held the top engagement spot among Facebook's content formats through 2026, but they're also declining at a faster pace than the rest.
- アルバムポスト Albums followed a similar path, with engagement rate dipping to 0.11% in Q2 2026, down from 0.13% in Q1.
- 画像投稿: Images weren't spared either, with engagement rate down to 0.10% in Q2 2026, compared to 0.13% in Q1.
- ステータスポスト Status posts took the hardest hit, with engagement rate falling to 0.08% in Q2 2026 from 0.13% in Q1 — Facebook's steepest quarterly decline across any content format this year.
- リンク投稿: Links were the one exception, holding flat at 0.05% in Q2 2026, just as they did in Q1 — though that's mostly because they were already trailing every other format to begin with.
平均Facebookエンゲージメント率
Facebookは最も歴史のあるソーシャルメディアプラットフォームの一つで、今もブランドとオーディエンスの関わり方に影響を与えています。長年でFacebookにおける「成功」の定義は大きく変化しました。かつては、数千件のいいねを獲得することが究極のゴールでした。その後、みんながリーチを追い求め始めました。さらに後には、視聴回数が重要なKPIとなりました。
アルゴリズムの変化や新しいフォーマット、終わりのないフィード更新が続く中でも、ひとつだけ変わらないことがあります。それは、本物のエンゲージメントを築くことがブランドを際立たせる決定的な要素であることです。
かつてはいいねやページフォローを競う時代でしたが、今では本物のつながりや対話を築くことへと進化しています。プラットフォームは常に変化し続けているので、成功の定義も移り変わりやすくなっています。
だからこそ、Facebookのエンゲージメントベンチマークを見ることが非常に重要なのです。ベンチマークは、コンテンツが実際に成果を上げているかを判断する明確な基準となります。
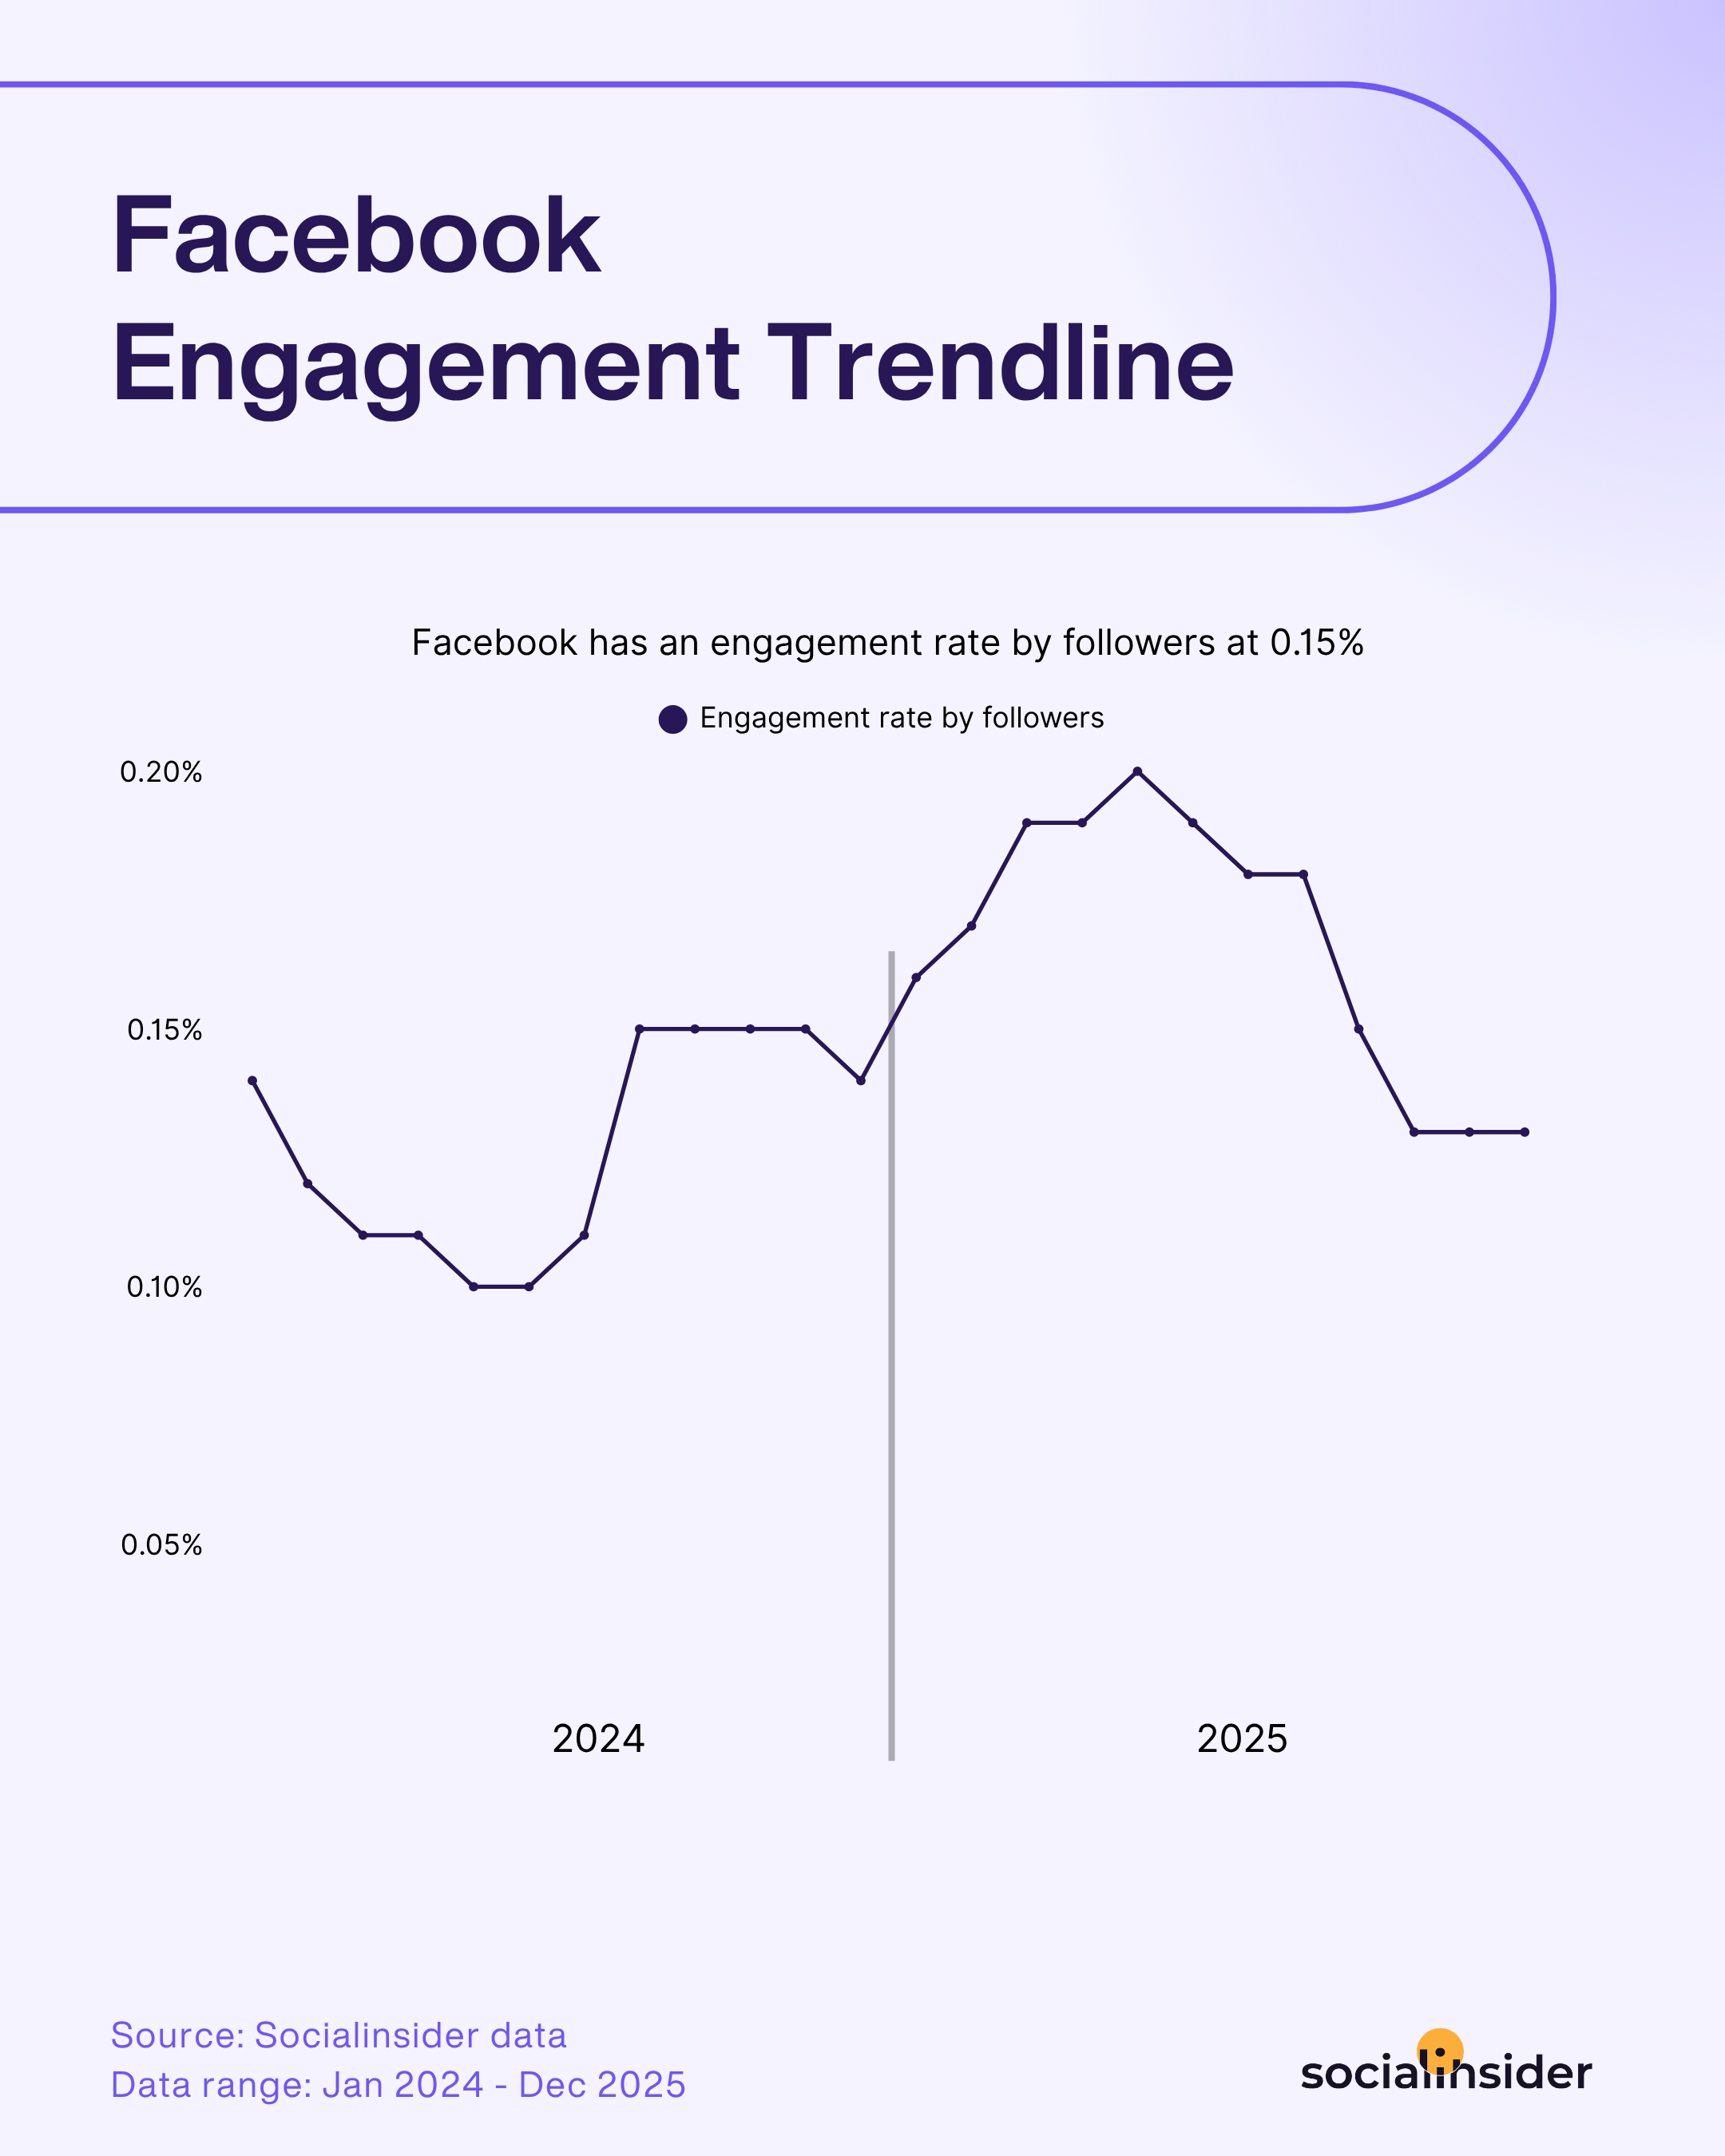
では、現在のFacebookにおけるエンゲージメントはどうなっているのでしょうか。最新のSocialinsiderデータによると、Facebookの平均エンゲージメント率は現在0.15%です。
しかし、平均値だけでは全体を把握できません。
エンゲージメントをコンテンツ形式ごとに分けると、興味深い違いが見えてきます。特に際立つ結果もあります。
ステータス投稿は最も高いエンゲージメント率を生み出します。2024年の0.15%に対して、2025年は0.20%に達します。
それは意外ですよね?
ソーシャルメディアのパフォーマンスに関する多くの議論で動画が注目を集めているため、リールのようなフォーマットがエンゲージメントをリードすると考えがちです。しかし、データによると少し異なる傾向が見られます。
シンプルなステータス投稿は、自然とインタラクションを生みます。意見の共有や素早いリアクション、会話への参加を促します。これが他のフォーマットよりも高い成果につながる理由です。
現在のFacebookでは、最も制作されたコンテンツではなく、最も参加型のコンテンツが勝ちます。シンプルなステータス投稿は、ユーザーのリラックスした気持ちに寄り添い、手間をかけず、すぐにインタラクションを誘います。ちょっとした考えや質問、ひと言の投稿だけでコメントが生まれます。コメントは意味のあるエンゲージメントを示す最も明確なサインです。
動画にも役割はありますが、多くのユーザーはフィード内で時間や注意をあまり割いていません。一方、ステータス投稿は人間味があり、親しみやすく、会話的です。ブランドというより友人からの投稿のように感じます。- Heather Brinckerhoff、Vice President Social media and Digital Content、Great American Media
Facebookエンゲージメントを高める戦略的な戦術
- ステータス投稿で率直かつ意見を求める質問をしてください。テキスト更新は自然に会話を生みます。ディスカッションを活性化させましょう。
- 共感を呼ぶ体験を反映したコンテンツを投稿してください。業界の悩みやよくあるミスに触れると、リアクションやコメントが増えます。
- 短いテキストフックを試してみましょう。「異論あり:」のような一文で始まる投稿は、読者に意見を促すため、成果を上げることが多いです。
- プロモーションコンテンツは会話調にしましょう。 何かを宣伝する際も、営業メッセージではなくディスカッションやインサイトとして伝えます。
エンゲージメント率が横ばいでも、ブランドがオーディエンスを理解していないとは限りません。コンテンツやアプローチが停滞している場合もあります。パフォーマンスを向上させるには、クリエイティブを進化させたり、より強力なフックや個性的なストーリーテリング、オーディエンスのプラットフォーム上でのエンゲージメントに合ったフォーマットをテストすることが重要です。
継続的な最適化も鍵となります。保存やシェアなどのパフォーマンスシグナルを使い、コンテンツを時間をかけて洗練し、効果の高いものに注力してください。
最終的には、過去にうまくいった方法に頼り続けるのではなく、常に表現方法を刷新し続けることです。- Daisy Castle(ソーシャルメディアマネージャー)TUI
平均Facebookいいね数
エンゲージメント率がオーディエンスがコンテンツとどれだけ積極的に関わっているかを示すなら、いいねもまた役立つインサイトを提供します。いいねは投稿への最初で最も簡単なインタラクションです。ワンタップで、直感的な賛同のサインとなります。小さなアクションですが、数が増えればコンテンツがさまざまなFacebookページでどれだけ響いているかが分かります。
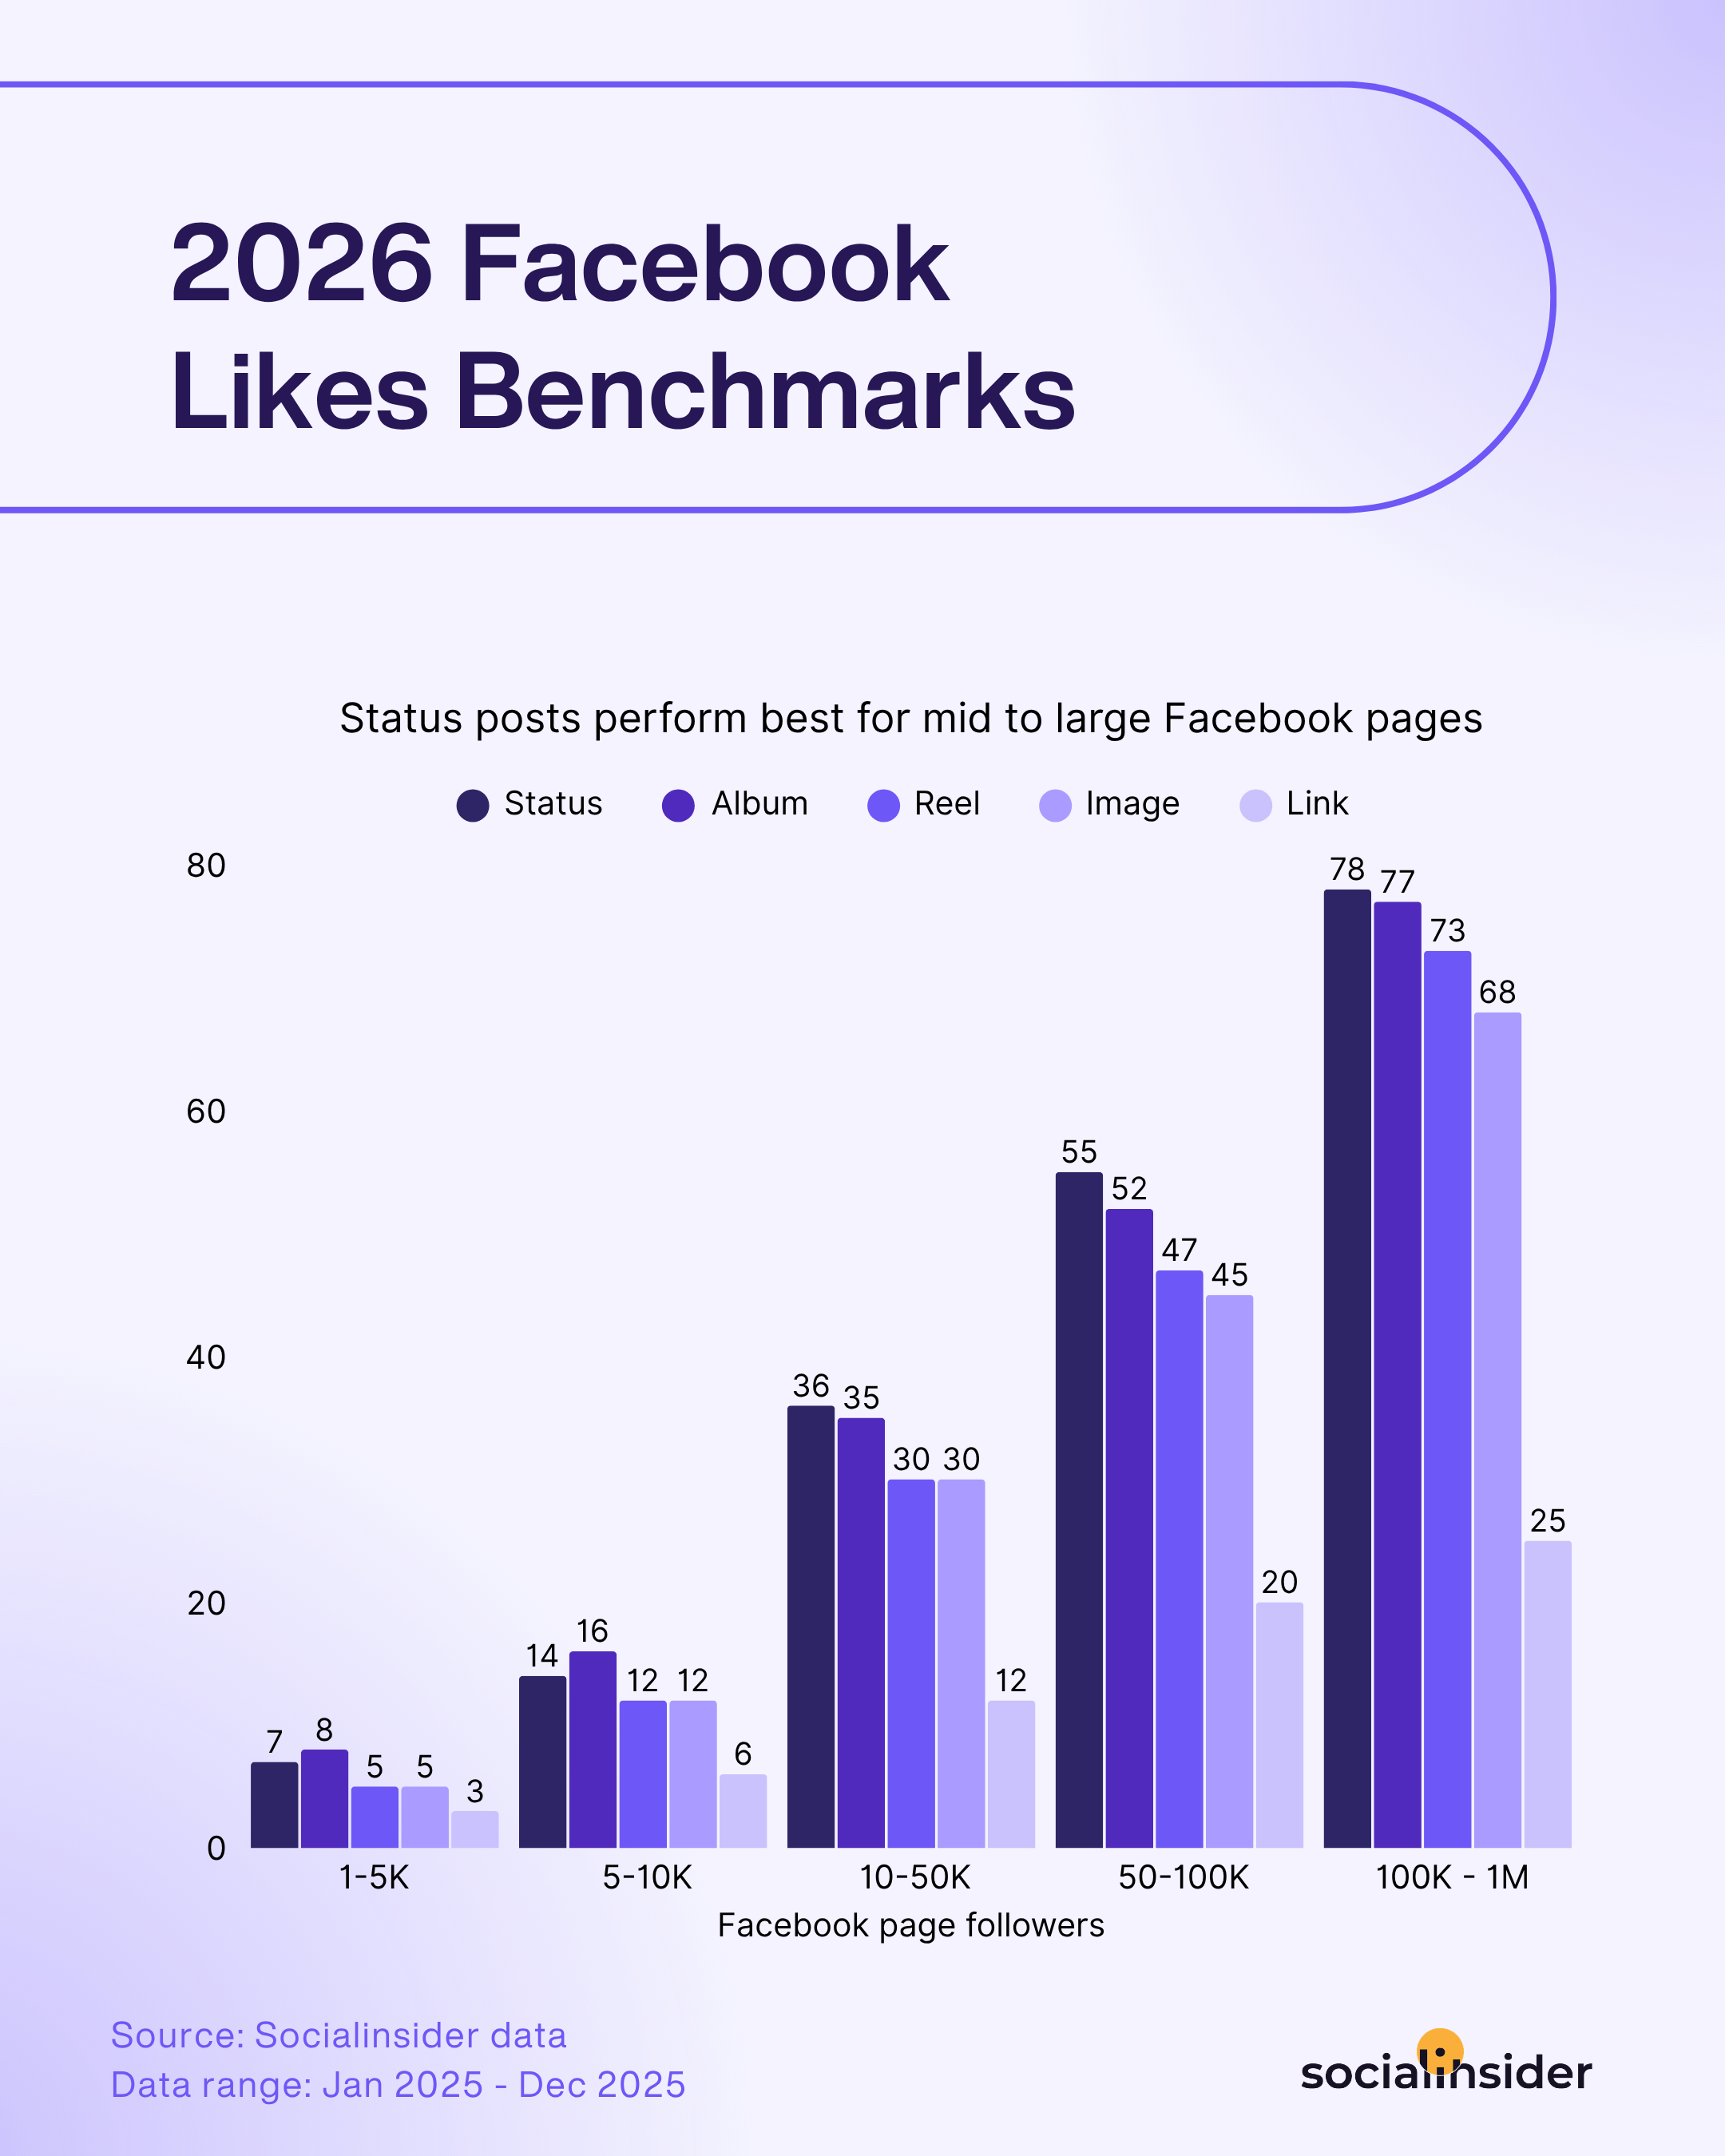
最新のFacebookエンゲージメントベンチマークを分析すると、ひとつはっきりしたことがあります。ページサイズは投稿が通常獲得するいいね数に大きく影響します。
フォロワーが10,000人未満の小規模なFacebookページでは、アルバム投稿が他のコンテンツタイプよりも最も多くのいいねを獲得しやすいです。アルバムは複数のビジュアルをひとつの投稿にまとめることで、よりリッチなコンテンツを提供します。閲覧者の興味を引き、反応を促します。
しかし、ページがフォロワー数10,000人を超えると、傾向が変わり始めます。
そこからは、ステータスポストが他のフォーマットよりも一貫して多くのいいねを獲得します。シンプルなテキストの投稿は、会話調で書かれることが多いため、特に大規模なコミュニティでは迅速な反応が得やすく、やりとりもしやすいです。
Facebookユーザーは疲れています。売り込まれることも、作り込みすぎたコンテンツも、もう必要ありません。まして、なぜ自分が気にかけるべきかを説明する90秒のブランド動画も望んでいません。ステータスポストが効果的なのは、人間らしさを感じるからです。マーケティングチームの投稿には見えません。プラットフォームは長年ビデオを推進し、ブランドもそれに従いました。その結果、誰のフィードも同じようなコンテンツで溢れています。一番シンプルなフォーマットが勝ち残ったのは、それだけが人間味を持ち続けているからです。- Carolina Barbosa、シニアソーシャルストラテジスト
Facebookのいいねを増やすための戦略的な施策
- フォーマットをオーディエンスの規模に合わせましょう。 フォロワーが10,000人未満の場合は、アルバムをより多く試してみてください。製品セットやイベントハイライト、ステップごとのビジュアルなど、ビジュアルのコレクションは小規模コミュニティで注目されやすく、いいねも増えます。
- 共感や体験ベースのコンテンツを投稿しましょう。 業界の苦労やよくあるミス、日常のワークシーンなど、共通の経験を反映した投稿は、メッセージに自分自身を重ねやすく、素早い反応を引き出します。
- マイクロエンゲージメントを促しましょう。 「同意ならいいね」や「心当たりがあれば👍を」などシンプルなアクションを促すことで、フォロワーが気軽に反応できます。
平均Facebookコメント数
年々、コメントはFacebookでコンテンツのパフォーマンスを示す重要な指標となっています。オーディエンスが増加すると共に、ユーザーの行動も変化しています。多くの人がフィードを素早くスクロールし、いいねで反応して次へ進みます。
だからこそ、今コメントが非常に重要な役割を持っています。
誰かがコメントを残すために時間を割く場合、そのコンテンツが本当に心に響いた証拠です。立ち止まり、自分が見たものについて考え、会話に加わりたいと感じたのです。受動的な消費が当たり前になっている今、コメントははるかに強いエンゲージメントを表します。
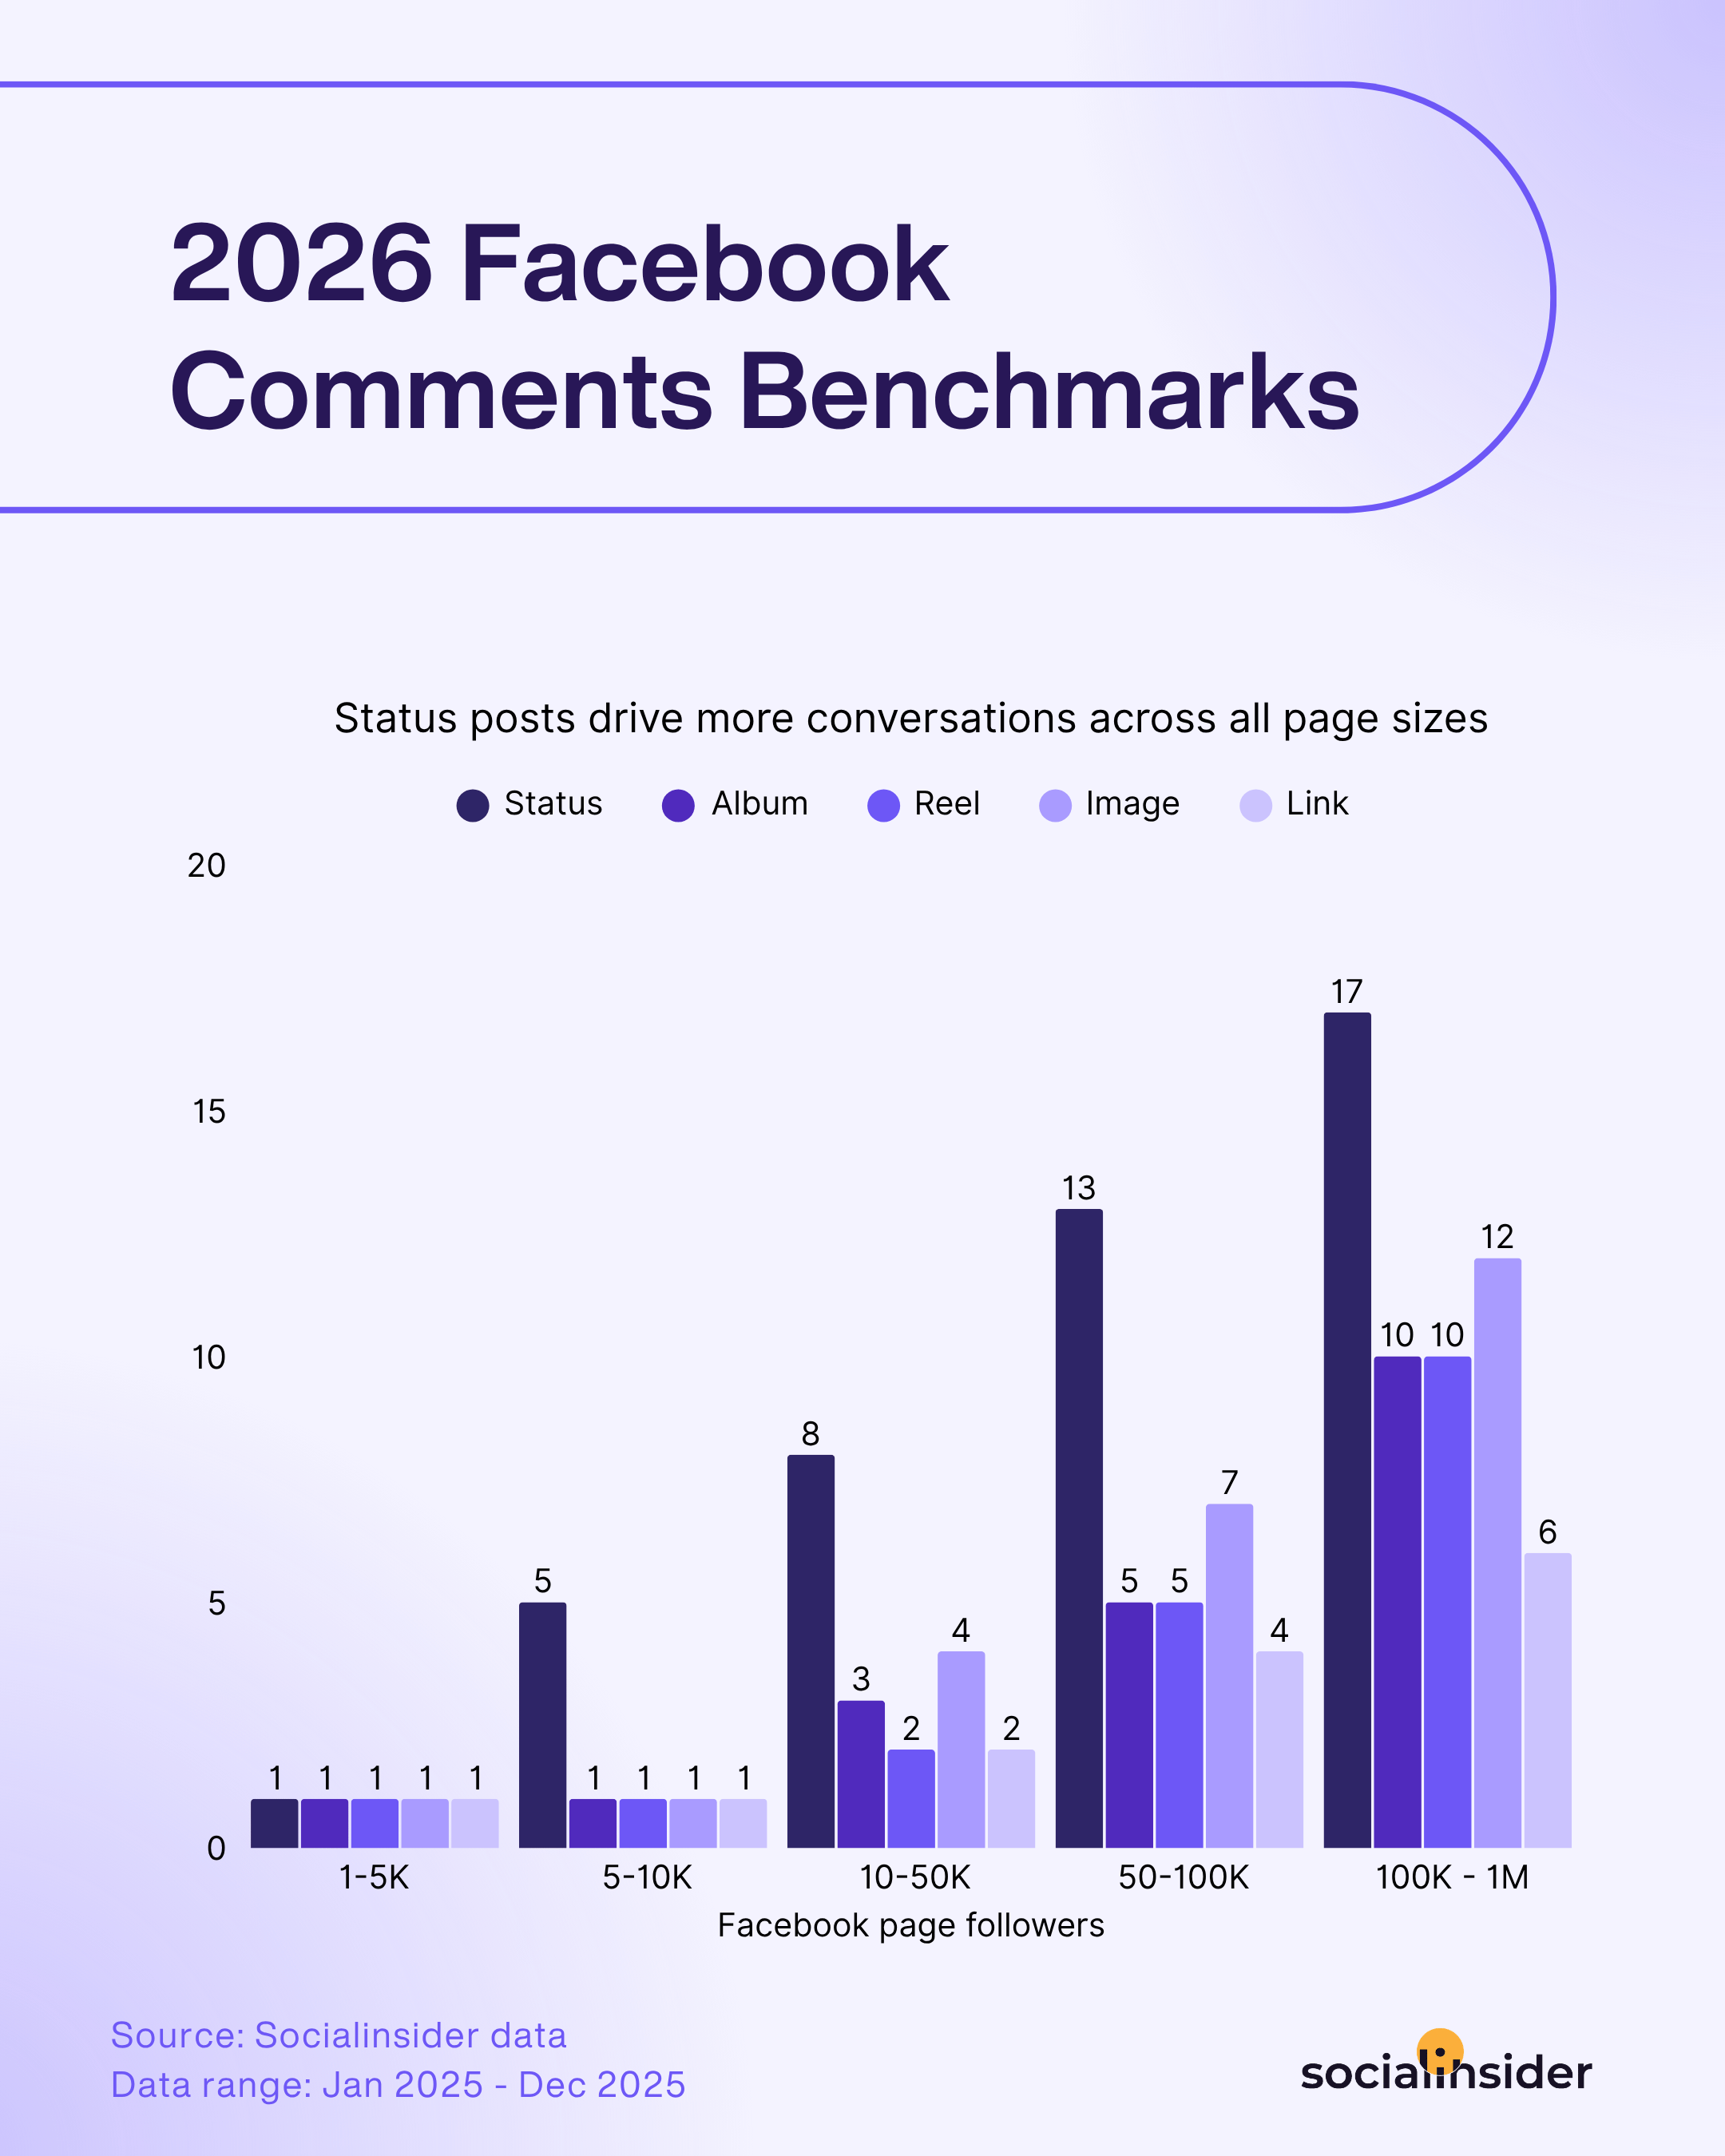
Facebookで異なるページ規模やコンテンツ形式ごとの平均コメント数を見ると、ある傾向がはっきりと見えてきます。
ステータス投稿は常に最も多くのコメントを生み出します。
Unlike other formats, status updates naturally invite discussion. They often take the form of opinions, questions, or short reflections—content that encourages people to respond, share their own experiences, or react to a point being made. In many ways, status posts behave more like conversation starters than traditional pieces of content.
This becomes even more noticeable as page size grows. Larger audiences tend to amplify discussions around text-based posts, where followers can easily jump into the conversation without needing to interpret visuals or watch a video first.
Strategic tactics to increase your Facebook comments
- 軽いディベートを作成しましょう。 Present two options and ask followers to choose a side. Friendly debates naturally drive comment threads.
- 追加の質問で返信しましょう。 コメントがあったら、ただ返事をするのではなく、さらに質問してください。これによりスレッドが伸び、議論が続きます。
- 大胆な意見や“ホットテイク”を共有しましょう。 業界トピックに明確な立場を示す投稿は、フォロワーによる賛否や新たな視点を引き出します。
受動的にスクロールしているユーザーを、積極的にコメントする状態へと動かすには、心理的な強い反応を引き出し「行動する価値がある」と感じさせる必要があります。人々がスクロール習慣を破るのは、強い共感や激しい憤りなど高揚感のある感情、もしくは専門知識を披露したい、自分の体験を共有したいというアイデンティティを示したい欲求が主な理由です。
これを活かすには、参加のハードルを下げることが重要です。一般的な質問は効果が薄いですが、極めて具体的で簡単なプロンプト(例:二者択一や穴埋め形式)はエンゲージメントを促しやすくします。さらに、共感しやすいコンテンツを作ることで、ユーザーは気軽に友達をタグ付けしやすくなり、投稿がソーシャル通貨となってインタラクションの主要なメトリクスも自然に高まります。- Madeleine Brice(ソーシャルメディアマネージャー, We Are Social)
平均Facebookシェア数
シェアはエンゲージメントの中でも少し異なる種類です。いいねやコメントは、オーディエンスがコンテンツにどう反応したかを示します。シェアはさらに強い意味を持ち、投稿が価値ある、または興味深いと感じて自分のネットワークに共有していることを示します。
シェアは多くの場合、推薦の一形態です。誰かが投稿をシェアすると、そのコンテンツに関わるだけでなく、投稿を元のオーディエンスの枠を超えて広めています。
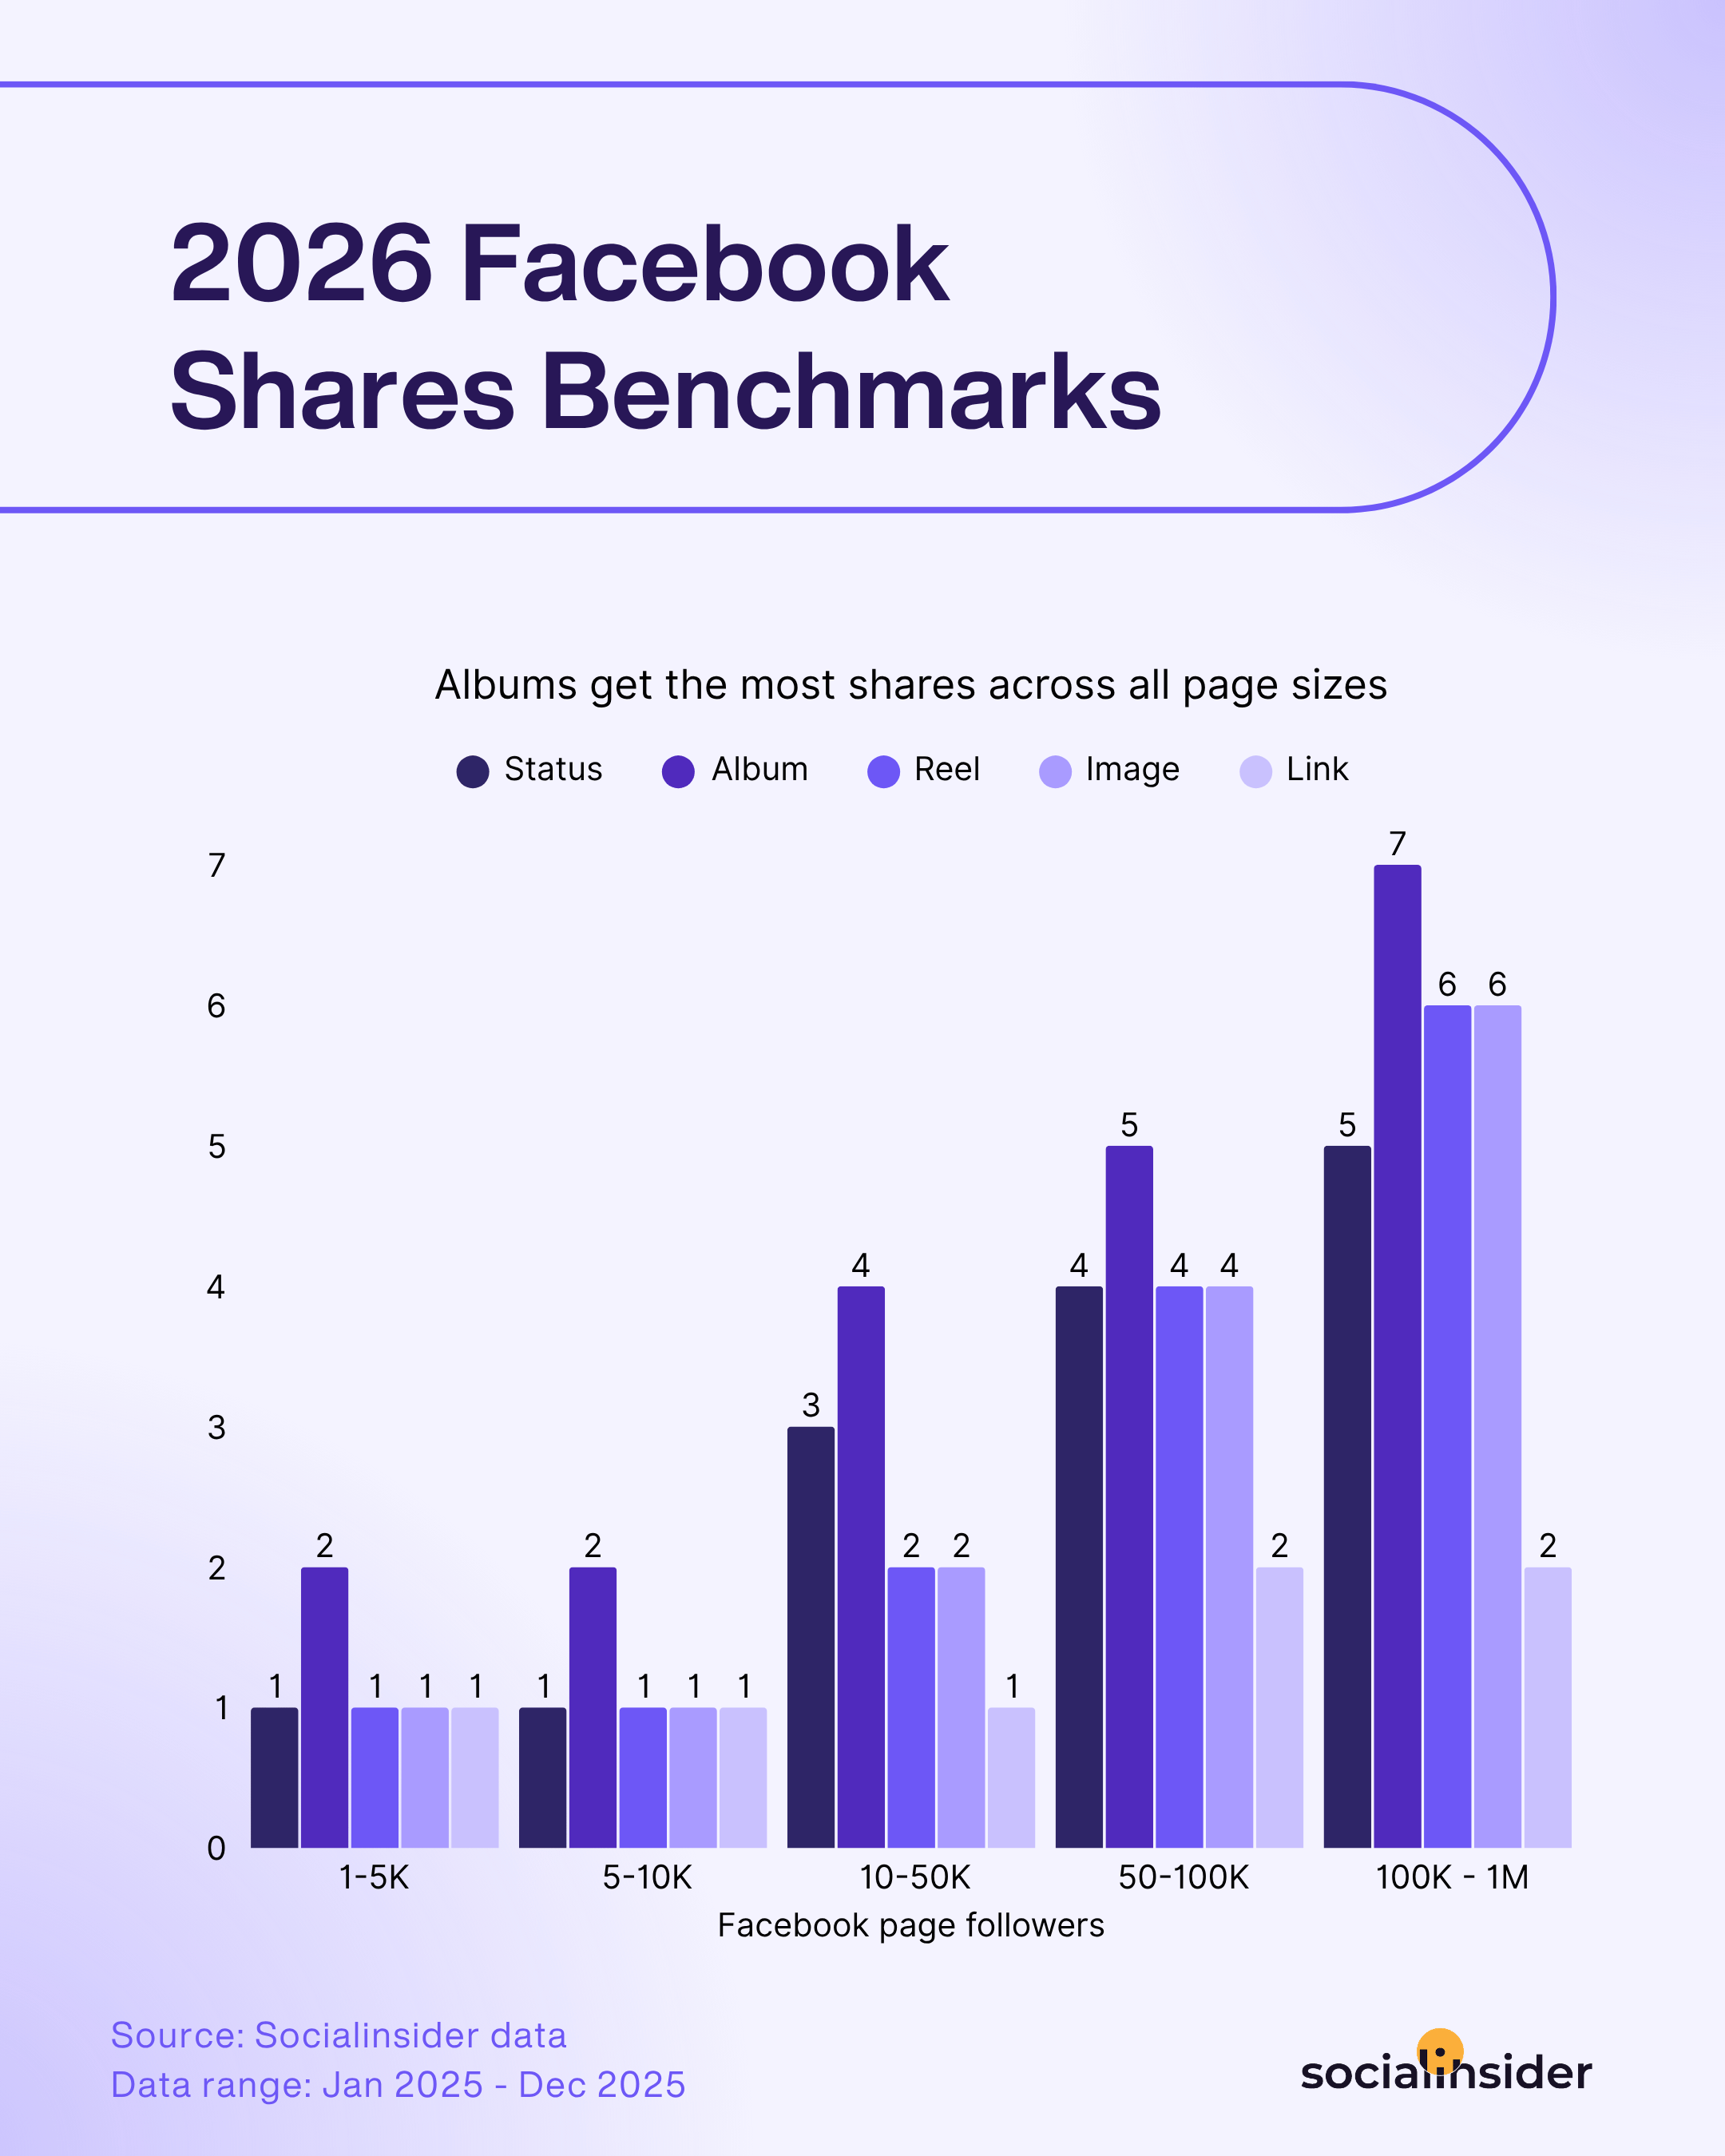
さまざまなコンテンツ形式におけるFacebookの平均シェア数を見たところ、はっきりとした傾向が分かりました。ほぼすべてのページ規模で、アルバムが最も多くのシェアを生み出しています。
一見したところ、少し意外に思えるかもしれません。多くのマーケターは、シェアされやすいコンテンツは主にショート動画や手軽なビジュアル投稿にあると考えています。しかし、アルバムには特別な強みがあります。複数のビジュアルを一つのまとまったストーリーとしてブランドが届けることができるのです。
一枚の画像だけを見せるのではなく、アルバムはオーディエンスにより多くの文脈を提供します。商品紹介、イベントのまとめ、手順の説明やビジュアルのキュレーションなどに活用できます。この豊かなストーリーテリング形式が、コンテンツをより有用にし、最終的にはシェアされやすくします。
アルバムは他のフォーマットよりもリーチで優れています。その理由は、多くの投稿とは異なり、閲覧者の注意を長く引きつけるからです。スワイプごとにシグナルが生まれ、アクティブなエンゲージメントが加算されます。単発のインタラクションではなく、アルバムは一連のマイクロインタラクションを作り、アルゴリズムにこのコンテンツを表示し続ける価値があると伝えます。
さらに、滞在時間も伸びます。ユーザーは一目見て離れるのではなく、じっくりとアルバムを探索します。注意が分散するフィード内では、この追加の滞在時間が重要です。
同時に、アルバムは関連性も高めます。複数の画像があることで、多様な閲覧者が興味を持つきっかけが増えます。そのため、立ち止まる・エンゲージメントする・再訪する可能性が上がります。 - Heather Brinckerhoff、Vice President Social media and Digital Content, Great American Media
Facebookのシェアを増やすための戦略的な施策
- 「保存してシェア」されるコンテンツを作成しましょう。 教育的な投稿やヒント、ビジュアルガイドは役立つリソースとして認識されるため、シェアされやすいです。
- アルバムでビジュアルストーリーを伝えましょう。 1枚だけでなく、関連するビジュアルをまとめて掲載しましょう。たとえば商品のバリエーションやイベントのハイライトなどが効果的です。
- さりげなくシェアを促しましょう。「役立つ方にシェアしてください」といった一言で、広がる可能性が高まります。
Facebookの平均視聴回数
視聴回数は、コンテンツがFacebookでどれだけ広がったかを示す最も明確な指標の一つです。エンゲージメントのメトリクスが投稿への反応を示す一方、視聴回数はコンテンツがどれだけ見られているか、つまりどれだけの可視性を獲得したかを示します。
年々フィードが混雑する中、可視性は非常に重要です。より多くの人に投稿が表示されることで、エンゲージメントにつながるチャンスも高まります。
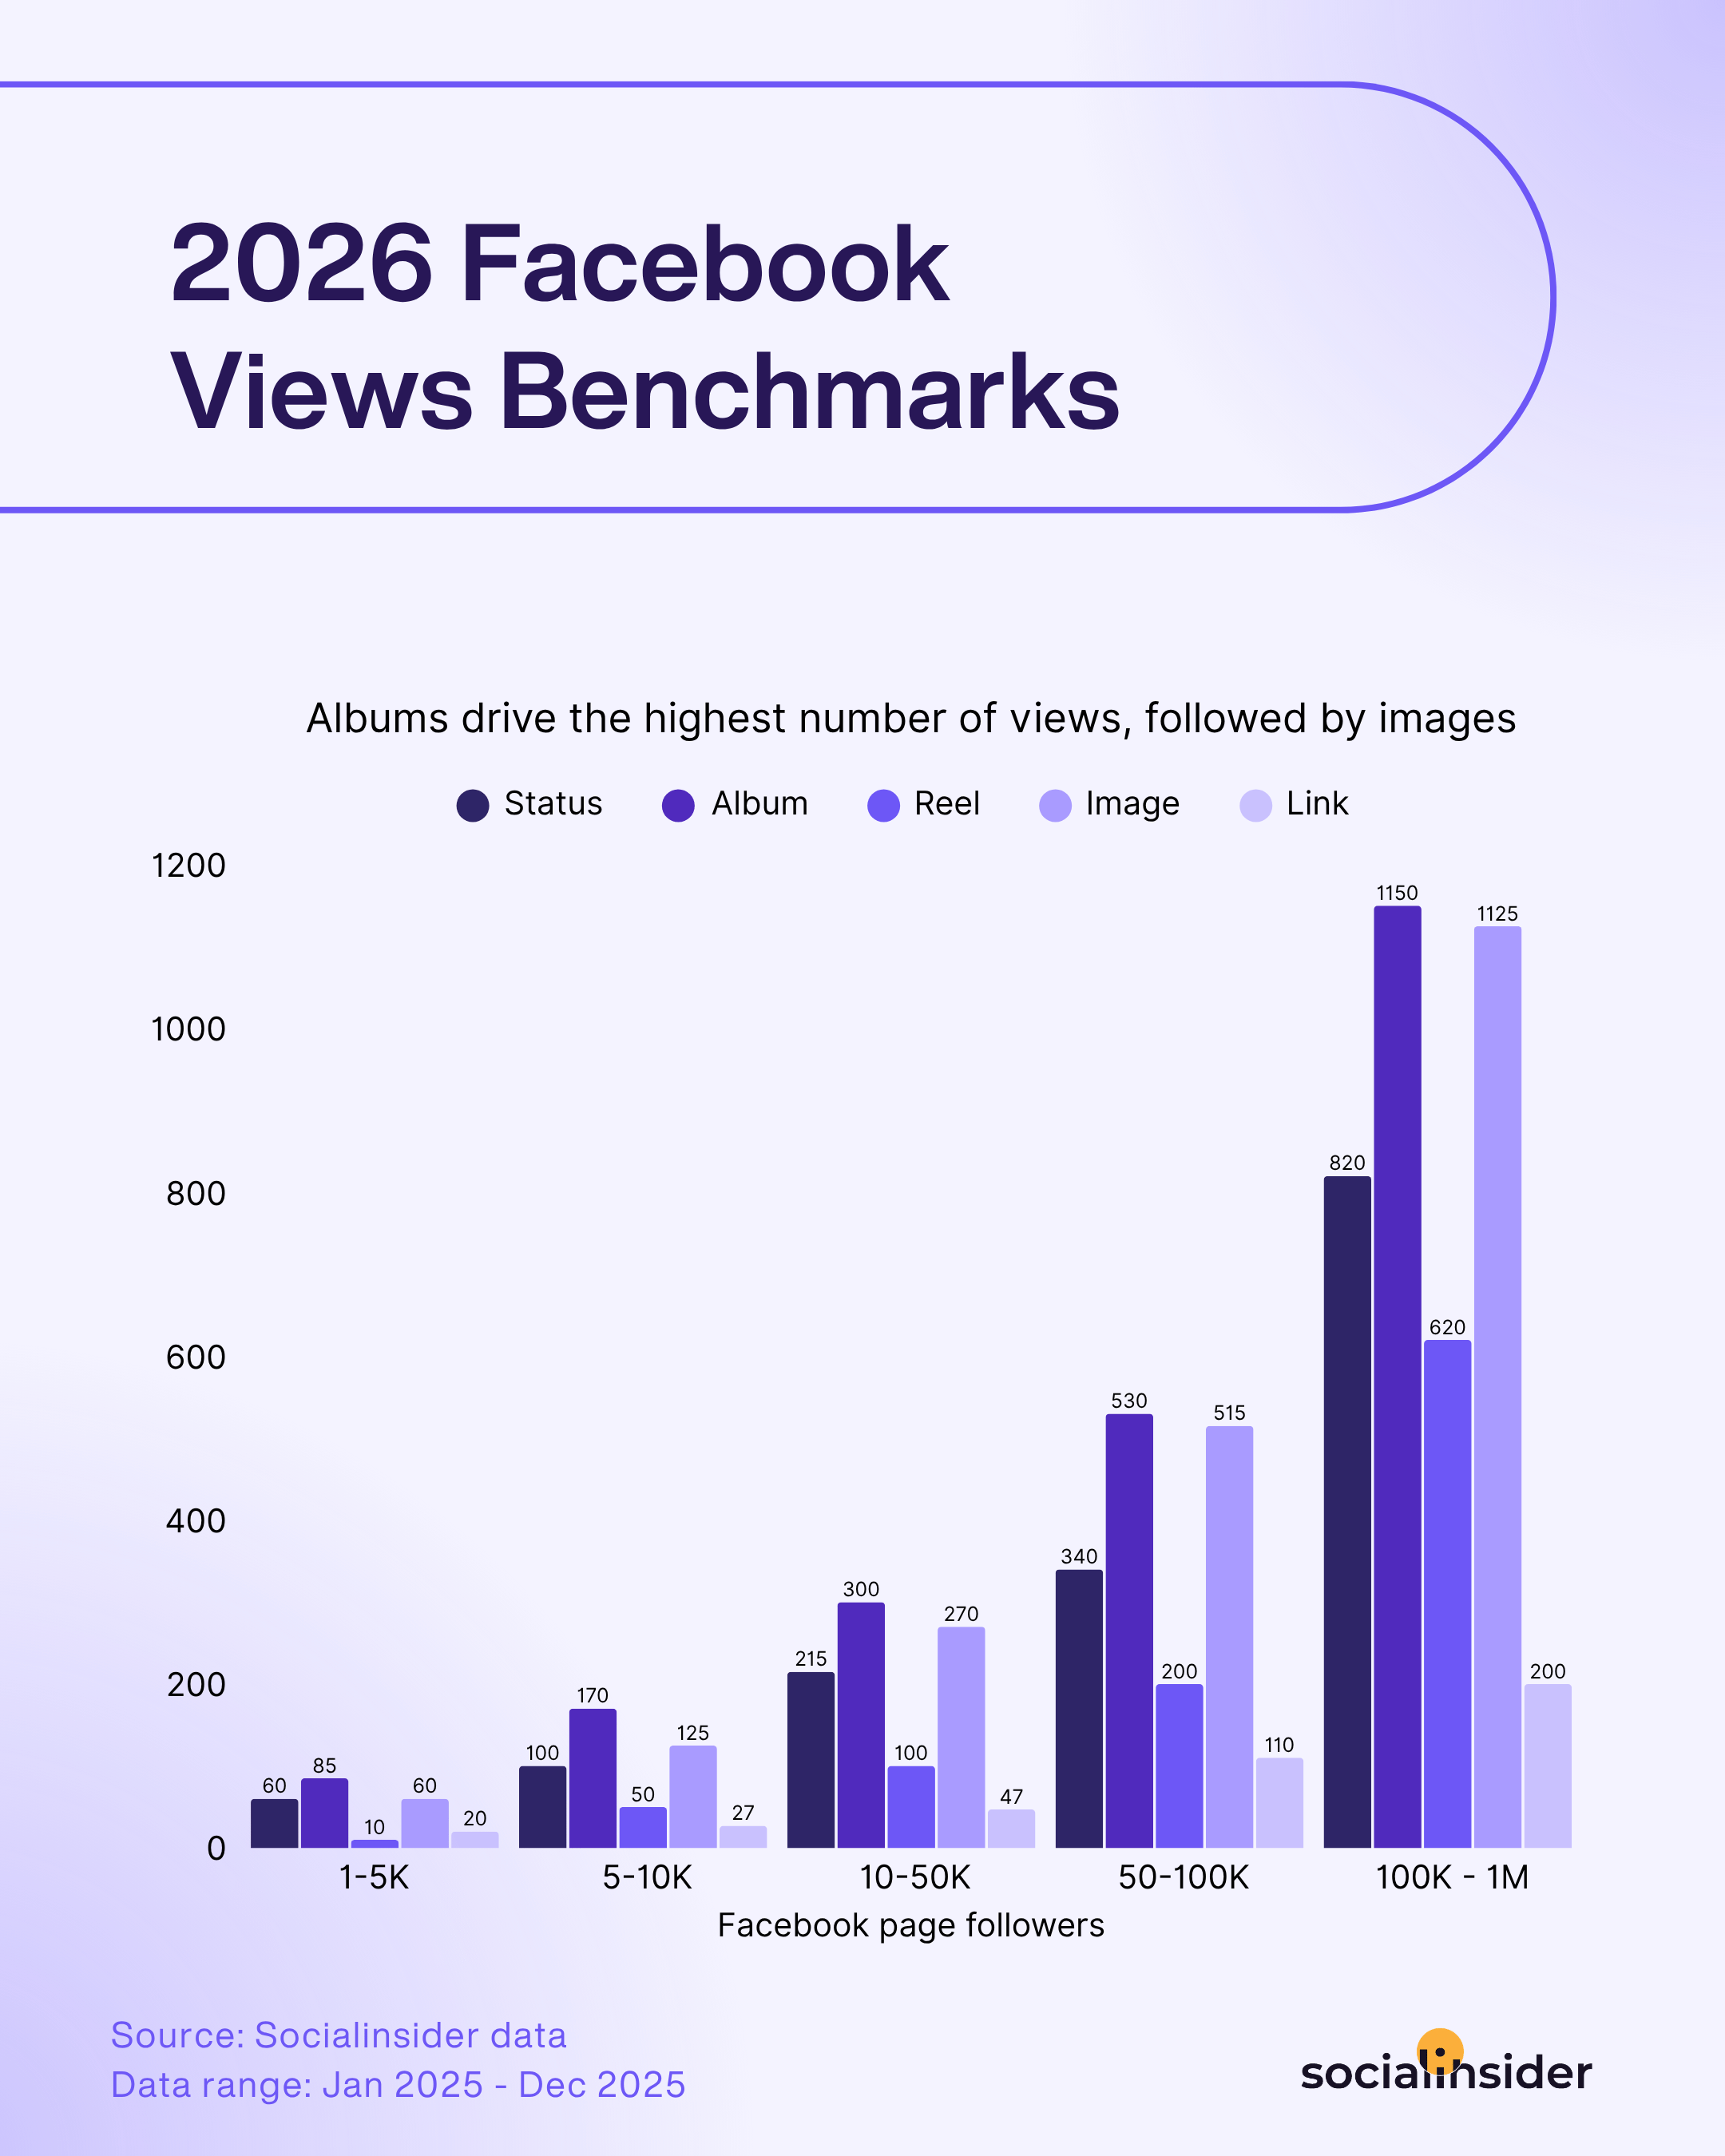
Facebookの様々なコンテンツタイプ別に平均視聴回数を見ると、明確な傾向が現れます。アルバムは他のフォーマットと比べて、一貫して最も多くの視聴回数を獲得しています。
この傾向は、すべての規模のページで見られます。プラットフォーム上でのコンテンツ消費の特徴を示しています。マーケターにとって、このインサイトは重要な戦略的ポイントを強調します。インタラクションを促すフォーマットは、より多くの露出を獲得しやすいです。
Facebookで視聴回数を増やすための戦略的な施策
- 「ビフォー&アフター」型シーケンスを活用しましょう。 変化を見せるアルバム(結果、リデザイン、キャンペーン成果)は注目を集めやすく、視聴回数も高まる傾向があります。
- 他のプラットフォームのカルーセル型コンテンツを再利用しましょう。 LinkedInやInstagramのカルーセル用に作成したコンテンツは、Facebookアルバムに適応すると高いパフォーマンスを発揮します。
- 認識しやすいビジュアルパターンを使いましょう。 一貫したデザインやテンプレートは、フォロワーがフィード内でコンテンツをすぐに認識できます。スクロールを止めてもらいやすくなります。
- アルバム投稿を社内で積極的に広めましょう。 チームメンバーやブランドアドボケイトが早い段階で投稿にエンゲージメントできるよう促して、初期の配信を後押しします。
Facebook投稿頻度のベンチマーク
Facebookでの投稿頻度は常にバランスが重要です。投稿が少なすぎると、オーディエンスのフィードで目立ちにくくなります。頻繁に投稿しすぎると、フォロワーに負担を与えたり、各コンテンツの効果が薄れるリスクがあります。
そのため、Facebookの投稿頻度ベンチマークを見ることが有益です。
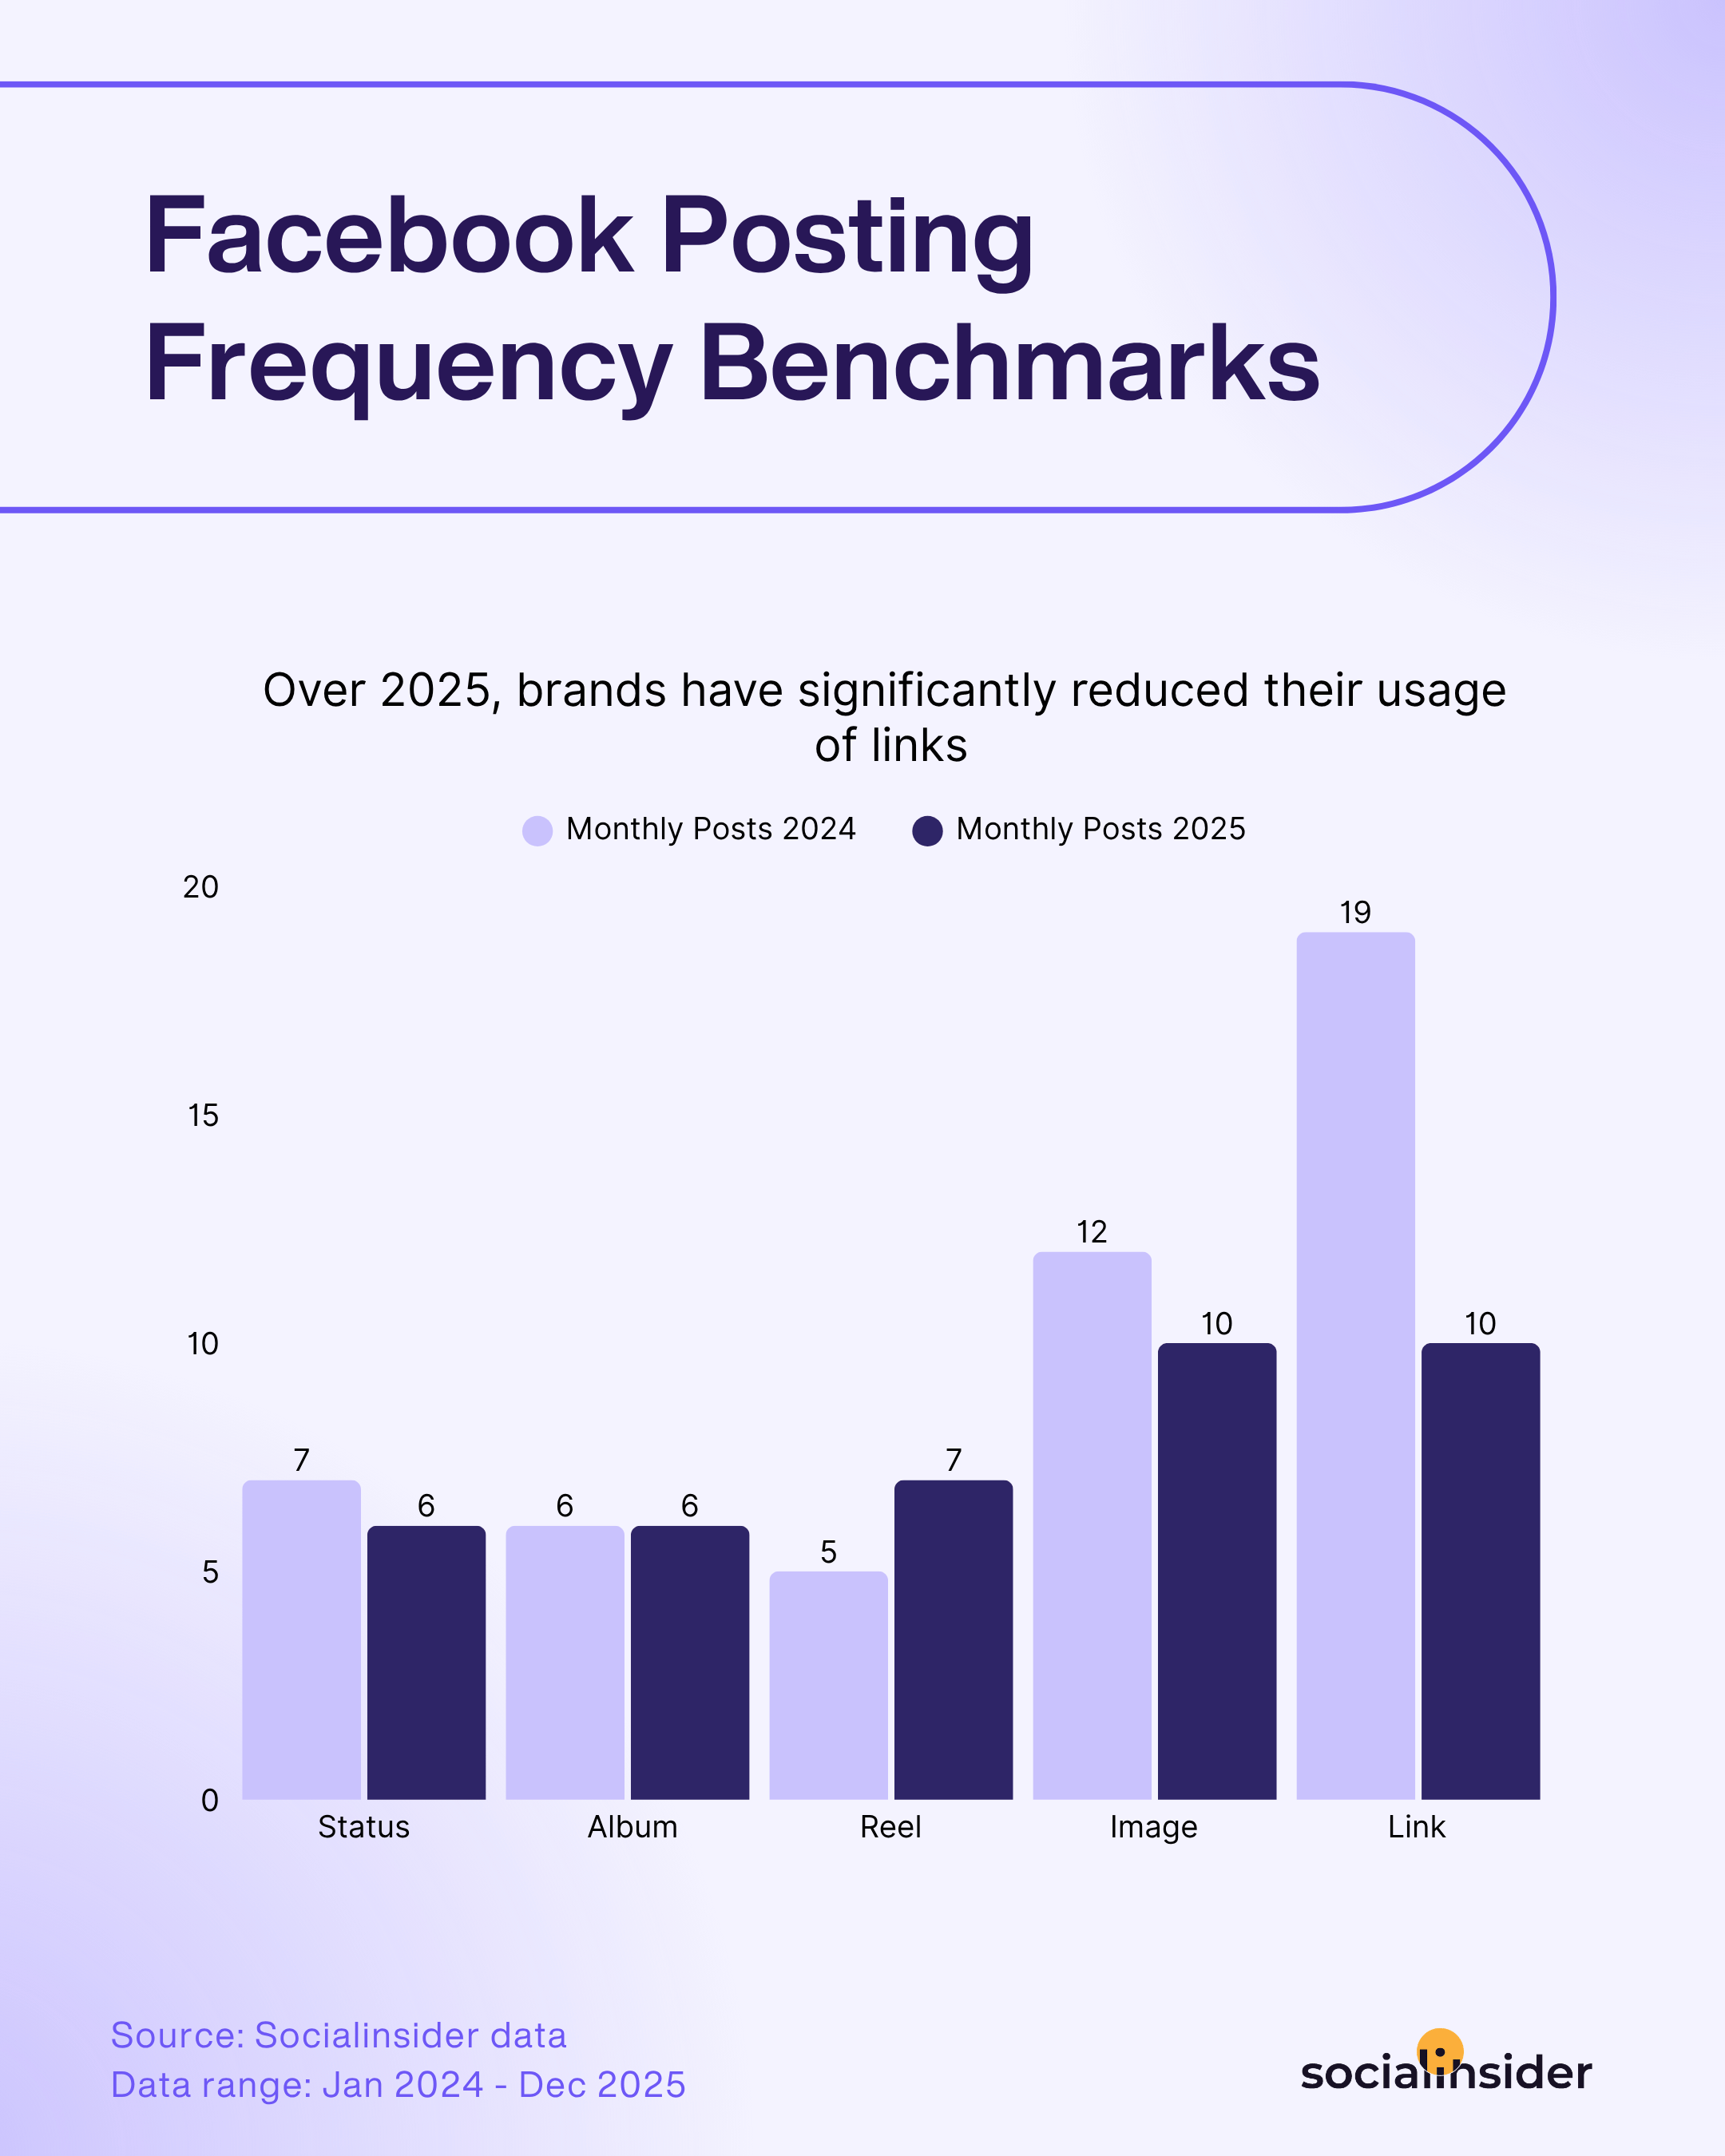
最新データを前年と比較すると、明らかな変化が見られます。ブランドは投稿頻度を減らし、投稿数を22%削減しています。現在の月間平均は39投稿です。
ブランドが投稿頻度を減らした理由の一つは、InstagramやTikTokのようなビジュアル重視のプラットフォームへ注力し始めたことです。9:16の動画コンテンツが主流となり、ソーシャルメディアが本格的なメディアチャネルへ進化する中、ブランドはこうした特徴を優先するプラットフォームへ適応しています。また、多くのブランドが購買力の未来であるZ世代をターゲットに移行中です。つまり、彼らの関心もそのオーディエンスが“ドゥームスクロール”する場所へと移っています。- Mariya Spektor、ソーシャルメディアディレクター兼コンサルタント
長い間、Facebookではリンク投稿が一般的なフォーマットでした。ブランドはブログ記事やニュース、商品ページ、外部リソースへの誘導によくリンクを活用していました。しかし、時が経つにつれ、プラットフォームのダイナミクスは変化しています。
現在、Facebookはユーザーをプラットフォーム内に留めるコンテンツを優先しがちです。そのため、外部サイトへ誘導する投稿は、ネイティブコンテンツ形式ほどのリーチやエンゲージメントを得にくい傾向があります。
この変化はブランドの行動にも影響を与えているようです。
多くのブランドがリンク依存から、プラットフォーム内でのやり取りを促進する形式へシフトしています。
Facebook投稿ストラテジー最適化のための戦略的タクティクス
- ネイティブコンテンツフォーマットを優先します。ステータス更新、アルバム、画像、リールなど、プラットフォーム内にユーザーをとどめるフォーマットに注力しましょう。
- さまざまな投稿リズムをテストします。投稿パターンを試して、最適な頻度を見つけましょう。
- 定期的にパフォーマンスをモニタリングしましょう。 投稿頻度とエンゲージメントメトリクスを併せて確認すると、どのフォーマットがオーディエンスに響いているかを特定できます。
投稿頻度に決まった正解はありません。Facebookのアルゴリズムが進化する中で、成功の鍵はボリュームよりもリレバンスです。そのため、ブランドもアプローチを変えています。
最も効果的な頻度は、オーディエンスインサイトと発信する価値のある内容のバランスです。オーディエンス理解が深いブランドは、1日に複数回投稿します。一方、品質と信頼性を維持するため週に3〜4回投稿する企業もあります。
また、状況によっても異なります。例えば、地域ページはよりエンゲージされたコミュニティがあるため、高頻度投稿が可能です。- Daisy Castle、ソーシャルメディアマネージャー、TUI
Facebookフォロワー増加のベンチマーク
Growing a Facebook audience has become increasingly challenging over the years. In the early days of the platform, gaining followers was relatively straightforward—pages could grow quickly as more people joined the network and discovered new brands.
Today, however, growth tends to happen at a slower and more strategic pace. Many brands are competing for attention in an already crowded ecosystem, and audiences are more selective about which pages they choose to follow. That’s why tracking metrics like the Facebook follower growth rate has become essential for understanding how pages expand over time.
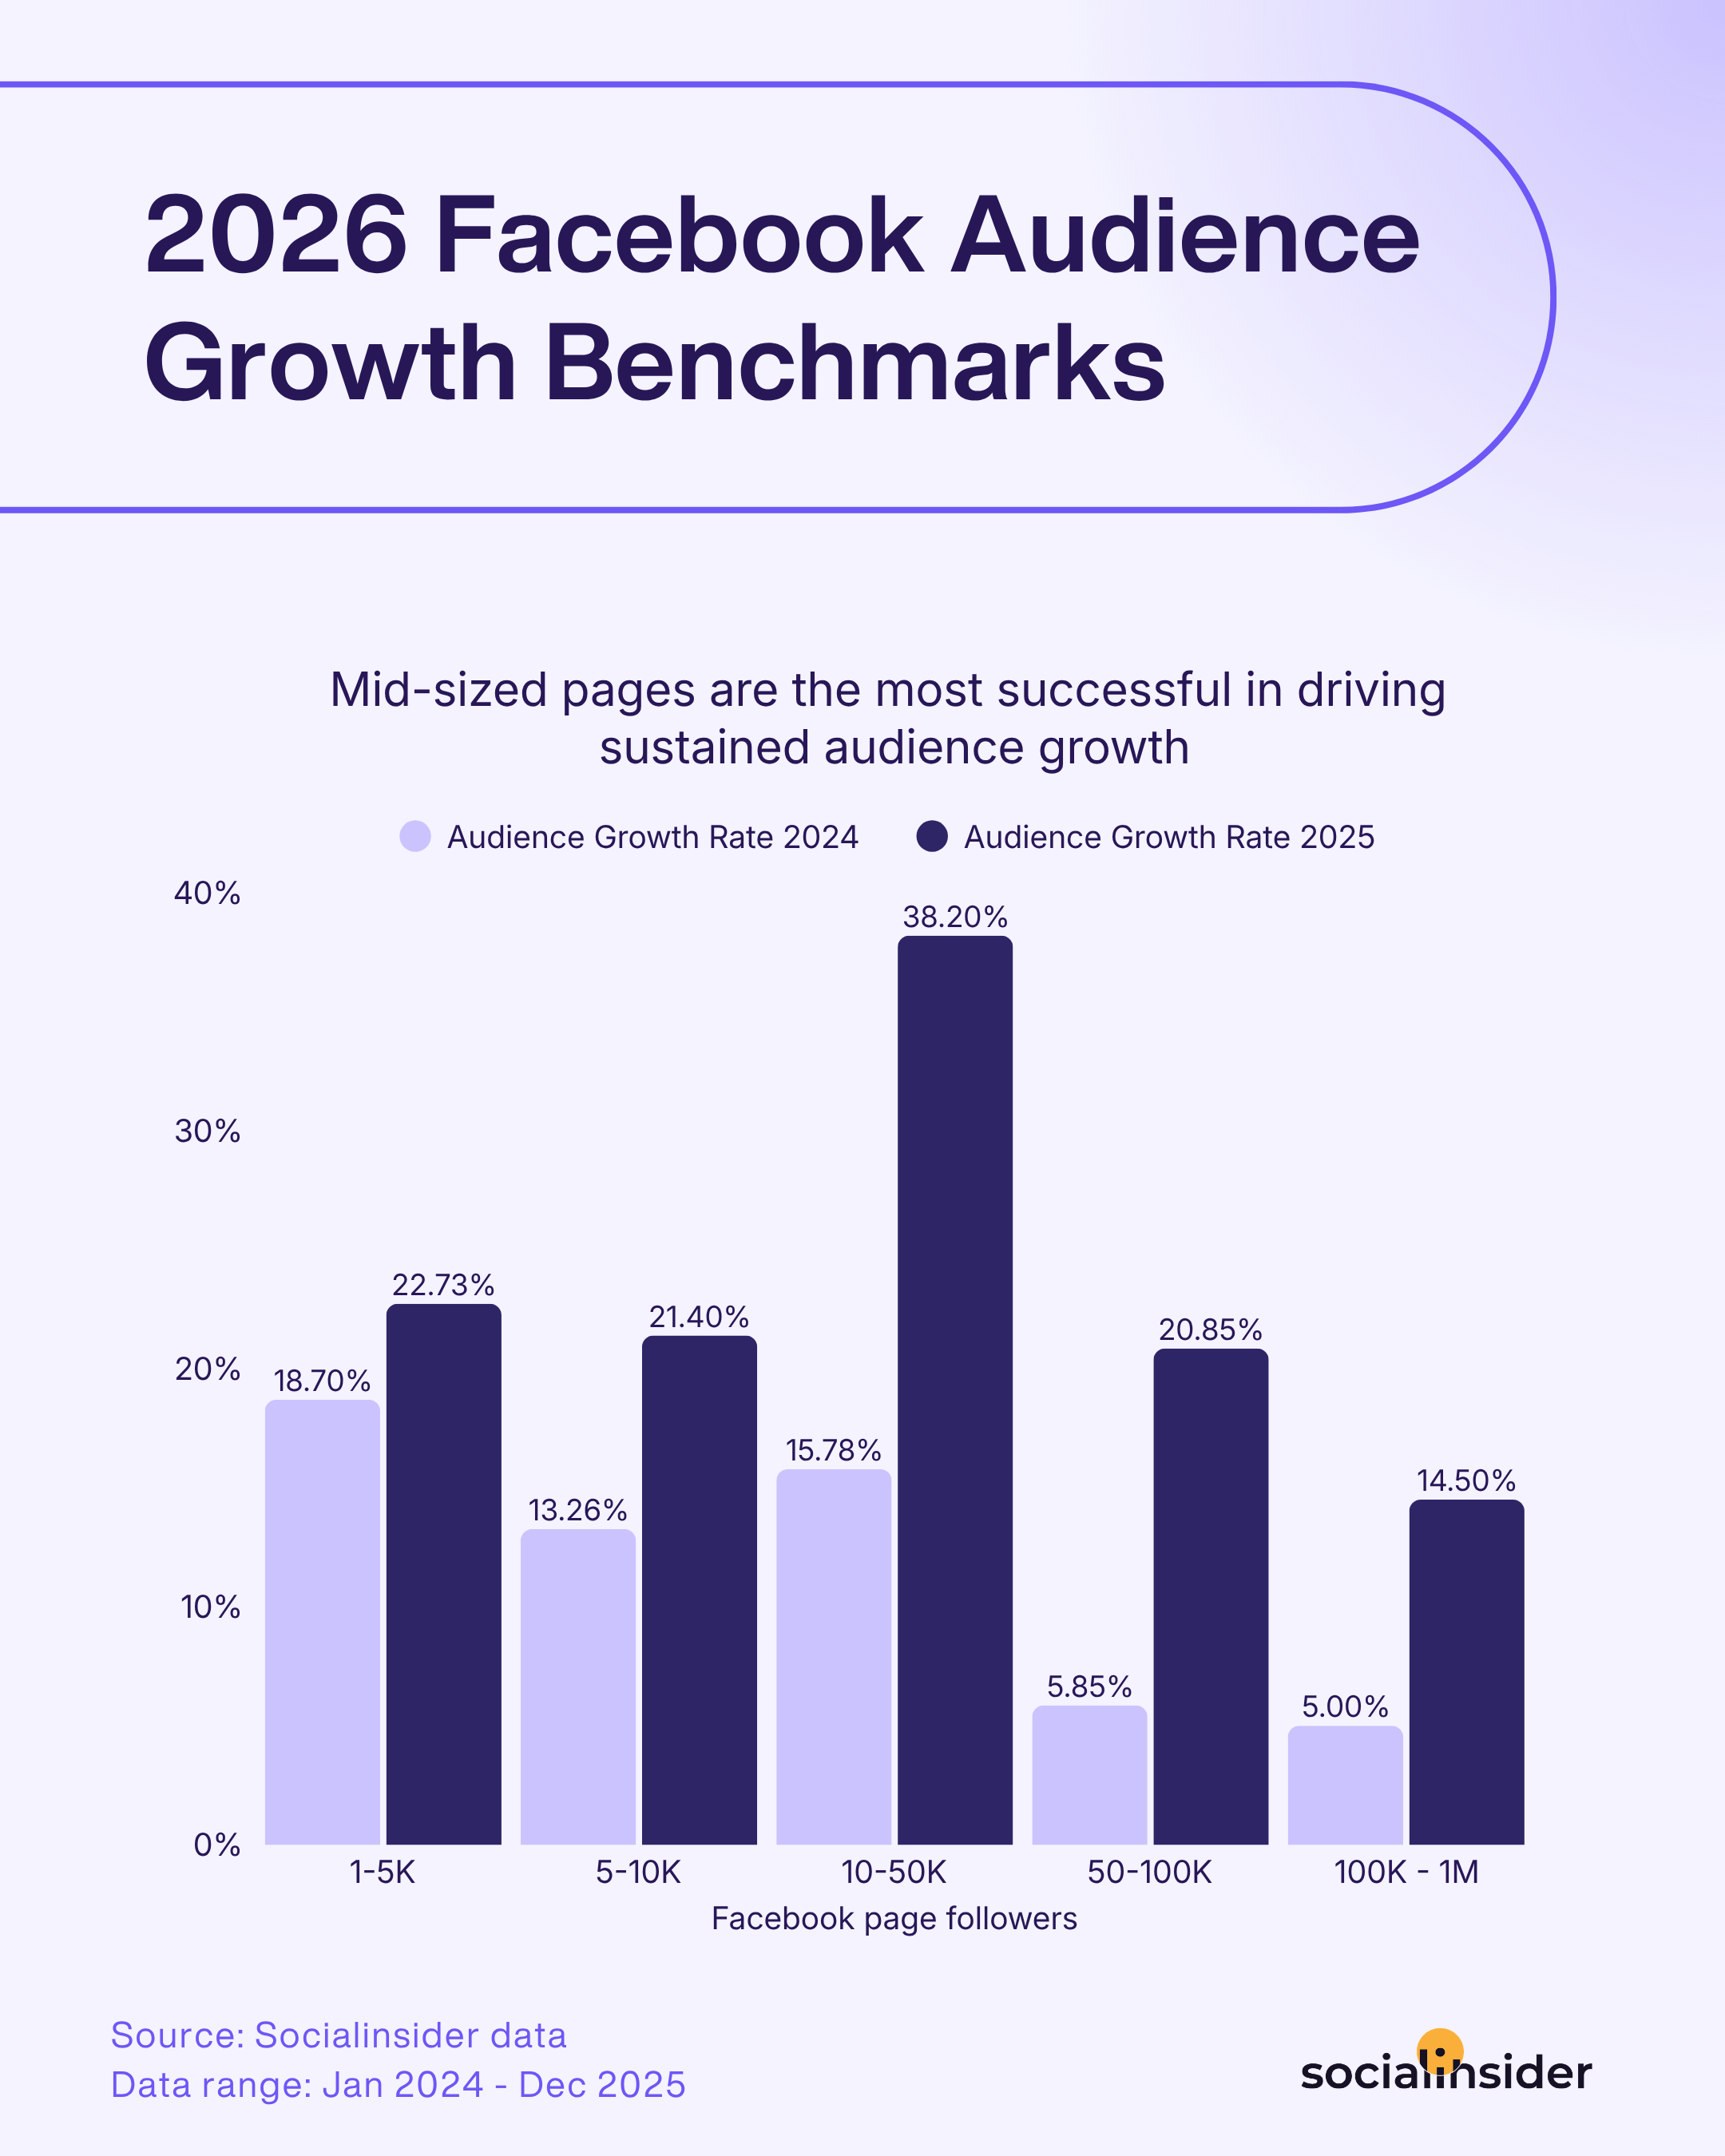
When peeking at the Facebook audience growth rate data, I discovered something interesting: that mid-sized Facebook pages are currently the most successful at driving sustained audience growth.
どうしてですか?
小規模なページは、よく可視性で苦労します。大きなコミュニティや強力な流通がない場合、コンテンツが新しいオーディエンスに継続的にリーチするには時間がかかります。
一方で、とても大きなページは別の停滞期に直面します。すでに数十万から数百万のフォロワーがいる場合、急成長を維持するのは自然と難しくなります。オーディエンスの母数が大きいほど、同じ割合で増加し続けるのはさらに困難です。
しかし、ミッドサイズのページは独自のポジションにあります。すでに十分な認知度と信頼を築いており、新しいフォロワーを継続的に獲得できます。また、成長の余地もまだ多く残っています。
ミッドサイズのページは、官僚的な手続きにとらわれず勢いがあります。十分に大きいので効果的な方法を見つけていますが、まだ素早く動いたりリスクを取ったりできます。1万未満のページは、まだすべてをテスト中です。ミッドサイズのページはまさに“おいしい”ポジションです。オーディエンスを理解しており、引き続き実験でき、企業的なプロセスに飲み込まれていません。敏捷性がある時こそ成長できます。- Carolina Barbosa、シニアソーシャルストラテジスト
まとめとして、全体像を見ると、2024年のFacebook全体の成長率は12.20%でしたが、2025年にはこの数字が2倍となり、23.20%に達しました。
Strategic tactics to accelerate your follower growth on Facebook
- Encourage followers to invite others. Community-driven growth can help expand audiences organically.
- コメントやディスカッションに積極的にエンゲージメントしてください。 Active community management makes pages feel more dynamic and worth following.
- 業界でトレンドとなっている会話を活用してください。 関連するディスカッションに参加することで、新しいユーザーにあなたのページを知ってもらえます。
メソドロジー
本分析で使用したFacebookデータは、2024年1月から2025年12月までにアクティブだった130,683のFacebookページが公開した25,000,000件の投稿で構成されています。
平均的なFacebookエンゲージメント率は、指定した期間内にページが公開した投稿に対して得たすべてのリアクション、コメント、シェアの合計をフォロワー数で割り、100を掛けてパーセントを算出します。
平均コメント数は、投稿1件あたりが平均して獲得するコメントの数です。
投稿あたりの平均シェア数は、1つの投稿が平均して獲得するシェア数を表します。
投稿あたりの平均視聴回数は、1つの投稿が平均して得る視聴回数を示します。
月間平均投稿数は、リールが平均して獲得する視聴回数を表します。
平均フォロワー増加率は、獲得したフォロワー数を開始時のフォロワー数で割り、100を掛けて算出します。
ご注意: 本調査は2025年の数値を2026年として表示しています。公開時点では年初につき、分析のための十分なデータがありませんでした。そのため、四半期ごとにアップデートを提供し、年の進行とともにより多くのデータをご覧いただけます。
Get in-depth Facebook competitive insights
Run an insightful Facebook competitive analysis and get content optimization insights!
リアルタイムのインサイトでソーシャルメディア戦略を強化しませんか?
戦略的なインサイトを獲得し、全チャネルのソーシャルパフォーマンスを分析します。異なる期間のメトリクスを比較し、レポートを数秒でダウンロードできます。