Best Western GB ブランド概要
ソーシャルメディアのパフォーマンスデータを表示 Best Western GB
Best Western GB
0.36
ブランド平均Eng率Photo
トップコンテンツ(Eng.率順)47K
ブランド動画の平均再生回数ブランド投稿の全チャネル展開
投稿のクロスチャネル分析
ブランド投稿の全チャネル展開
| チャンネル | 投稿 | 平均投稿数/日 |
|---|---|---|
 YouTube YouTube | 7 | 0.04 |
 Twitter Twitter | 0 | 0 |
 Instagram Instagram | 87 | 0.48 |
| Total | 94 | 0.52 |
トップ投稿
Best Western GB Instagram
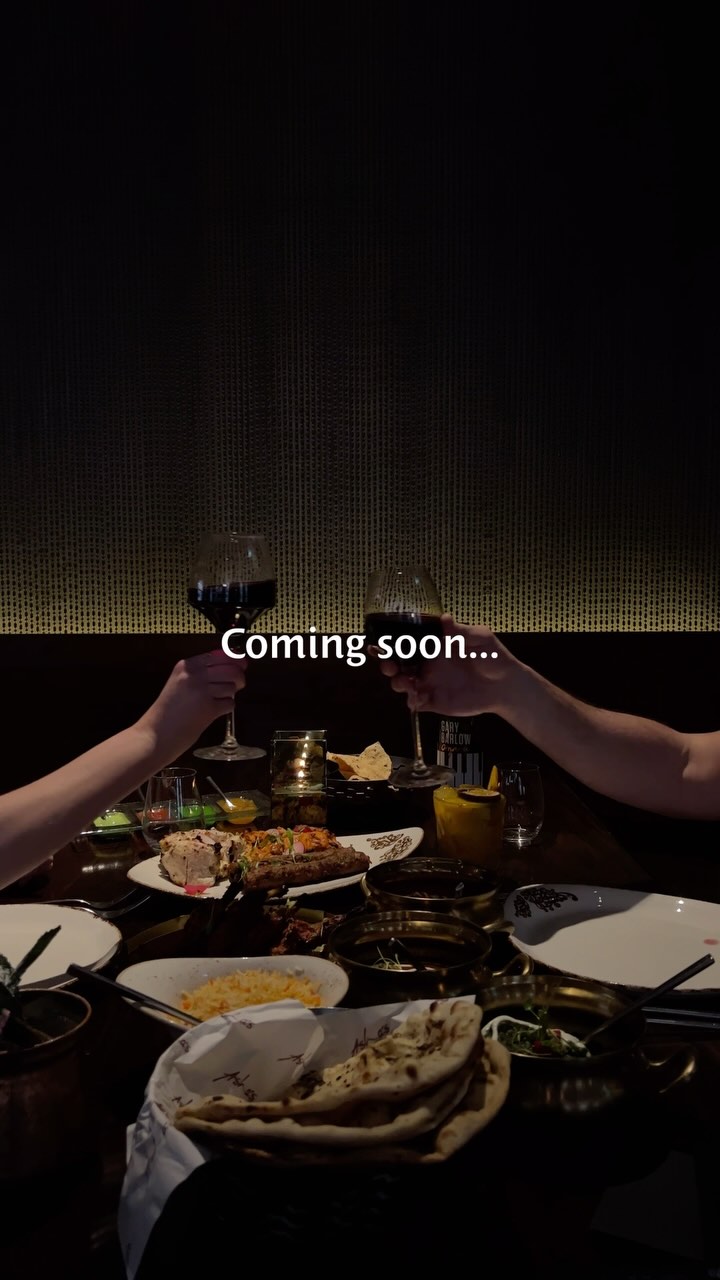
Apr 11, 2025
17K followers
Engagement Rate
24.767%
Best Western GB Instagram

Apr 28, 2025
17K followers
Engagement Rate
9.731%
Best Western GB Instagram

Apr 21, 2025
17K followers
Engagement Rate
9.374%
チャネル全体のブランドEng
エンゲージメントのクロスチャネル分析。
チャネル全体のブランドEng
| チャンネル | エンゲージメント | 平均エンゲージメント |
|---|---|---|
| YouTube | 39 | 5.57 |
| Twitter | 0 | 0 |
| Instagram | 14K | 160.91 |
| Average | 4679 | 55.49 |
ブランド動画の総チャンネル視聴数
エンゲージメントのクロスチャネル分析。
ブランド動画の総チャンネル視聴数
| チャンネル | 動画再生数 | 平均動画再生数 |
|---|---|---|
| YouTube | 1.3M | 185K |
| Twitter | 0 | 0 |
| Instagram | 76K | 1353 |
| Average | 456K | 62K |


リアルタイムのインサイトでソーシャルメディア戦略を改善する準備はできていますか。
戦略的なインサイトを取得し、全チャネルのソーシャルパフォーマンスを分析し、異なる期間の指標を比較して、数秒でレポートをダウンロードできます。