Zinda Foods ブランド概要
ソーシャルメディアのパフォーマンスデータを表示 Zinda Foods
Zinda Foods
0.58
ブランド平均Eng率Photo
トップコンテンツ(Eng.率順)365.22
ブランド動画の平均再生回数ブランド投稿の全チャネル展開
投稿のクロスチャネル分析
ブランド投稿の全チャネル展開
| チャンネル | 投稿 | 平均投稿数/日 |
|---|---|---|
 Twitter Twitter | 0 | 0 |
 Facebook Facebook | 0 | 0 |
 Instagram Instagram | 7 | 0.04 |
| Total | 7 | 0.04 |
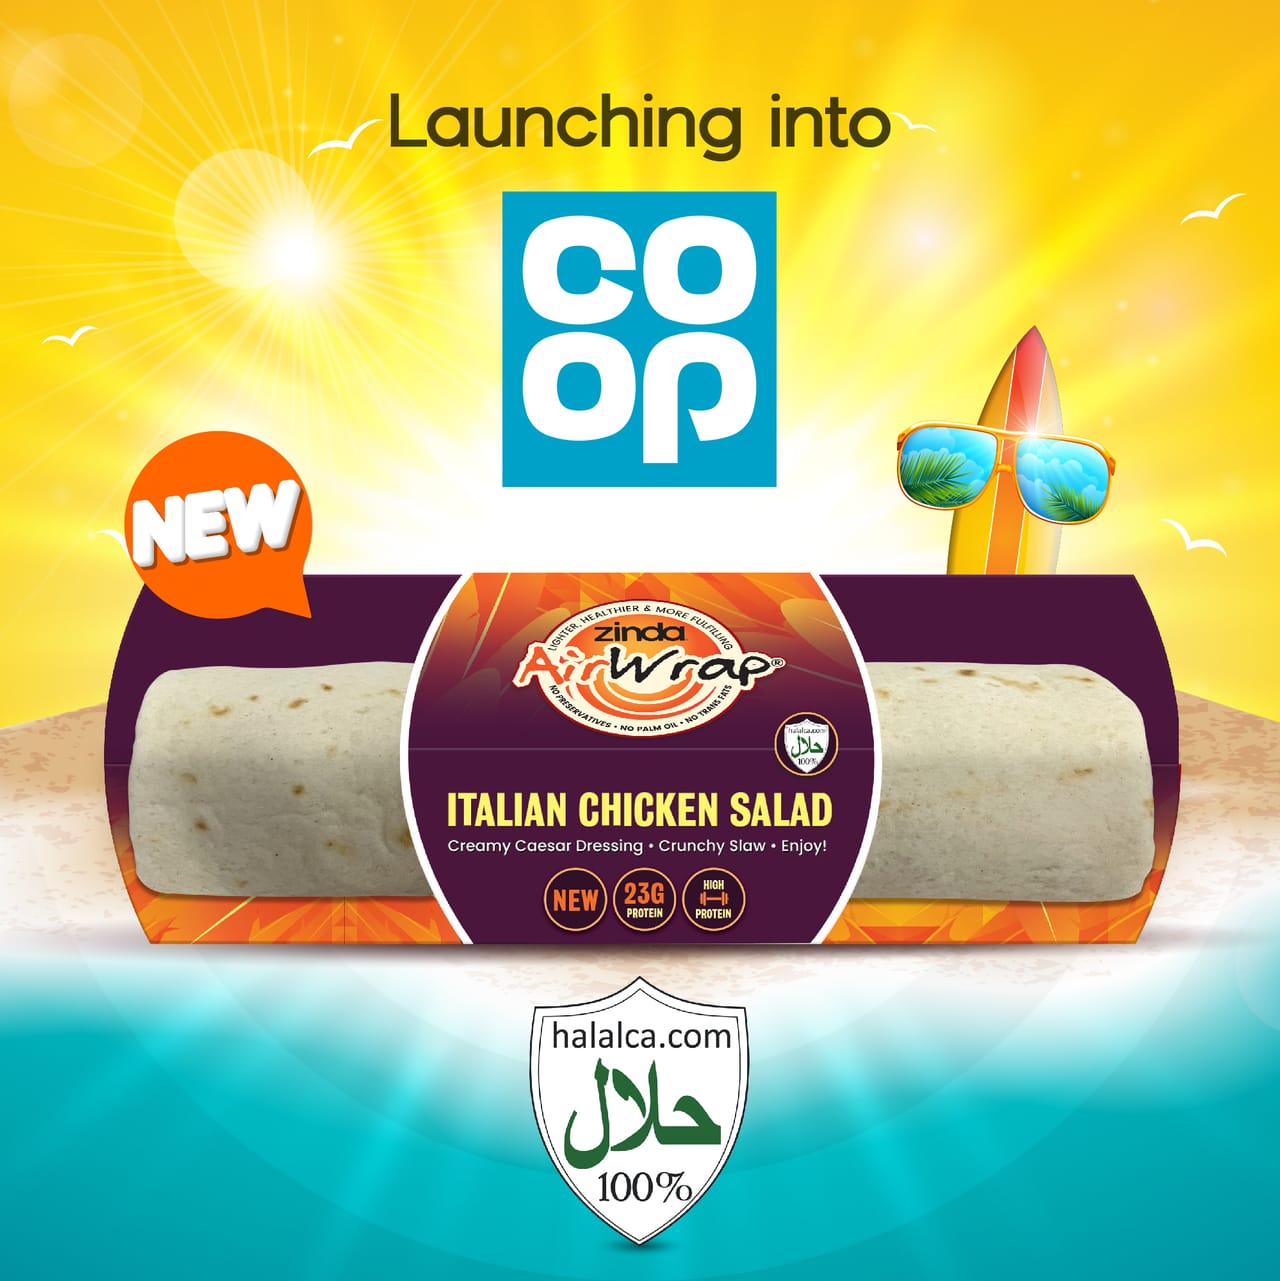
トップ投稿
Zinda Foods Instagram

Mar 22, 2025
2949 followers
Engagement Rate
8.647%
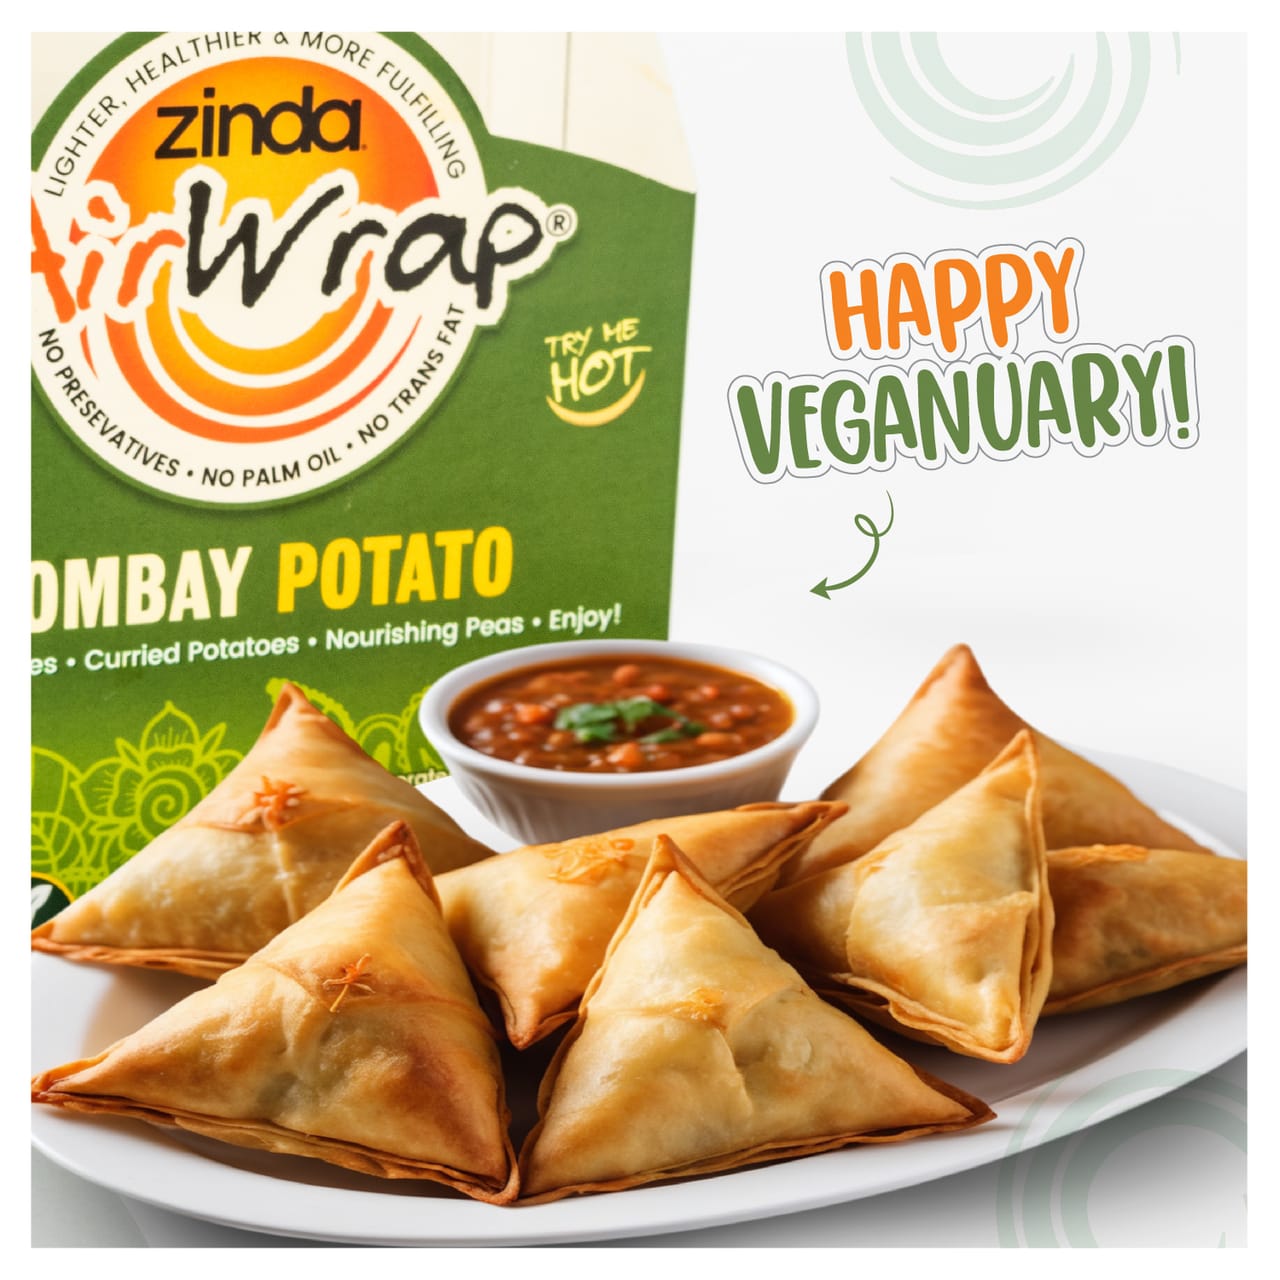
Zinda Foods Instagram
Apr 2, 2025
2949 followers
Engagement Rate
0.848%
Zinda Foods Instagram
Jan 10, 2025
2949 followers
Engagement Rate
0.678%
チャネル全体のブランドEng
エンゲージメントのクロスチャネル分析。
チャネル全体のブランドEng
| チャンネル | エンゲージメント | 平均エンゲージメント |
|---|---|---|
| Twitter | 0 | 0 |
| Facebook | 0 | 0 |
| Instagram | 362 | 51.71 |
| Average | 120.67 | 17.24 |
ブランド動画の総チャンネル視聴数
エンゲージメントのクロスチャネル分析。
ブランド動画の総チャンネル視聴数
| チャンネル | 動画再生数 | 平均動画再生数 |
|---|---|---|
| Twitter | 0 | 0 |
| Facebook | 0 | 0 |
| Instagram | 3287 | 1096 |
| Average | 1096 | 365.22 |


リアルタイムのインサイトでソーシャルメディア戦略を改善する準備はできていますか。
戦略的なインサイトを取得し、全チャネルのソーシャルパフォーマンスを分析し、異なる期間の指標を比較して、数秒でレポートをダウンロードできます。