Instagram analytics built for competitor analysis
Track any Instagram business profile alongside yours. Compare engagement trends, content formats, and growth over time so you know where you lead and where to improve.


Benchmark any Instagram accounts (your own or competitors)
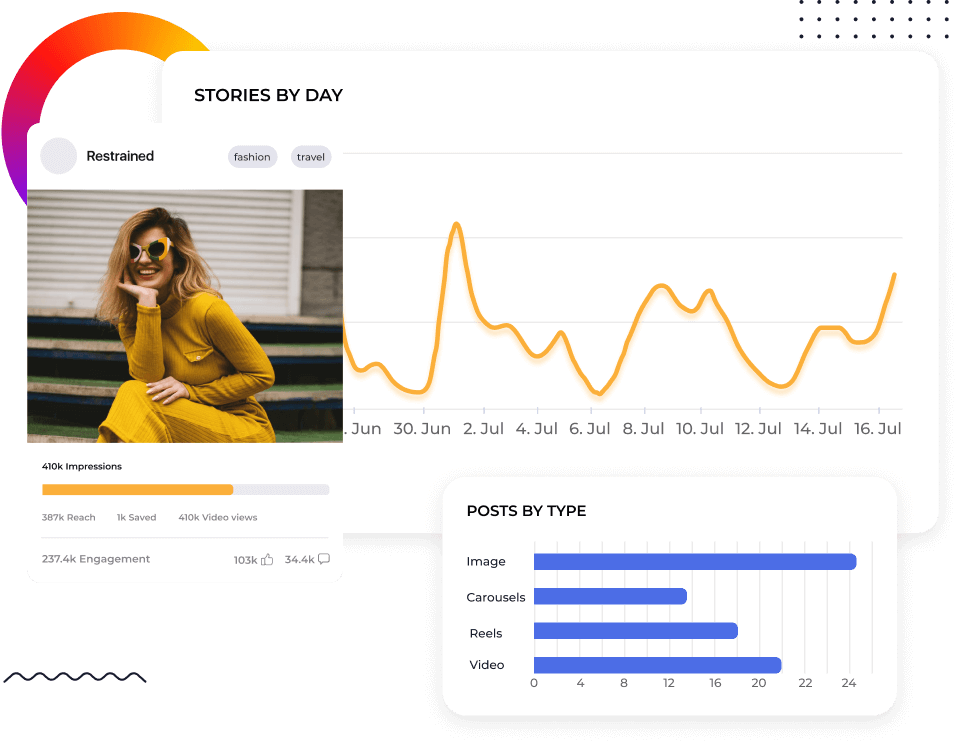
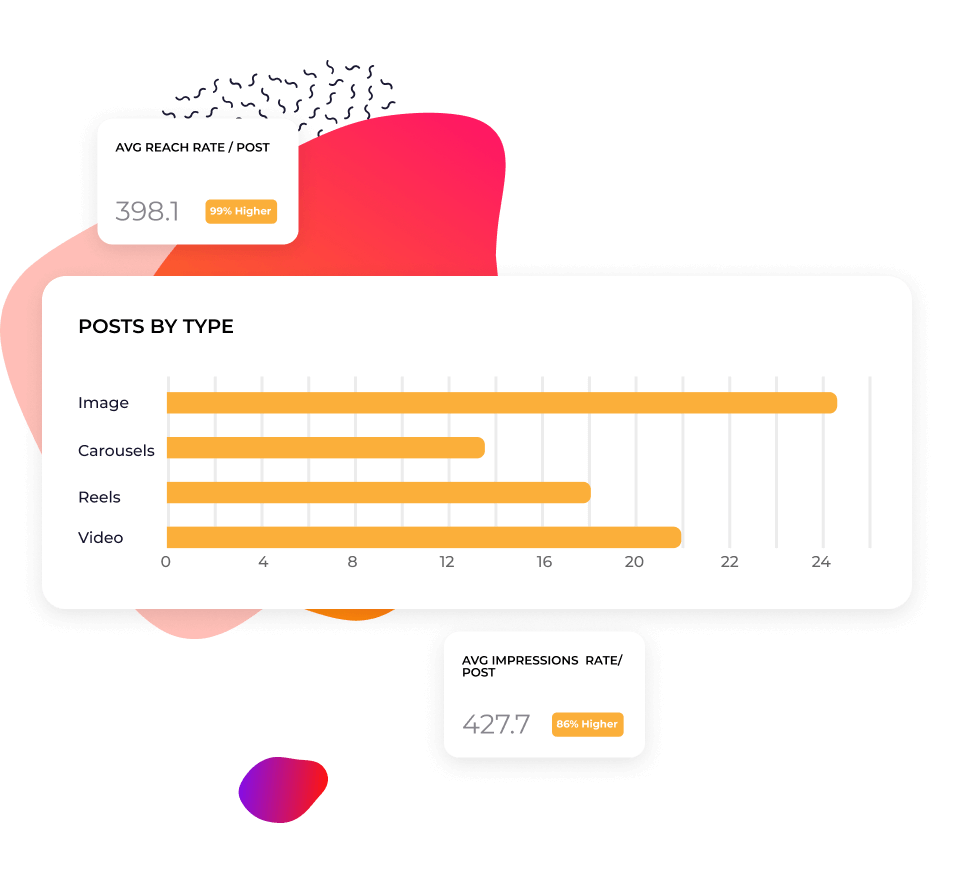
Most tools for Instagram metrics treat competitive data as a secondary feature. Socialinsider makes it the starting point. Add any public Instagram profile and compare it directly to yours. See engagement rate, reach, impressions, Reels views, and posting behavior side by side.
Ask your Instagram analytics data any question
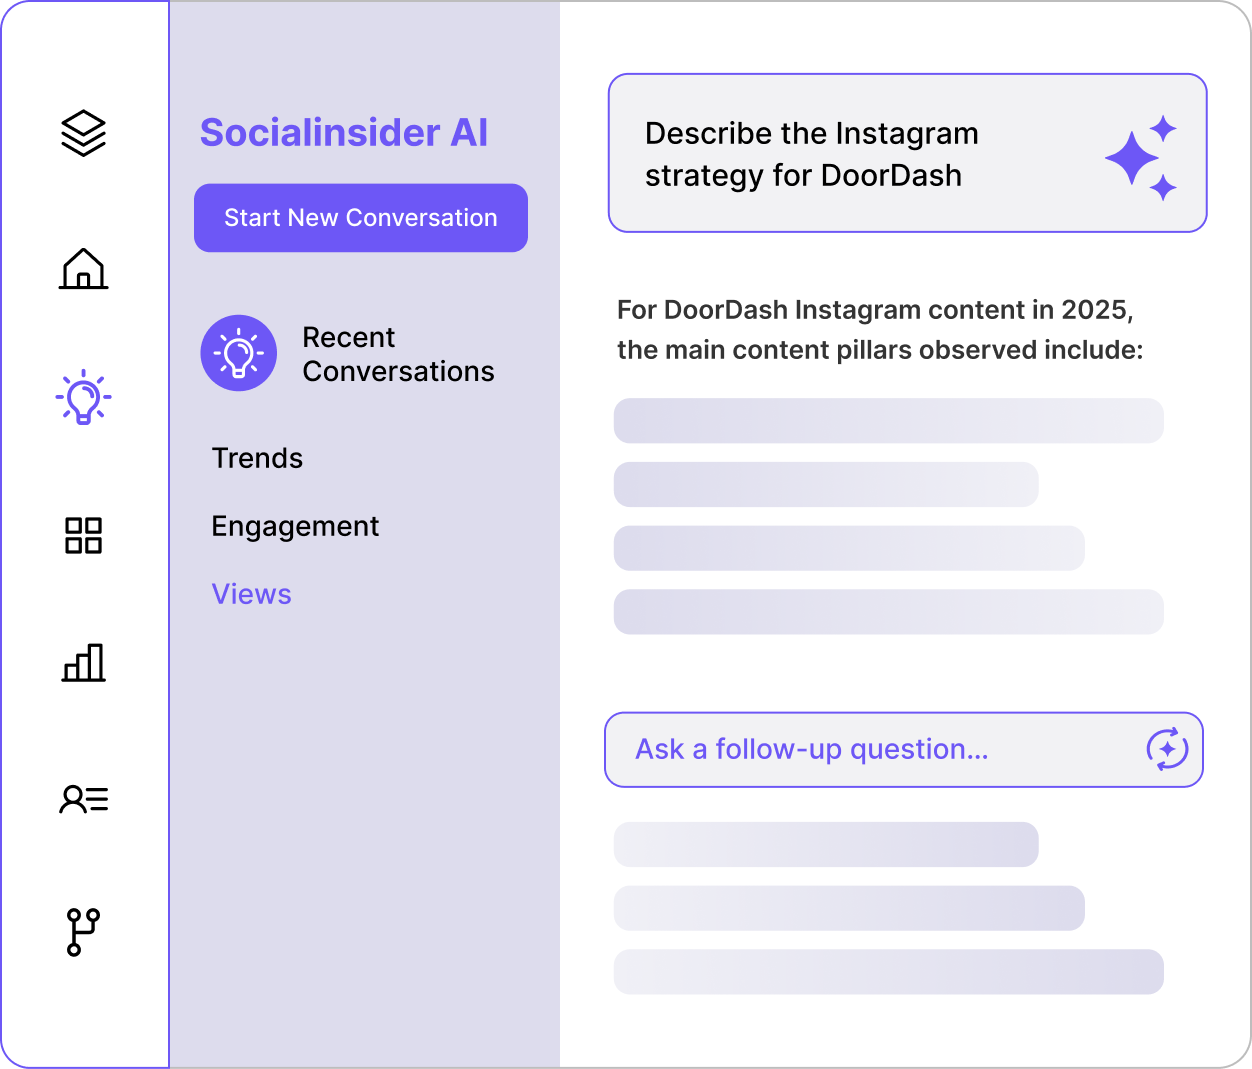
Socialinsider AI reads your account, your competitors, and your industry benchmarks all at once. Ask: How does our engagement compare to [competitor] this quarter? and get a written analysis of what changed, why it matters, and what you should do next. The competitive context is already built in

"The competitor analysis helped in creating visibility on how we are performing in the market."

Go deeper than Reels vs. carousels — see what wins
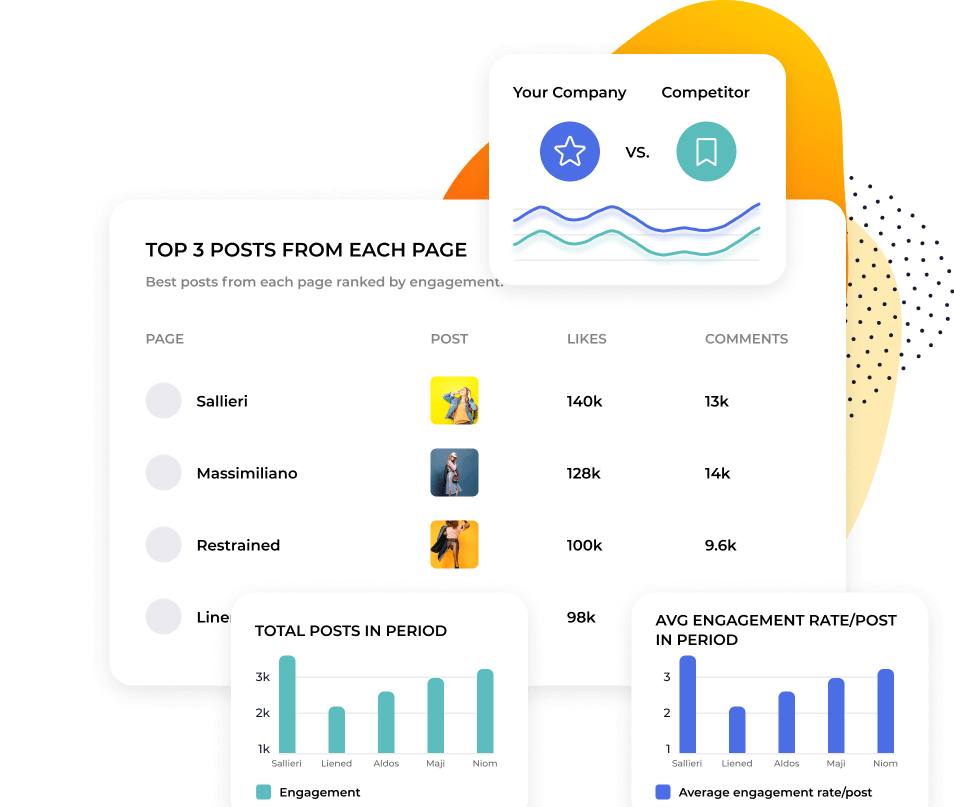
Socialinsider groups Instagram content into themes using AI, or you can create your own categories and tag posts manually. See what content drives engagement for competitors, not just your own profile. Find repeatable patterns instead of chasing one-off viral posts.
Report on performance without starting from scratch
Historical data lets you answer the question that always comes up: Is this dip just us, or the whole market? Track how your metrics and your competitors' metrics move over time. Export reports in CSV, PDF, or PPT with your own branding in minutes instead of spending a day pulling screenshots.
What they say about us
"Customer service has been one of my favourite features as well. You guys are just phenomenal. Your team is so responsive and very friendly and helpful. Which is not the norm."

"Socialinsider helped us understand whether we're improving or decreasing especially compared to the other accounts that we follow."

"Socialinsider allows for a competitor analysis that gives an insight to performance relative to the market."

"The sentiment analysis is amazing for Instagram hashtags. This new social media listening dashboard helped me in long-term planning."

"We are using this social media analytics dashboard for all our 40 social media clients. We can have all the performance data in one single place."

"With Socialinsider, our team became more efficient. We do not need to spend time on social media data gathering. Instead, we can focus on insights and analysis."

"We use Socialinsider for day-to-day social media insights if we need to outline any simple strategic changes or review the performance of certain social posts."

"On average, a social media report for a brand requires 1 to 2 hours of work with Socialinsider, where it used to require a full day to gather the data."

"Socialinsider has saved us more than $16k per year. It has enabled us to save time on monthly reports and complex long-term analyses."

How to track Instagram engagement rate in Socialinsider
Sociainsider’s social media analytics, competitors analysis tools allow you to measure social media performance, run audits, and compare performance.
Start by creating a trial account to Socialinsider
Add your competitors and connect the profiles you manage
Get all the engagement metrics for any Instagram business account
Compare your performance against your top competitors
Perform a cross-channel analysis to evaluate your Instagram performance.

Get competitive insights and explore
social media analytics metrics
Frequently Asked Questions
Got a question? We've got answers.
What are Instagram analytics?
Instagram analytics involves collecting and analyzing data from your Instagram account to measure how your posts and page are performing.
This data includes performance metrics and account insights, such as post likes, number of Story views, follower count, and more. By monitoring Instagram analytics, you’ll get valuable information on your audience, their activity and the type of content they engage with, which you can use to optimize your marketing strategy.
For example, if your Instagram analytics report shows high engagement with Reels, you might decide to produce more video content. Or you delve into Instagram audience insights and notice a big following in a specific city, which prompts you to start a localized account.
Ultimately, Instagram analytics are a powerful business tool. Whether it’s increasing sales, streamlining customer service, or building brand awareness, they tell you whether your social media marketing strategy is achieving your social media goals.
Why are Instagram analytics important?
Instagram analytics are important because they help you understand who your audience is, what content they like, and wider platform trends.
This is crucial for three reasons:
To practice good marketing
Understanding your audience is the cornerstone of any effective social media marketing plan. Knowing their preferences and behavior means you can better respond to their needs, likes and dislikes.
And no marketing channel is more reactive or responsive than social media.
To keep up with change
On Instagram, trends come and go overnight, and the algorithm is constantly changing. This creates both challenges and opportunities. Keeping up can feel daunting, but remember that Instagram also brings you closer to your audience.
And no marketing channel is more reactive or responsive than social media.
To stay consistent
It may look like some accounts have instant, viral results, but the reality is a lot of work behind the scenes. Success on Instagram takes commitment and consistency.
Tracking analytics over time allows you to gauge progress and gain perspective, so you can keep doing the things that are working, and stop or adjust things that aren’t.
The benefits of Instagram analytics for your business
You can use Instagram analytics to design a winning Instagram marketing strategy, adapt to trends, and stand out from the competition.
Identify what makes your audience tick
From relatable Reels to educational carousels, there are so many ways for brands to use Instagram. If you’re not sure what’s right for you, Instagram analytics can show you the way forward.
By understanding who you are attracting, you can tailor your strategy to profitable demographics. By learning what makes them engage with your brand, you can focus on content and campaigns with tangible ROI.
Update your strategy in line with trends
From consumer behavior to algorithm updates, marketers need to pay close attention to trends.
By reviewing Instagram analytics in real time, you can catch dips and spikes in performance. Watch out for opportunities that could boost reach, followers and engagement—like posting more Stories or experimenting with a newly released feature. This will help you evolve with the algorithm, not fight against it.
Gain a competitive edge
Beyond your own performance, the best Instagram analytics tools will show you how your account stacks up to competitors’.
Notice that a rival who posts more Stories is outstripping your follower count? Or maybe you’ve spotted a gap in their strategy—could this be your moment to shine? By benchmarking competitor data against Instagram analytics on your side, you can make smart, savvy choices.
How to track Instagram analytics insights?
How to see Instagram analytics using Instagram Insights
If you’re wondering how to check Instagram analytics, Instagram has a built-in tool called Instagram Insights.
Note: to make use of this feature, you will need to have a business or creator account.
To view Instagram’s free native analytics tool
- Open your profile.
- Tap the menu ≡ button in the top right corner.
- Tap Insights.
- Navigate to the metrics you want to see.
You can monitor KPIs in the Overview section, or dive into more detailed analytics.
Alternatively, you can check performance for individual posts.
Posts: Go to your grid and select the post, then tap View Insights below the image..
Reels: Open your Reels tab, choose a Reel, then tap View Insights above your profile name.
Stories: Open your latest Story by tapping on your profile image. Swipe up on the Story to see analytics.
If you want to check a past Story, follow the instructions above to open Instagram Insights. Then navigate to the Content You’ve Shared section.
How to see Instagram analytics using Socialinsider
A third-party Instagram analytics tool like Socialinsider offers more detailed and comprehensive data than Instagram Insights.
Socialinsider’s Instagram analytics feature gives you cleaner data aggregation, key content trends for your industry, more granular audience insights, post performance reviews, and advanced social media measurement.
All of this useful data is accessible in a single dashboard, with in-depth metrics and analysis covering:
- Paid and organic performance - reach, impressions, engagement rate, Reels views, and more.
- Instagram Stories analytics - tap forward, exit, completion rate, impressions, replies, and best time to post.
- Competitor research - overall performance metrics, specific campaign insights, industry trends, and more.
- Post-level analytics - reactions, comments, shares, saves, engagement evolution.
By harnessing this data in simple and straightforward formats, you can use Instagram analytics to up your game.
Which Instagram metrics should you track?
There are lots of key Instagram metrics that will help you use account analytics to your advantage. But with so much data at your disposal, how do you know the right metrics to track?
If you’re new to the world of data and analytics, it all boils down to what’s important to your business. For some, Instagram marketing is a top-of-funnel exercise to reach a wider audience. For others, it’s a direct sales channel.
Before you dig into your Instagram analytics, you need to get clear on what you’re looking for, and why.
Thinking about the five main areas of Instagram analytics keeps things simple. The most important metrics fall into one of these categories:
- Brand awareness metrics
- Engagement metrics
- Content metrics
- Audience metrics
- Conversion metrics
Let’s take a look at each category in more detail.
Which brand awareness metrics should you track?
Brand awareness metrics show you the reach and visibility of your posts. By tracking the impact of your content, you can understand how your audience recognizes your brand.
Total engagements - track with Socialinsider
The sum of all interactions (likes, comments, shares and saves) on your Instagram posts.
Total engagements indicate how people are engaging with your content at a glance. Lots of engagements means your content is speaking to your audience. A low number suggests there’s an opportunity to do further research into your audience’s wants and needs.
Reach - track with Socialinsider
The total number of unique accounts who have seen your content. For Reels, this applies to the amount of people who have seen your video, regardless of whether they play it.
Monitoring reach ensures your followers and target audience see as many of your posts and Stories as possible. It’s a crucial metric to track, since changes to the Instagram algorithm can affect how your posts show in people’s feeds. Based on this metric, you can optimize your content for platform-wide trends.
Impressions - track with Socialinsider
The total number of times your posts and Stories have been seen.
What’s the difference between tracking reach and impressions? Well, reach just counts the number of accounts who have seen your content. Whereas impressions can include multiple views from the same account.
It’s important to track impressions because it tells you how frequently your content is appearing in people’s feeds. For example, one user could see the same post three times:
- When you publish your post and it appears in their feed
- When their friend shares the post on their Story
- When they click on your profile and view the post again on your grid
This is valuable information on the virality and quality of your content.
Likes - track with Socialinsider
The number of times users have clicked the “like“ button on your posts. A quick and easy way to see if people are enjoying your content—and want more of it.
Comments - track with Socialinsider
The number of times users have shared a response to your post.
This is a more proactive way for users to engage with your content, so it’s a useful indicator of the quality of the relationships you are building. The number of comments will tell you whether a topic is sparking interest and conversation (or even dividing opinion). This is direct feedback you can incorporate into your strategy.
Saves - track with Socialinsider
How many times users have bookmarked your post to view later.
Saves tell you whether your content is relevant and valuable to your audience. Amid the chaos of social media, they care enough to give it their focused time and attention. Or it might be a useful resource they can refer back to in future.
Remember, lots of people can view and appreciate your content, without publicly liking, commenting or sharing. So saves is a strong indicator of how people may be quietly consuming your posts.
Reels views - track with Socialinsider
The number of times your Reels videos have been watched, which includes multiple views by the same user.
This is a good way to measure the reach and popularity of your short-form video content.
Stories views - track with Socialinsider
The number of times your Stories have been watched, which can include multiple views from the same user.
Instagram Story analytics help you understand the reach and engagement of your ephemeral content.
Completion rate on Stories - track with Socialinsider
The percentage of users who have watched your Stories from start to finish.
With lots of content showing in their feeds, users may swipe through Stories from different accounts, without viewing every slide. So if you have a high completion rate on Stories, it tells you that people are interested and engaged with your content.
Which engagement metrics should we track?
Engagement metrics track how users interact with your brand on Instagram. This includes an overall picture of how people actively engage with your page and posts, as well as more detailed metrics on the type of content that performs well. You can leverage these insights to strengthen your content strategy.
Engagement rate by reach or by followers - track with Socialinsider
The percentage of users who interact (like or comment) with your post, out of the total number of accounts reached or your total followers.
Here’s how both types of engagement rate are calculated:
Engagement rate by followers - The average engagement rate per post by followers is calculated as the total engagements (likes and comments) divided by the number of posts the profile has published. The result is then divided by the number of followers, and multiplied by 100 to give a percentage.
Which one is better to use? Well, both tell you if your content is truly resonating with your target audience. The difference is that engagement rate by followers tells you how your content is landing with your existing audience, whereas engagement rate by reach takes non-followers into account (i.e. accounts you are trying to target).
Engagement rate is a major KPI for analyzing and adjusting your content strategy. You can also use engagement rate to benchmark your performance against competitors.
Learn more about Instagram engagement rate here.
Accounts engaged - track with Instagram Insights
The number of unique users who have interacted with your content.
This shows you the portion of your audience that is actively engaging with your brand. It includes data on your audience demographics: gender, top cities, countries and age ranges.
Accounts reached - track with Instagram Insights
The number of unique users who have seen your content.
This shows you your potential audience size—key information if you want to grow your follower base. Like accounts engaged, it includes data on your audience demographics: gender, top cities, countries and age ranges.
Most engaged hashtags - track with Socialinsider and Instagram Insights
The hashtags that generate the highest engagement on your posts.
Hashtags encourage engagement and boost the discoverability of your content. As Instagram SEO becomes increasingly important to performance, Instagram hashtag analytics can help you rank higher in search results.
Engagement on content pillars - track with Socialinsider
You can use it to analyze your own content or competitors’. By judging which pillars perform best and how you stack up to other accounts, you can optimize your content strategy according to what drives the most engagement.
Which content metrics should you track?
Content metrics unlock more in-depth insights on individual post performance. By identifying top-performing themes, topics and formats, you can create content with confidence.
Top-performing posts - track with Socialinsider
The posts with the highest engagement rates.
Alongside birds-eye engagement metrics, post-level insights can make sure your content creation efforts pay off.
Content formats by engagement - track with Socialinsider
How your audience interacts with different types of content.
For example, Reels vs. image posts. This helps you discover your most successful content format and optimize your strategy.
Which audience metrics should you track?
Audience metrics provide detailed information about who is following you. When you understand the demographics and growth of your audience, you can adapt and evolve your strategy to target the right people.
Total followers - track with Socialinsider
The number of users who have chosen to follow your Instagram account.
This represents the size of your existing audience on Instagram (but by no means all the people you could reach).
Followers growth rate - track with Socialinsider
The percentage increase of your followers over a period of time (e.g. in the past week or month).
Monitoring how quickly you are gaining followers is essential intel for your strategy. The same applies to losing followers—it’s not just about what your audience likes, but also what they don’t like.
You can compare your followers growth rate to other metrics and key activity (for example, top-performing posts or campaign performance) to understand what drives page growth.
Age group - track with Socialinsider
Breaks down the age ranges of your followers (18-24, 25-34, etc.).
By ranking your most popular age brackets, you can assess if you are attracting the right audience and refine or optimize your strategy accordingly.
Gender group - track with Socialinsider
Categorizes your followers by gender.
Having a clear picture of your audience composition can highlight opportunities for growth or improvement.
Location - track with Socialinsider
Where your audience is predominantly based.
Mapping the geography of your followers means you can tailor content to different languages or regions.
Which conversion metrics should you track?
Conversion metrics track direct actions users take as a result of your Instagram activity. For example, visiting your website, sharing their details in a lead form, or making a purchase. Conversion metrics are the moment of truth—signs that your Instagram marketing strategy is or isn’t working towards your overall business goals.
Traffic - track with Google Analytics
The volume of users who arrive on your website or landing page from Instagram.
Wherever you choose to direct users, monitoring this metric will help you identify content or activity that drives traffic.
Sales - track with Google Analytics
The number of purchases made by users referred from Instagram.
This is the key to understanding how Instagram can drive revenue for your business.
Leads - track with Google Analytics
The number of potential customers who have shown interest in your product or services via Instagram. For example, through sign-ups, inquiries or downloads.
Instagram marketing can be hugely powerful for generating opportunities, if not sales. Not everyone is going to purchase directly in-app, so leads show you how Instagram contributes to your overall strategy.
What to do with Instagram analytics insights?
Wondering what to do with all that useful data? Making the most of analytics for Instagram can majorly upgrade your social media reporting.
If you track and report on Instagram analytics on a regular basis, you can communicate the ROI of Instagram marketing to stakeholders, and make data-driven decisions to optimize your strategy.
There are a few different ways to use social media analytics to uncover insights for your business.
Make sure you are hitting KPIs
Your Instagram analytics dashboard makes it easy to set goals and measure progress. Auditing your own metrics and tracking your performance compared to other accounts gives you realistic targets to work towards. Clean, clear data visualization makes performance analysis accessible to relevant team members.
Guide your content creation efforts
Using an Instagram analytics tool to track post performance can unlock key insights on where you should be focusing your content creation efforts. If you know what resonates with your audience and what doesn’t, you can manage budget, resources and time much more efficiently.
Invest wisely in paid
The social media landscape can be volatile—especially when it comes to paid. Robust Instagram audience analytics and historic data on your paid ads and organic posts can steer you in the right direction.
Assess updates to the algorithm
It’s easy to panic when you notice a slump in performance, or Instagram announces an update to the algorithm. But not all change is permanent.
Accurately and regularly tracking your performance will help you sort temporary blips from longer-lasting changes. That way you can stay one step ahead, and consider if it’s time to change tack.
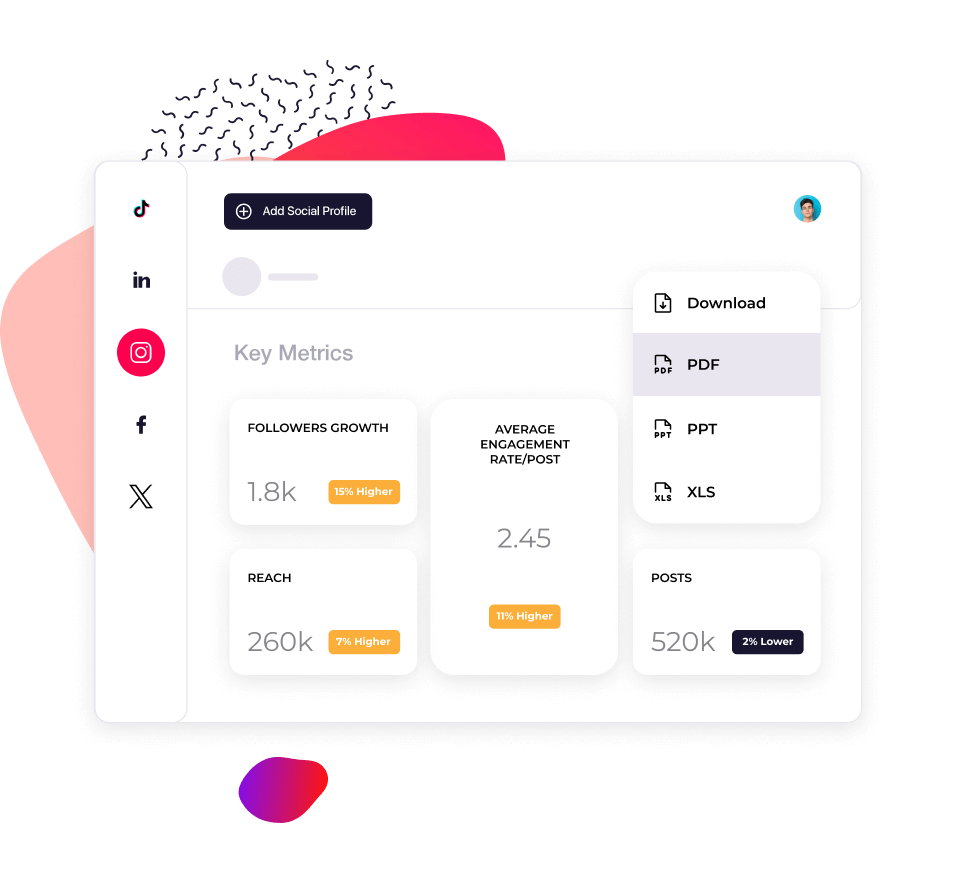
How can Instagram analytics data be exported?
The Instagram Insights tool doesn’t allow you to export analytics data. However, using an analytics tool like Socialinsider, you can export Instagram data in multiple formats: CSV, PPT, PDF, XLS. You can import data to Google’s Looker Studio too.
In Socialinsider, there’s also an option to schedule data downloads, so you can automate your Instagram reporting process. You easily customize your Instagram analytics reports by adding your brand colors and company logo.
Try the Instagram analytics tool that gives you the full picture
Start a free trial of Socialinsider and view Instagram competitor analysis data in minutes.