Analytics Instagram progettati per l'analisi dei competitor
Monitora qualsiasi profilo business Instagram insieme al tuo. Confronta trend di engagement, formati dei contenuti e crescita nel tempo. Scopri dove sei leader e dove migliorare.


Confronta qualsiasi account Instagram (tuo o dei concorrenti)
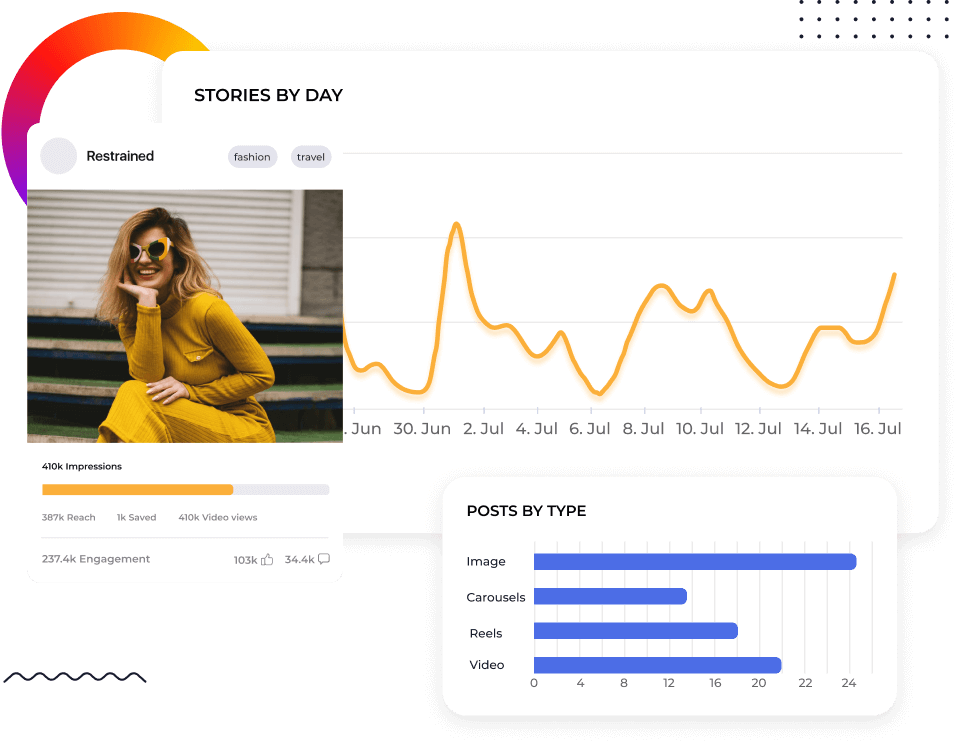
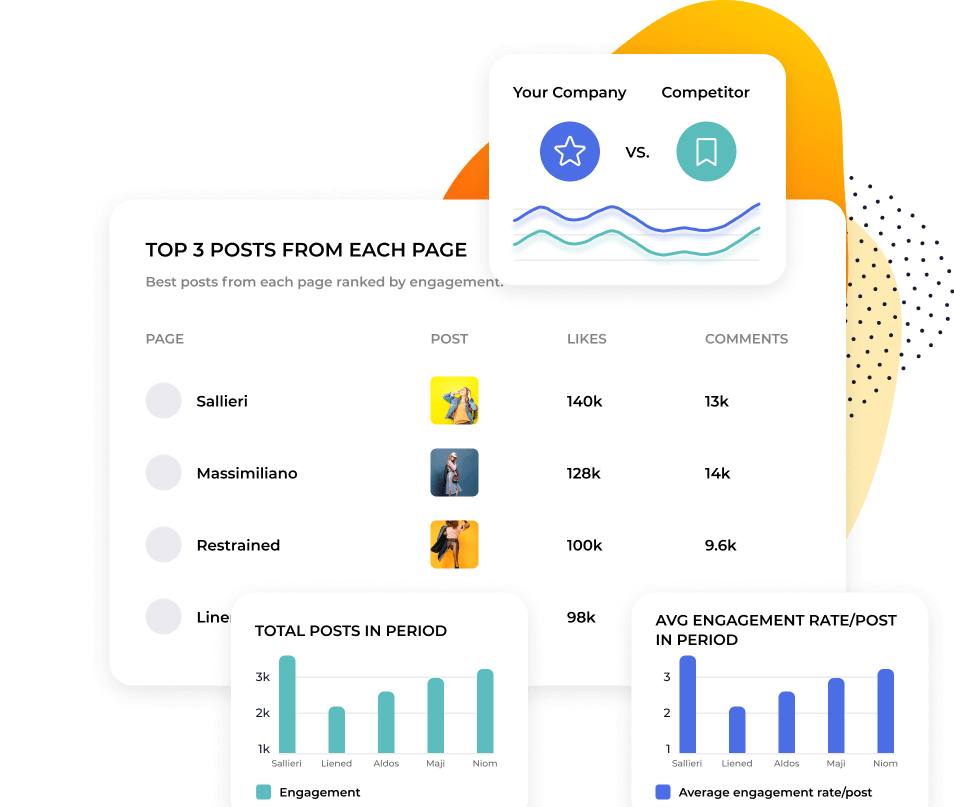
La maggior parte degli strumenti per le metriche Instagram considera i dati dei concorrenti come secondari. Socialinsider li mette al centro. Aggiungi qualsiasi profilo Instagram pubblico e confrontalo subito con il tuo. Scopri Engagement Rate, reach, impression, visualizzazioni dei Reel e comportamento di pubblicazione fianco a fianco.
Fai qualsiasi domanda ai tuoi dati analytics Instagram
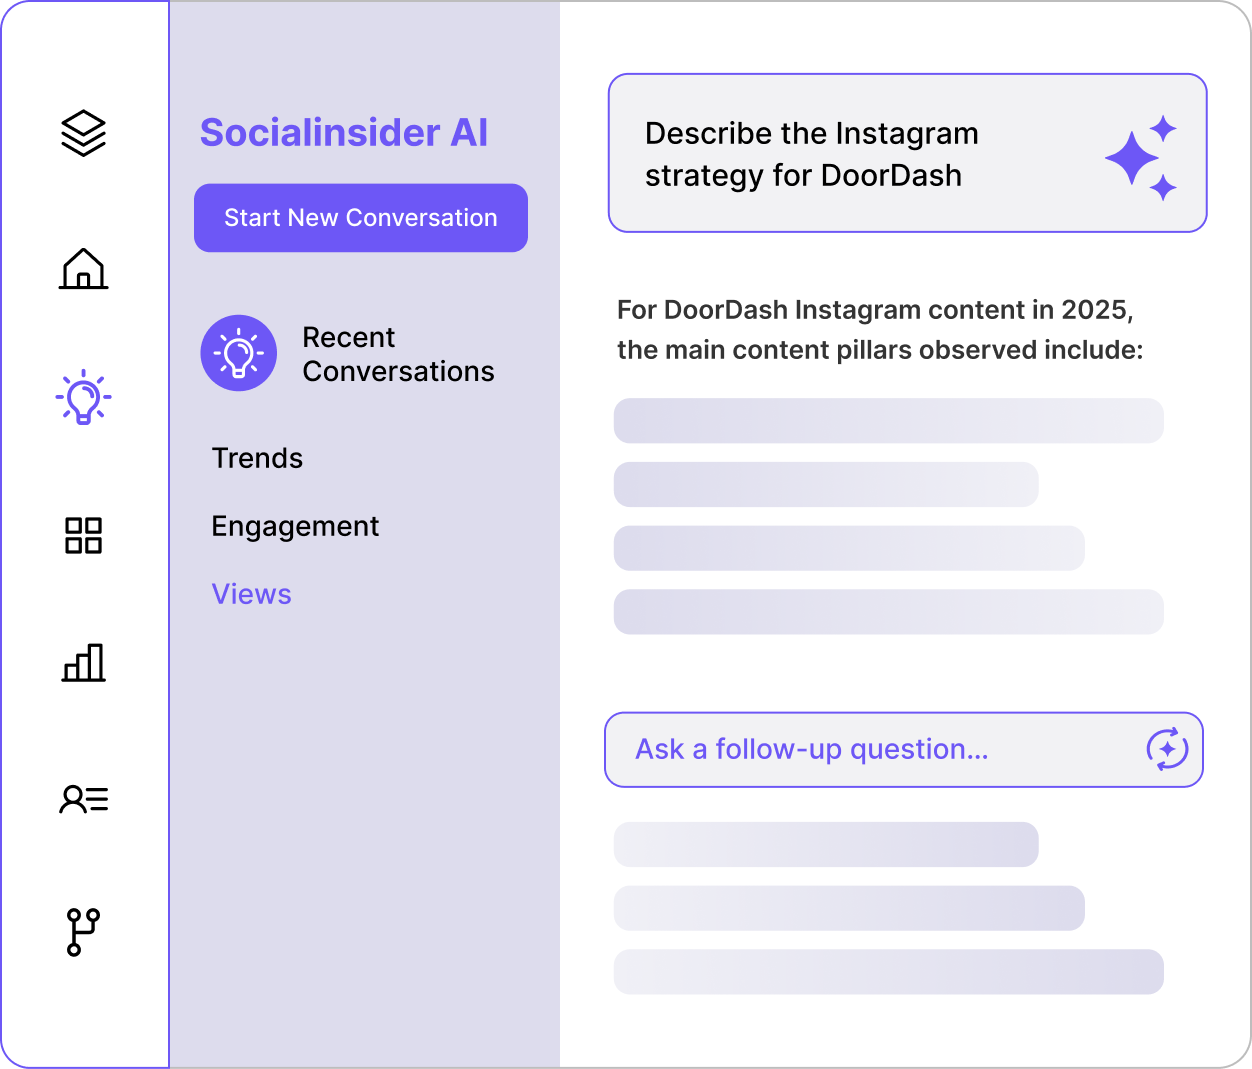
Socialinsider AI analizza il tuo account, i tuoi competitor e i benchmark di settore tutto insieme. Chiedi: Come si confronta il nostro engagement con quello di [competitor] questo trimestre? Ricevi un'analisi scritta su cosa è cambiato, perché conta e cosa dovresti fare. Il contesto competitivo è già integrato.

"L’analisi della concorrenza ha permesso di vedere chiaramente come ci stiamo posizionando sul mercato."

Vai oltre Reels contro caroselli. Scopri cosa funziona davvero
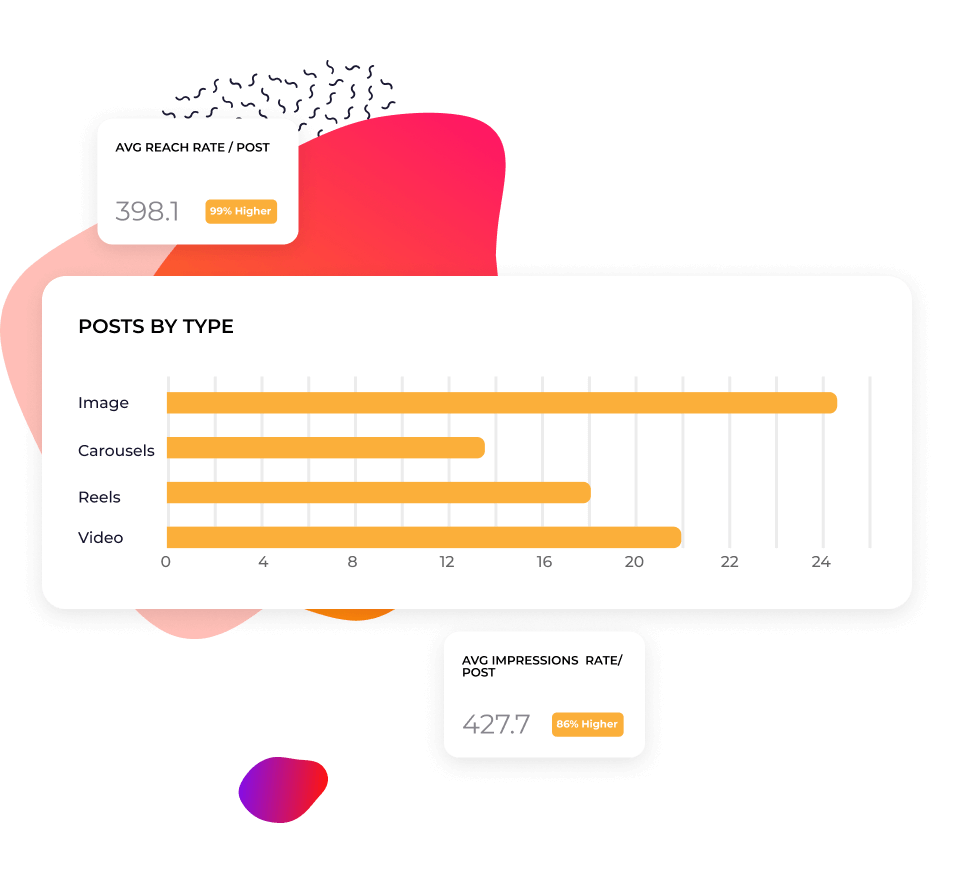
Socialinsider raggruppa i contenuti Instagram in temi tramite AI o puoi creare categorie personalizzate e taggare i post manualmente. Scopri quali contenuti aumentano l'engagement dei competitor, non solo del tuo profilo. Identifica schemi da replicare invece di inseguire post virali occasionali.
Crea report sulle performance senza partire da zero
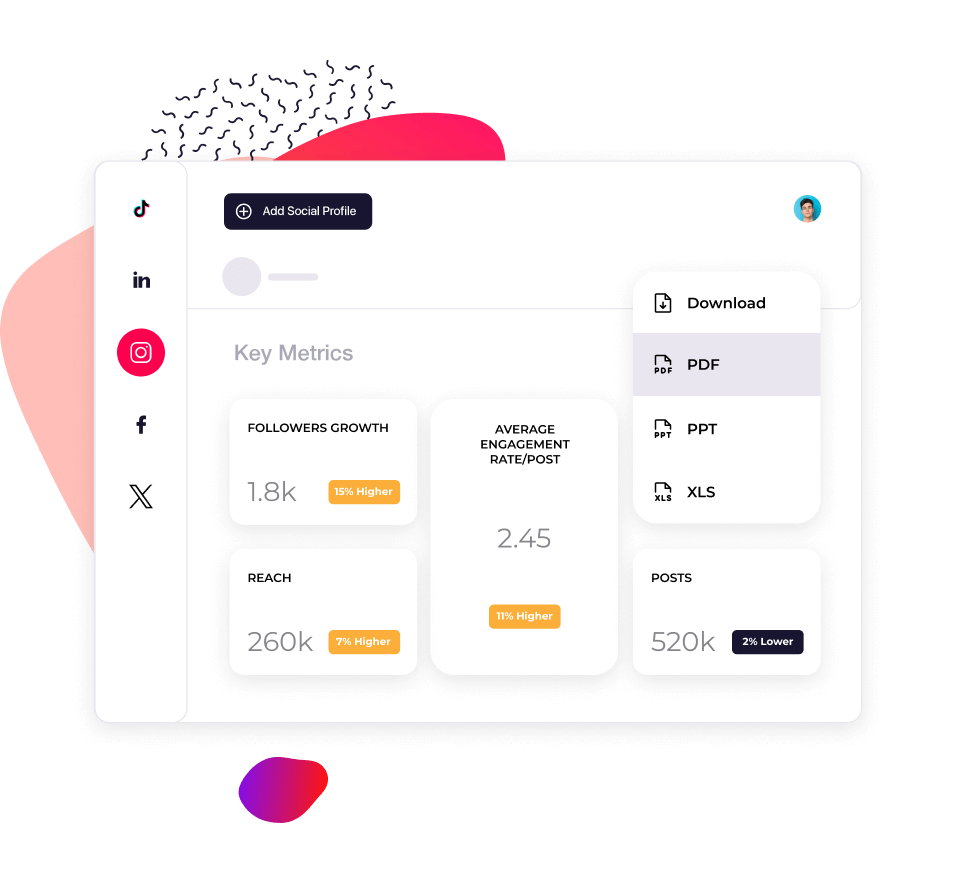
I dati storici ti aiutano a rispondere alla domanda di sempre: questo calo riguarda solo noi o tutto il mercato? Segui l’andamento delle tue metriche e di quelle dei competitor nel tempo. Esporta report in CSV, PDF o PPT con il tuo branding in pochi minuti invece di perdere una giornata tra screenshot.
Cosa dicono di noi
"Anche il servizio clienti è uno dei miei aspetti preferiti. Siete davvero fenomenali. Il vostro team è sempre reattivo, amichevole e disponibile. Una vera eccezione."

"Socialinsider ci ha aiutati a capire se stiamo migliorando o peggiorando, soprattutto rispetto agli altri account che seguiamo."

"Con Socialinsider analizzi i competitor e scopri la performance rispetto al mercato."

"L'analisi del sentiment è fantastica per gli hashtag di Instagram. Questo nuovo dashboard di social media listening mi ha aiutato nella pianificazione a lungo termine."

"Stiamo usando questo dashboard di analytics social media per tutti i nostri 40 clienti social media. Hai tutti i dati di performance in un unico posto."

"Con Socialinsider, il nostro team è diventato più efficiente. Non dobbiamo più perdere tempo a raccogliere dati dei social media. Ora possiamo concentrarci su insights e analisi."

"Usiamo Socialinsider ogni giorno per ottenere insights sui social media, indicare cambiamenti strategici semplici o analizzare la performance di alcuni post."

"In media, un report social media per un brand richiede 1-2 ore di lavoro con Socialinsider. Prima serviva un'intera giornata solo per raccogliere i dati."

"Socialinsider ci ha fatto risparmiare oltre $16.000 all’anno. Ci permette di risparmiare tempo sui report mensili e sulle analisi complesse a lungo termine."

Come tracciare l’Engagement Rate di Instagram su Socialinsider
Gli strumenti di analytics social media e analisi competitor di Socialinsider ti permettono di misurare la performance sui social media, eseguire audit e confrontare i risultati.
Inizia creando un account di prova su Socialinsider.
Aggiungi i tuoi competitor e collega i profili che gestisci.
Ottieni tutte le metriche di engagement per qualsiasi account business Instagram.
Confronta la tua performance con i principali competitor.
Esegui un’analisi cross-channel per valutare la tua performance su Instagram.

Ottieni insights competitivi ed esplora le metriche di analytics social media
Domande frequenti
Hai una domanda? Abbiamo le risposte.
Cosa sono gli analytics di Instagram?
Gli analytics di Instagram ti permettono di raccogliere e analizzare i dati del tuo account per capire come stanno andando i tuoi post e la tua pagina.
Questi dati includono metriche di performance e insights sull’account, come i like ai post, il numero di visualizzazioni delle Stories, i follower e molti altri. Monitorando gli analytics di Instagram, ottieni informazioni preziose sul tuo pubblico, su cosa fanno e su quali contenuti interagiscono. Così puoi ottimizzare la tua strategia di marketing.
Ad esempio, se il report mostra alto engagement con i Reels, puoi decidere di creare più video. Oppure esplori gli insights del pubblico e scopri tanti follower in una città: potresti aprire un account dedicato.
Gli analytics di Instagram sono uno strumento essenziale per il business. Che tu voglia aumentare le vendite, migliorare il servizio clienti o rafforzare la brand awareness, ti aiutano a capire se la tua strategia di social media marketing sta raggiungendo i tuoi obiettivi social media.
Perché gli analytics di Instagram sono importanti?
Gli analytics di Instagram sono fondamentali perché ti aiutano a capire chi è il tuo pubblico, quali contenuti preferisce e le tendenze della piattaforma.
Questo è cruciale per tre motivi:
Per fare buon marketing
Conoscere il tuo pubblico è la base di ogni piano di social media marketing efficace. Quando sai cosa amano, puoi rispondere meglio alle loro esigenze, gusti e interessi.
Nessun altro canale è più reattivo o diretto dei social media.
Per stare al passo con i cambiamenti
Su Instagram, le tendenze cambiano rapidamente. L’algoritmo evolve sempre. Questo porta sia sfide che opportunità. Restare aggiornato può sembrare difficile, ma grazie a Instagram sei sempre vicino al tuo pubblico.
Nessun altro canale è più reattivo o diretto dei social media.
Per restare costante
Alcuni account sembrano avere successi virali immediati, ma dietro c’è molto lavoro. Riuscire su Instagram richiede impegno e costanza.
Monitorare gli analytics nel tempo ti permette di vedere i progressi e capire dove migliorare. Così puoi continuare con ciò che funziona davvero e cambiare quello che non porta risultati.
I vantaggi degli analytics Instagram per il tuo business.
Puoi usare gli analytics Instagram per creare una strategia di Instagram marketing vincente, adattarti ai trend e distinguerti dalla concorrenza.
Scopri cosa fa vibrare la tua audience
Dai Reels coinvolgenti ai carousel educativi, ci sono mille modi per i brand di usare Instagram. Se non sai ancora quale sia il migliore per te, gli analytics Instagram possono mostrarti la strada.
Capendo chi attiri, puoi adattare la tua strategia a target redditizi. Se capisci cosa genera engagement, puoi puntare su contenuti e campagne dal ROI concreto.
Aggiorna la tua strategia seguendo i trend
Dai comportamenti dei consumatori agli aggiornamenti dell’algoritmo, chi fa marketing deve monitorare attentamente i trend.
Analizzando gli analytics Instagram in tempo reale, puoi individuare subito cali e picchi di performance. Sfrutta le opportunità per aumentare reach, follower ed engagement: prova a pubblicare più Stories o sperimenta una nuova funzione appena lanciata. Così ti evolverai insieme all’algoritmo, senza doverci combattere.
Ottieni un vantaggio competitivo
Oltre alla tua performance, i migliori strumenti di analytics Instagram ti mostrano come ti confronti rispetto ai competitor.
Hai notato che un concorrente che pubblica più Stories supera il tuo numero di follower? Oppure vedi delle lacune nella sua strategia: è il tuo momento per brillare? Confrontando i dati dei competitor con gli analytics Instagram, puoi fare scelte intelligenti e strategiche.
Come monitorare gli insights di analytics Instagram?
Come vedere gli analytics di Instagram usando Instagram Insights
Se ti chiedi come controllare gli analytics di Instagram, la piattaforma offre uno strumento integrato chiamato Instagram Insights.
Nota: Per usare questa funzione, devi avere un account business o creator.
Per visualizzare lo strumento analytics nativo e gratuito di Instagram
- Apri il tuo profilo.
- Tocca il pulsante menu ≡ in alto a destra.
- Tocca Insights.
- Vai alle metriche che vuoi vedere.
Puoi monitorare i KPI nella sezione Panoramica oppure approfondire gli analytics dettagliati.
In alternativa, puoi vedere la performance dei singoli post.
Post: Vai alla tua griglia e seleziona il post, poi tocca Visualizza Insights sotto l'immagine.
Reels: Apri la scheda Reels, scegli un Reel, poi tocca Visualizza Insights sopra il nome del profilo.
Stories: Apri la tua ultima Story toccando la tua immagine del profilo. Fai swipe up sulla Story per vedere gli analytics.
Se vuoi controllare una Story precedente, segui le istruzioni sopra per aprire Instagram Insights. Poi vai alla sezione Contenuti condivisi.
Come vedere gli analytics di Instagram con Socialinsider
Uno strumento analytics Instagram di terze parti come Socialinsider offre dati più dettagliati e completi rispetto a Instagram Insights.
La funzione Instagram analytics su Socialinsider ti dà aggregazione dati più pulita, trend di contenuti chiave per il tuo settore, analisi più dettagliata del pubblico, valutazione performance dei post e social media measurement avanzata.
Tutti questi dati utili sono accessibili in una sola dashboard, con metriche approfondite e analisi che comprendono:
- Performance paid e organica - reach, impression, Engagement Rate, visualizzazioni Reels e altro.
- Analytics Instagram Stories - tap avanti, uscita, completion rate, impression, reply e orario migliore per pubblicare.
- Ricerca competitor - metriche di performance globali, insights su campagne specifiche, trend di settore e altro.
- Analytics a livello di post - reaction, commenti, condivisioni, salvataggi, evoluzione dell’engagement.
Grazie a questi dati chiari e semplici, puoi usare gli analytics di Instagram per migliorare la tua strategia.
Quali metriche Instagram dovresti monitorare?
Esistono tante metriche Instagram fondamentali che ti aiutano a sfruttare gli account analytics a tuo vantaggio. Ma con così tanti dati disponibili, come scegliere le metriche giuste da monitorare?
Se sei alle prime armi con dati e analytics, la scelta dipende da ciò che è importante per la tua attività. Per alcuni, il marketing su Instagram serve a raggiungere un pubblico ampio. Per altri, è un canale diretto di vendita.
Prima di analizzare i tuoi Instagram analytics, chiarisci cosa cerchi e perché.
Pensare alle cinque aree principali degli Instagram analytics rende tutto più semplice. Le metriche più importanti rientrano in queste categorie:
- Metriches di brand awareness
- Metriches di engagement
- Metriches sui contenuti
- Metriches sull'audience
- Metriches di conversione
Approfondiamo ogni categoria.
Quali metriche di brand awareness monitorare?
Le metriche di brand awareness mostrano reach e visibilità dei tuoi post. Monitorando l’impatto dei contenuti, capisci come il tuo pubblico riconosce il brand.
Totale engagement - monitora con Socialinsider
La somma di tutte le interazioni (mi piace, commenti, condivisioni e salvataggi) sui tuoi post Instagram.
Il totale dell’engagement ti indica a colpo d’occhio come le persone interagiscono con i tuoi contenuti. Tanti engagement significano che stai parlando al tuo pubblico. Pochi engagement suggeriscono di approfondire cosa desiderano o cercano i tuoi follower.
Reach - monitora con Socialinsider
Numero totale di account unici che hanno visto i tuoi contenuti. Per i Reels, si riferisce al numero di persone che hanno visto il tuo video, anche senza averlo avviato.
Monitorare la reach garantisce che follower e pubblico target vedano quanti più post e Stories possibile. È una metrica cruciale da seguire, considerato che l’algoritmo di Instagram può influire su cosa appare nei feed. Su questa base puoi ottimizzare i contenuti per i trend della piattaforma.
Impression - monitora con Socialinsider
Numero totale di volte che i tuoi post e Stories sono stati visualizzati.
Qual è la differenza tra reach e impression? La reach conta solo gli account unici che hanno visto i tuoi contenuti, mentre le impression comprendono anche più visualizzazioni dallo stesso account.
Monitorare le impression è importante perché ti dice quante volte i tuoi contenuti appaiono nei feed. Ad esempio, un utente può vedere lo stesso post tre volte:
- Quando pubblichi il post e appare nel suo feed
- Quando un amico lo condivide nelle Stories
- Quando visita il tuo profilo e lo visualizza di nuovo nella tua griglia
Queste sono informazioni preziose sulla viralità e sulla qualità dei tuoi contenuti.
Mi piace - monitora con Socialinsider
Quante volte gli utenti hanno cliccato il pulsante “mi piace“ sui tuoi post. Un modo rapido per vedere se i tuoi contenuti piacciono—e se ne vogliono altri.
Commenti - monitora con Socialinsider
Quante volte gli utenti hanno lasciato una risposta ai tuoi post.
È un modo più coinvolgente per interagire, quindi è un buon indicatore della relazione che stai costruendo. Più commenti significano interesse e conversazione (o addirittura dibattito). Questo feedback diretto puoi sfruttarlo subito nella tua strategia.
Salvataggi - monitora con Socialinsider
Quante volte gli utenti hanno salvato il tuo post per rivederlo più tardi.
I salvataggi ti dicono se i tuoi contenuti sono rilevanti e di valore. Tra il caos dei social media, il tuo pubblico riserva loro tempo e attenzione. Oppure è una risorsa utile da consultare in futuro.
Ricorda: molte persone possono apprezzare i tuoi contenuti senza mettere mi piace o commentare. Quindi i salvataggi sono un indicatore forte di come il pubblico consuma i tuoi post in modo discreto.
Visualizzazioni Reels - monitora con Socialinsider
Numero di volte che i tuoi Reels sono stati visti, comprese più visualizzazioni dallo stesso utente.
Un ottimo modo per misurare reach e popolarità dei tuoi video brevi.
Visualizzazioni Stories - monitora con Socialinsider
Numero di volte che le tue Stories sono state viste, anche più volte dallo stesso utente.
Le analytics sulle Stories ti aiutano a comprendere reach e engagement dei tuoi contenuti effimeri.
Completion rate nelle Stories - monitora con Socialinsider
Percentuale di utenti che hanno visto le tue Stories dall’inizio alla fine.
Con tanti contenuti nei feed, molti utenti scorrono velocemente le Stories senza guardare tutto. Un completion rate alto indica interesse e coinvolgimento reale.
Quali metriche di engagement dovresti monitorare?
Le metriche di engagement misurano come gli utenti interagiscono con il tuo brand su Instagram. Offrono una panoramica su come il pubblico interagisce con pagine e post, insieme a metriche più dettagliate sui contenuti di successo. Sfrutta questi insight per rafforzare la tua content strategy.
Engagement rate per reach o per follower - monitora con Socialinsider
Percentuale di utenti che interagisce (mi piace o commento) sul tuo post, rispetto al totale di account raggiunti oppure dei tuoi follower totali.
Ecco come si calcolano le due tipologie di engagement rate:
Engagement rate sui follower - La media di engagement per post sui follower si ottiene dal totale interazioni (mi piace e commenti) diviso per il numero di post pubblicati, poi diviso per il numero dei follower, il tutto moltiplicato per 100 per ottenere la percentuale.
Qual è il migliore da utilizzare? Entrambi ti dicono se i tuoi contenuti colpiscono il pubblico giusto. La differenza: il tasso sui follower indica come i tuoi contenuti funzionano presso la tua base attuale, quello sulla reach considera anche non-follower (cioè gli account che vuoi raggiungere).
L’Engagement Rate è un KPI fondamentale per analizzare e correggere la tua content strategy. Puoi anche usarlo per fare benchmarking con i competitor.
Scopri di più sull’Engagement Rate Instagram qui.
Account coinvolti - monitora con Instagram Insights
Numero di utenti unici che hanno interagito con i tuoi contenuti.
Mostra la quota di audience che interagisce attivamente con il brand. Comprende dati demografici della tua audience: genere, città principali, nazioni ed età.
Account raggiunti - monitora con Instagram Insights
Numero di utenti unici che hanno visto i tuoi contenuti.
Rappresenta il potenziale pubblico totale—un’informazione chiave per crescere in follower. Come per gli account coinvolti, hai dati demografici: genere, città principali, nazioni e fasce d’età.
Hashtag più coinvolgenti - monitora con Socialinsider e Instagram Insights
Gli hashtag che generano il massimo engagement nei tuoi post.
Gli hashtag stimolano l’engagement e aumentano la visibilità dei contenuti. Poiché Instagram SEO ha un ruolo sempre più importante, analizzare gli hashtag ti aiuta a ottenere un posizionamento più alto nei risultati di ricerca.
Engagement sui content pillars - monitora con Socialinsider
Raggruppa i post Instagram per argomento o tema e misura la performance in base alle interazioni degli utenti.
Puoi usarlo per analizzare i tuoi contenuti o quelli dei competitor. Vedi quali pillar performano meglio e ottimizza la tua strategia su ciò che genera più engagement.
Quali metriche di contenuto dovresti monitorare?
Le metriche sui contenuti sbloccano insight più approfonditi sulla performance dei singoli post. Identificando i temi, argomenti e formati migliori crei contenuti con sicurezza.
Post top performing - monitora con Socialinsider
I post con il tasso di engagement più alto.
Oltre alle metriche di engagement a colpo d’occhio, i dati sui singoli post ti assicurano risultati concreti nella creazione dei contenuti.
Formati dei contenuti per engagement - monitora con Socialinsider
Come il tuo pubblico interagisce con i diversi formati di contenuto.
Per esempio, Reels rispetto ai post immagine. Ti aiuta a scoprire il formato migliore e a ottimizzare la strategia.
Quali metriche sull'audience dovresti monitorare?
Le metriche sull'audience danno dettagli su chi ti segue. Quando conosci i dati demografici e la crescita della tua audience, puoi adattarti e puntare al pubblico giusto.
Follower totali - monitora con Socialinsider
Numero di utenti che hanno scelto di seguire il tuo account Instagram.
Rappresenta la dimensione della tua audience attuale (ma non di tutti gli utenti che potresti raggiungere).
Follower growth rate - monitora con Socialinsider
Aumento percentuale dei follower in un dato periodo (es. settimana o mese).
Monitorare quanto velocemente crescono i tuoi follower è fondamentale per la strategia. Vale lo stesso quando li perdi: non conta solo cosa piace, ma anche cosa non piace.
Puoi confrontare il growth rate con altre metriche e attività chiave (top post o performance campagne) per capire cosa fa crescere la pagina.
Fascia d’età - monitora con Socialinsider
Scompone le fasce di età dei tuoi follower (18-24, 25-34, ecc.).
Riconoscendo le fasce più forti, valuti se hai il pubblico giusto e puoi ottimizzare la strategia.
Gruppo di genere - monitora con Socialinsider
Categorizza i follower in base al genere.
Una visione chiara della composizione dell’audience ti mostra opportunità di crescita e miglioramento.
Località - monitora con Socialinsider
Dove si trova principalmente la tua audience.
Mappare la geografia dei follower permette di personalizzare i contenuti per lingue o regioni diverse.
Quali metriche di conversione dovresti monitorare?
Le metriche di conversione misurano le azioni dirette che gli utenti compiono grazie alle tue attività Instagram. Per esempio, visitare il sito web, compilare un form o effettuare un acquisto. Queste metriche sono la prova reale del valore: segnali che la tua strategia Instagram funziona o meno rispetto agli obiettivi di business.
Traffico - monitora con Google Analytics
Volume di utenti che arrivano sul sito o landing page da Instagram.
Ovunque tu voglia indirizzare gli utenti, monitorare questa metrica aiuta a capire quali contenuti o attività generano traffico.
Vendite - monitora con Google Analytics
Numero di acquisti generati dagli utenti provenienti da Instagram.
Fondamentale per comprendere come Instagram può generare fatturato per la tua attività.
Lead - monitora con Google Analytics
Numero di potenziali clienti che hanno espresso interesse per i tuoi prodotti o servizi su Instagram. Per esempio con iscrizioni, richieste o download.
Instagram marketing può essere potentissimo per generare opportunità, anche quando non c’è vendita immediata. I lead illustrano il contributo di Instagram alla tua strategia generale.
Cosa fare con gli insight degli Instagram analytics?
Ti chiedi come sfruttare tutti quei dati utili? Usare al meglio gli analytics per Instagram può migliorare notevolmente il tuo social media reporting.
Se monitori e reporti regolarmente gli Instagram analytics, puoi comunicare l’ROI delle tue attività su Instagram agli stakeholder e prendere decisioni basate sui dati per ottimizzare la tua strategia.
Ci sono diversi modi per usare i social media analytics e scoprire nuovi insight per il tuo business.
Assicurati di raggiungere i tuoi KPI
La dashboard Instagram analytics ti permette di impostare obiettivi e misurare i progressi. Valuta le tue metriche e confronta la tua performance con quella di altri account per fissare target realistici. Visualizzazioni dati pulite e chiare rendono l’analisi delle performance accessibile a tutto il team.
Guida la creazione dei tuoi contenuti
Usa uno strumento Instagram analytics per tracciare la performance dei tuoi post e trovare insight chiave su dove concentrare la creazione di contenuti. Se sai cosa piace al tuo pubblico e cosa no, gestisci budget, risorse e tempo in modo più efficace.
Investi al meglio nel paid
Il mondo dei social media può essere instabile—soprattutto per le campagne a pagamento. Analytics avanzati sull’audience Instagram e dati storici sulle tue campagne paid e post organici ti aiutano a prendere la direzione giusta.
Valuta gli aggiornamenti dell’algoritmo
È facile andare in panico se noti un calo di performance o se Instagram annuncia un aggiornamento sull’algoritmo. Ma non tutti i cambiamenti sono permanenti.
Monitorare regolarmente le prestazioni ti aiuta a distinguere tra cali temporanei e cambiamenti duraturi. Così resti sempre un passo avanti e sai quando è il momento di cambiare strategia.
Come puoi esportare i dati analytics di Instagram?
Lo strumento Instagram Insights non consente di esportare i dati analytics. Tuttavia, con una piattaforma come Socialinsider puoi esportare i dati Instagram in vari formati: CSV, PPT, PDF, XLS. Puoi anche importare i dati su Google Looker Studio.
In Socialinsider puoi programmare i download dei dati e automatizzare così il reporting Instagram. Personalizza facilmente i report Instagram analytics aggiungendo i colori del tuo brand e il logo aziendale.
Prova lo strumento analytics Instagram che ti offre una visione completa
Prova gratuita 14 giorni su Socialinsider e consulta i dati di analisi dei competitor Instagram in pochi minuti.