Social Media Video-Performance-Statistiken 2026
Social Media Video-Engagement-Statistiken und Views nach Markengröße und Videolänge für Instagram, Facebook, TikTok und LinkedIn auf Basis der Daten von 2026.

Wenn ich dich fragen würde, wo du zuerst nach etwas suchst – sei es nach einer Produktempfehlung, einem Tutorial zur Lösung eines bestimmten Problems oder einfach, um dich über die neuesten Nachrichten zu informieren –, was würdest du sagen? YouTube? Oder vielleicht TikTok?
Unabhängig von der Plattform selbst würde ich zuerst auf Video-Content setzen. Liege ich richtig?
Schließlich ist es kein Geheimnis, dass Video-Content heutzutage die Suchanfragen dominiert. Obwohl er generell ansprechender ist, kann ein einfaches Bild manchmal mehr als tausend Worte sagen. Wenn du an die Momente denkst, in denen du einen schnellen Überblick oder eine Lösung mit nur einem Bild brauchst: Wie effektiv ist Video-Content dann?
Versteh mich nicht falsch: Video-Content hat definitiv seine Vorteile. Doch für Marken ist es gefährlich, sich ausschließlich auf Videos zu verlassen – besonders wenn du die Besonderheiten verschiedener Zielgruppen berücksichtigst. Genau deshalb haben wir die Video-Engagement-Statistiken und View-Zahlen auf Instagram, Facebook, TikTok und LinkedIn analysiert. Dabei haben wir untersucht, wie sowohl die Markengröße als auch die Videolänge die Performance auf den einzelnen Plattformen beeinflussen. Bereit zu sehen, was die Daten wirklich sagen?
Zusammenfassung
Instagram-Reels-Statistiken:
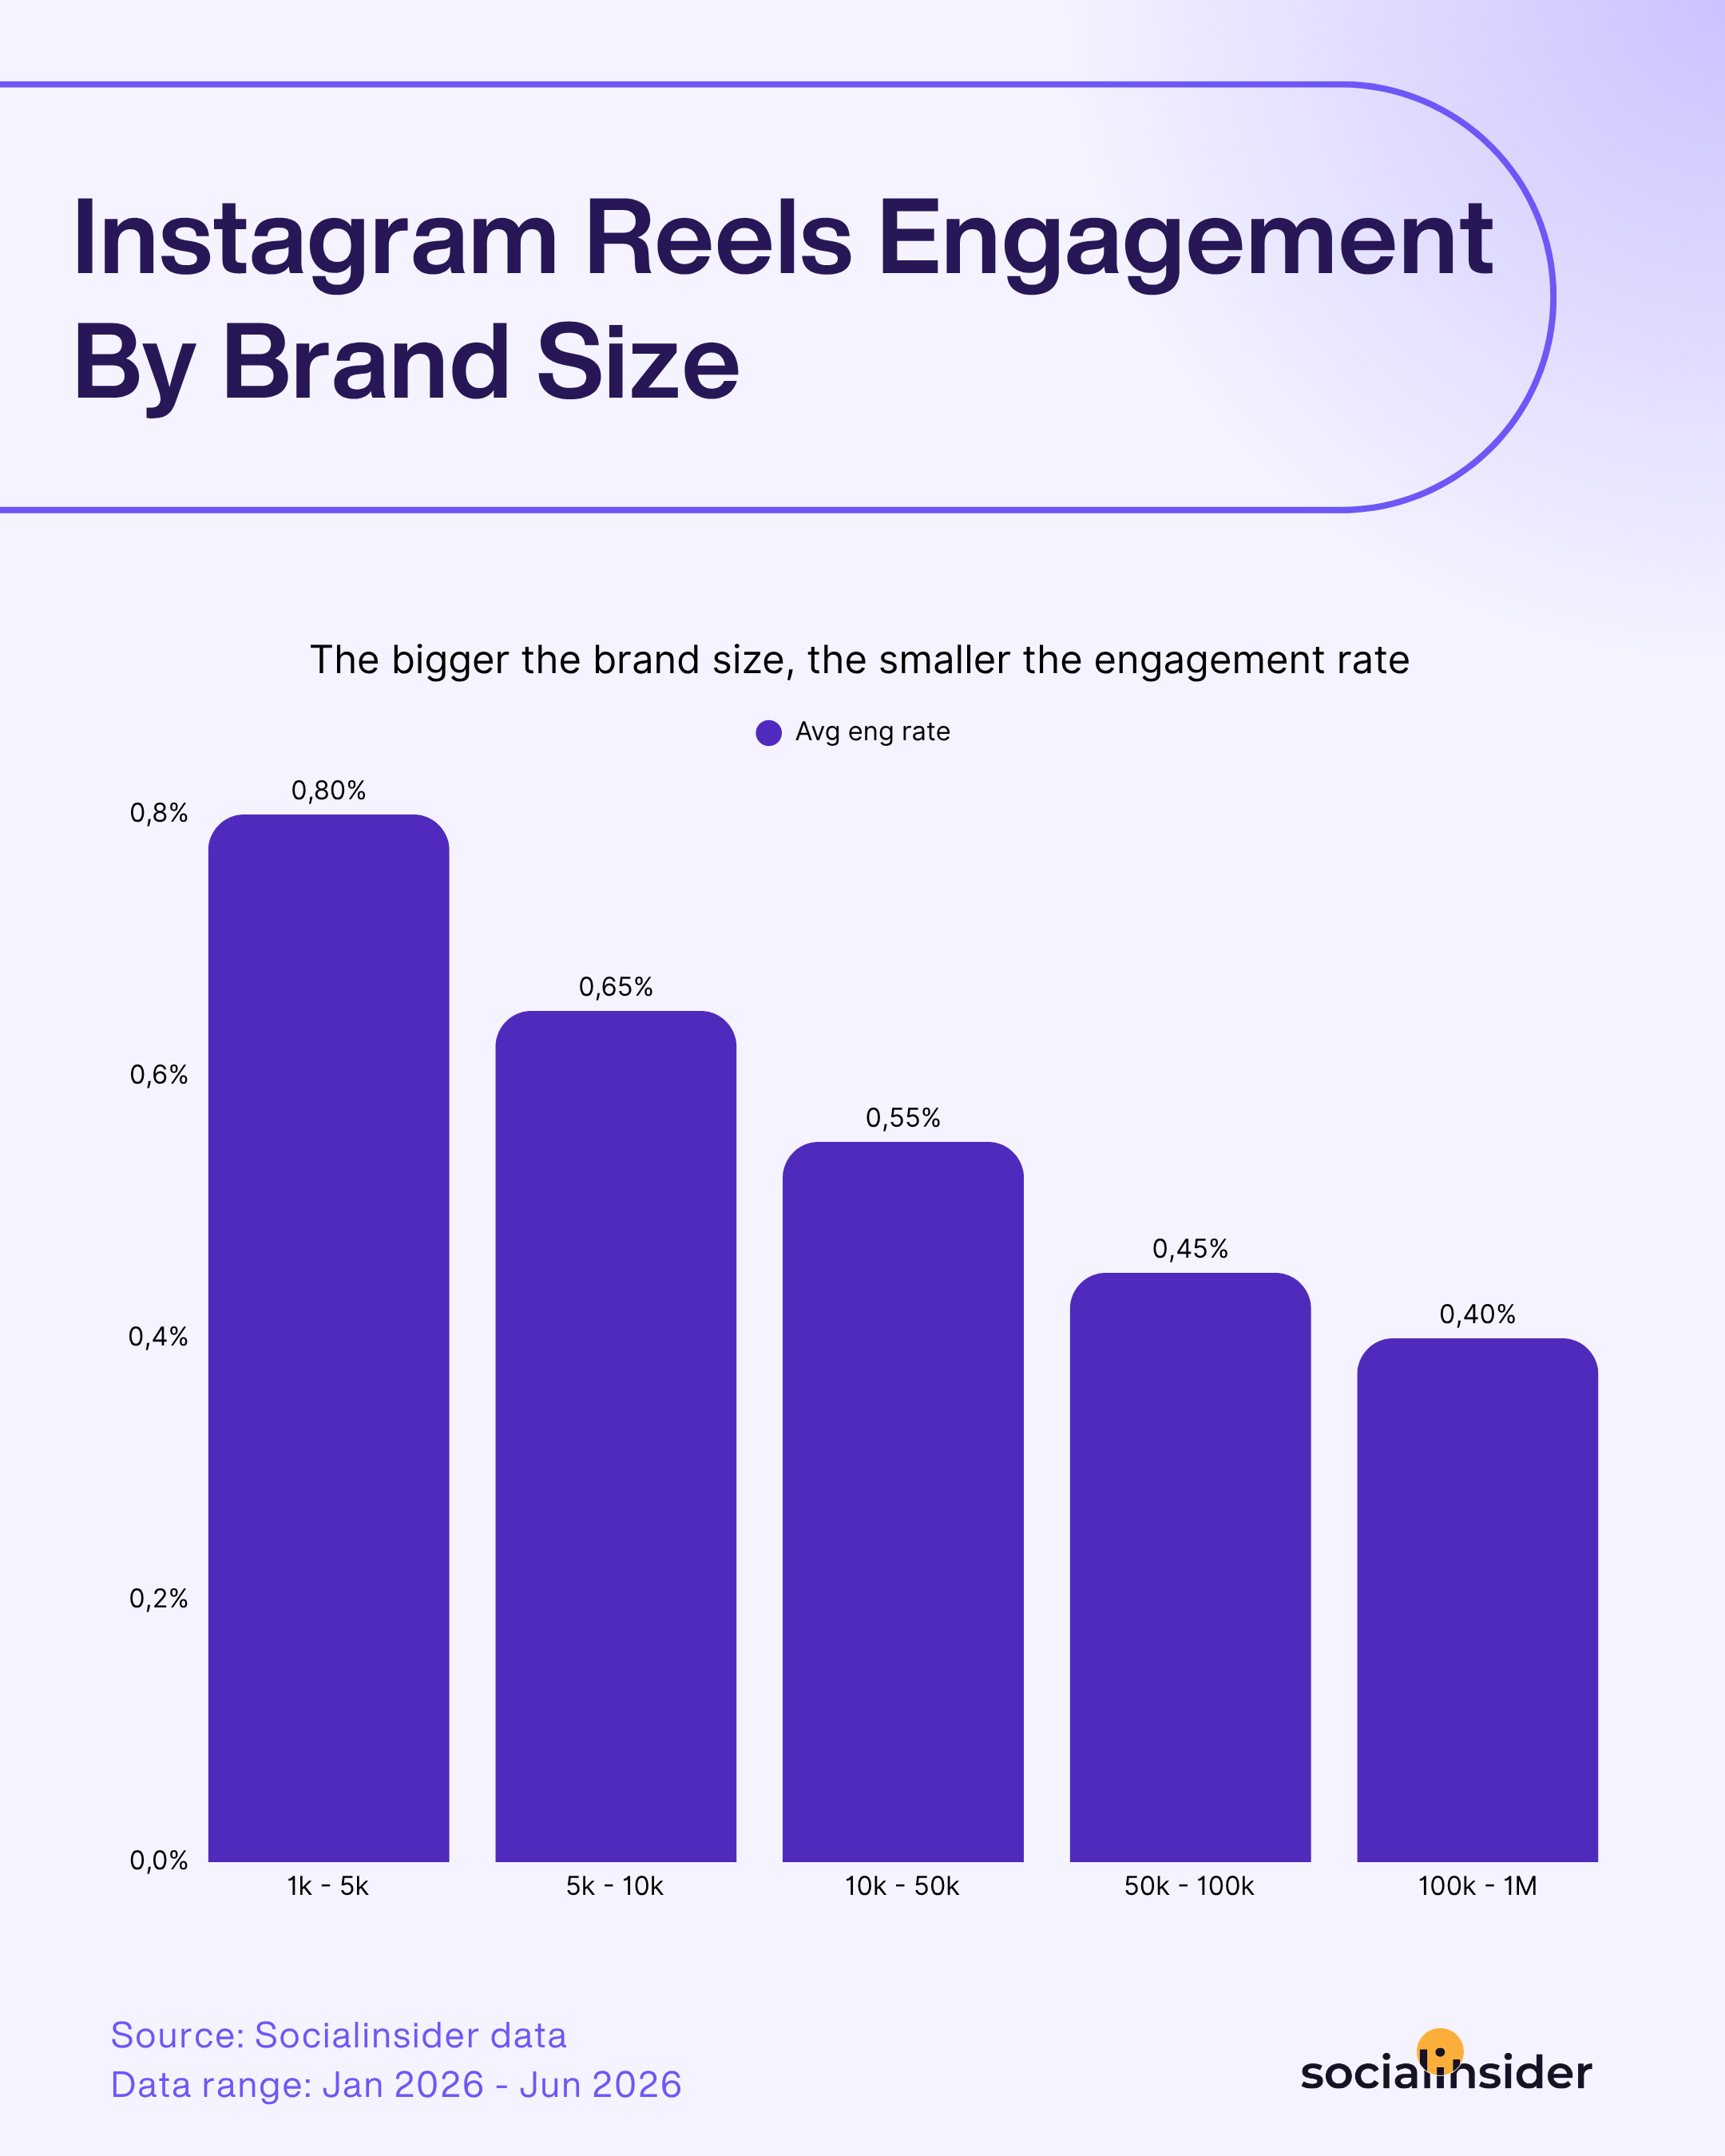
- Kleinere Marken verzeichnen auf Instagram Reels ein deutlich höheres Engagement. Vom kleinsten bis zum größten Markensegment sinkt das Engagement genau um 50 %.
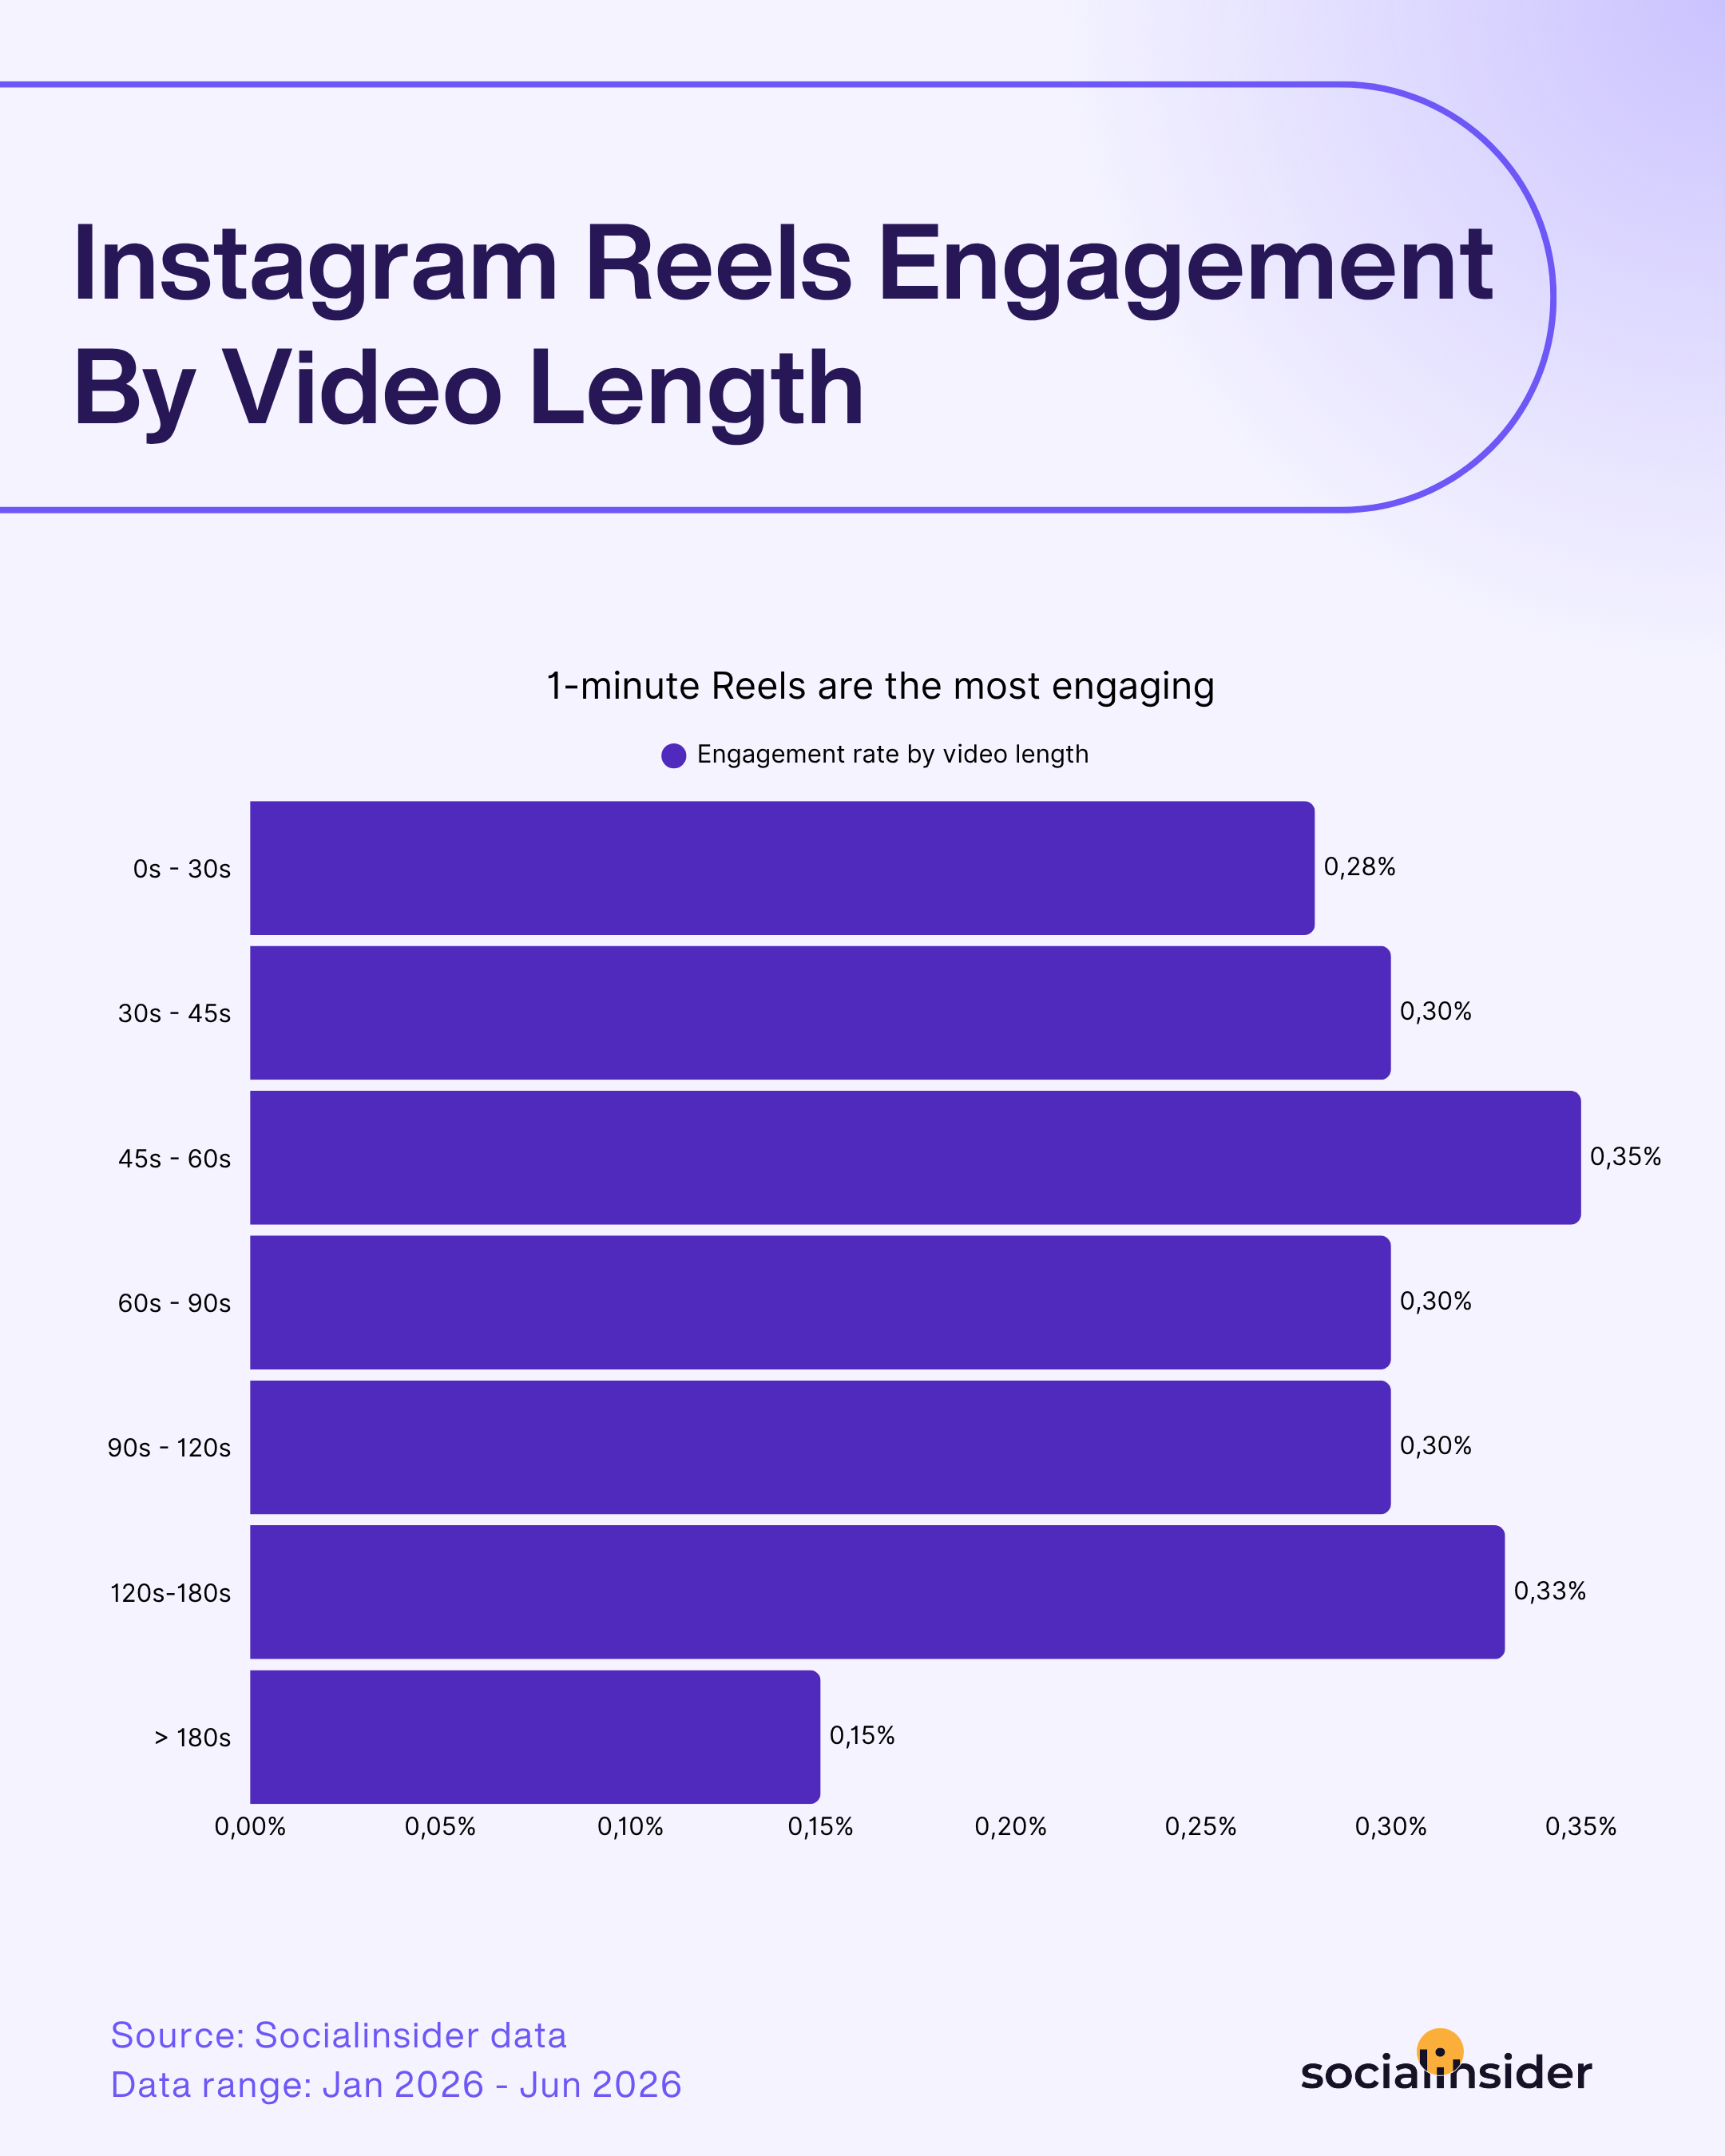
- Zwei Längen schneiden besser ab als der Rest: Reels mit 45–60 Sekunden und Reels mit 120–180 Sekunden – sowohl beim Engagement als auch bei den Views.
- Alles über 180 Sekunden verzeichnet einen starken Rückgang beim Engagement und bei den Views und fällt damit sogar unter die kürzesten Videos.
- Die Views steigen mit zunehmender Markengröße stetig an und schnellen dann deutlich in die Höhe, sobald Accounts die Marke von 100K-1M Followers überschreiten.
Facebook-Video-Statistiken:
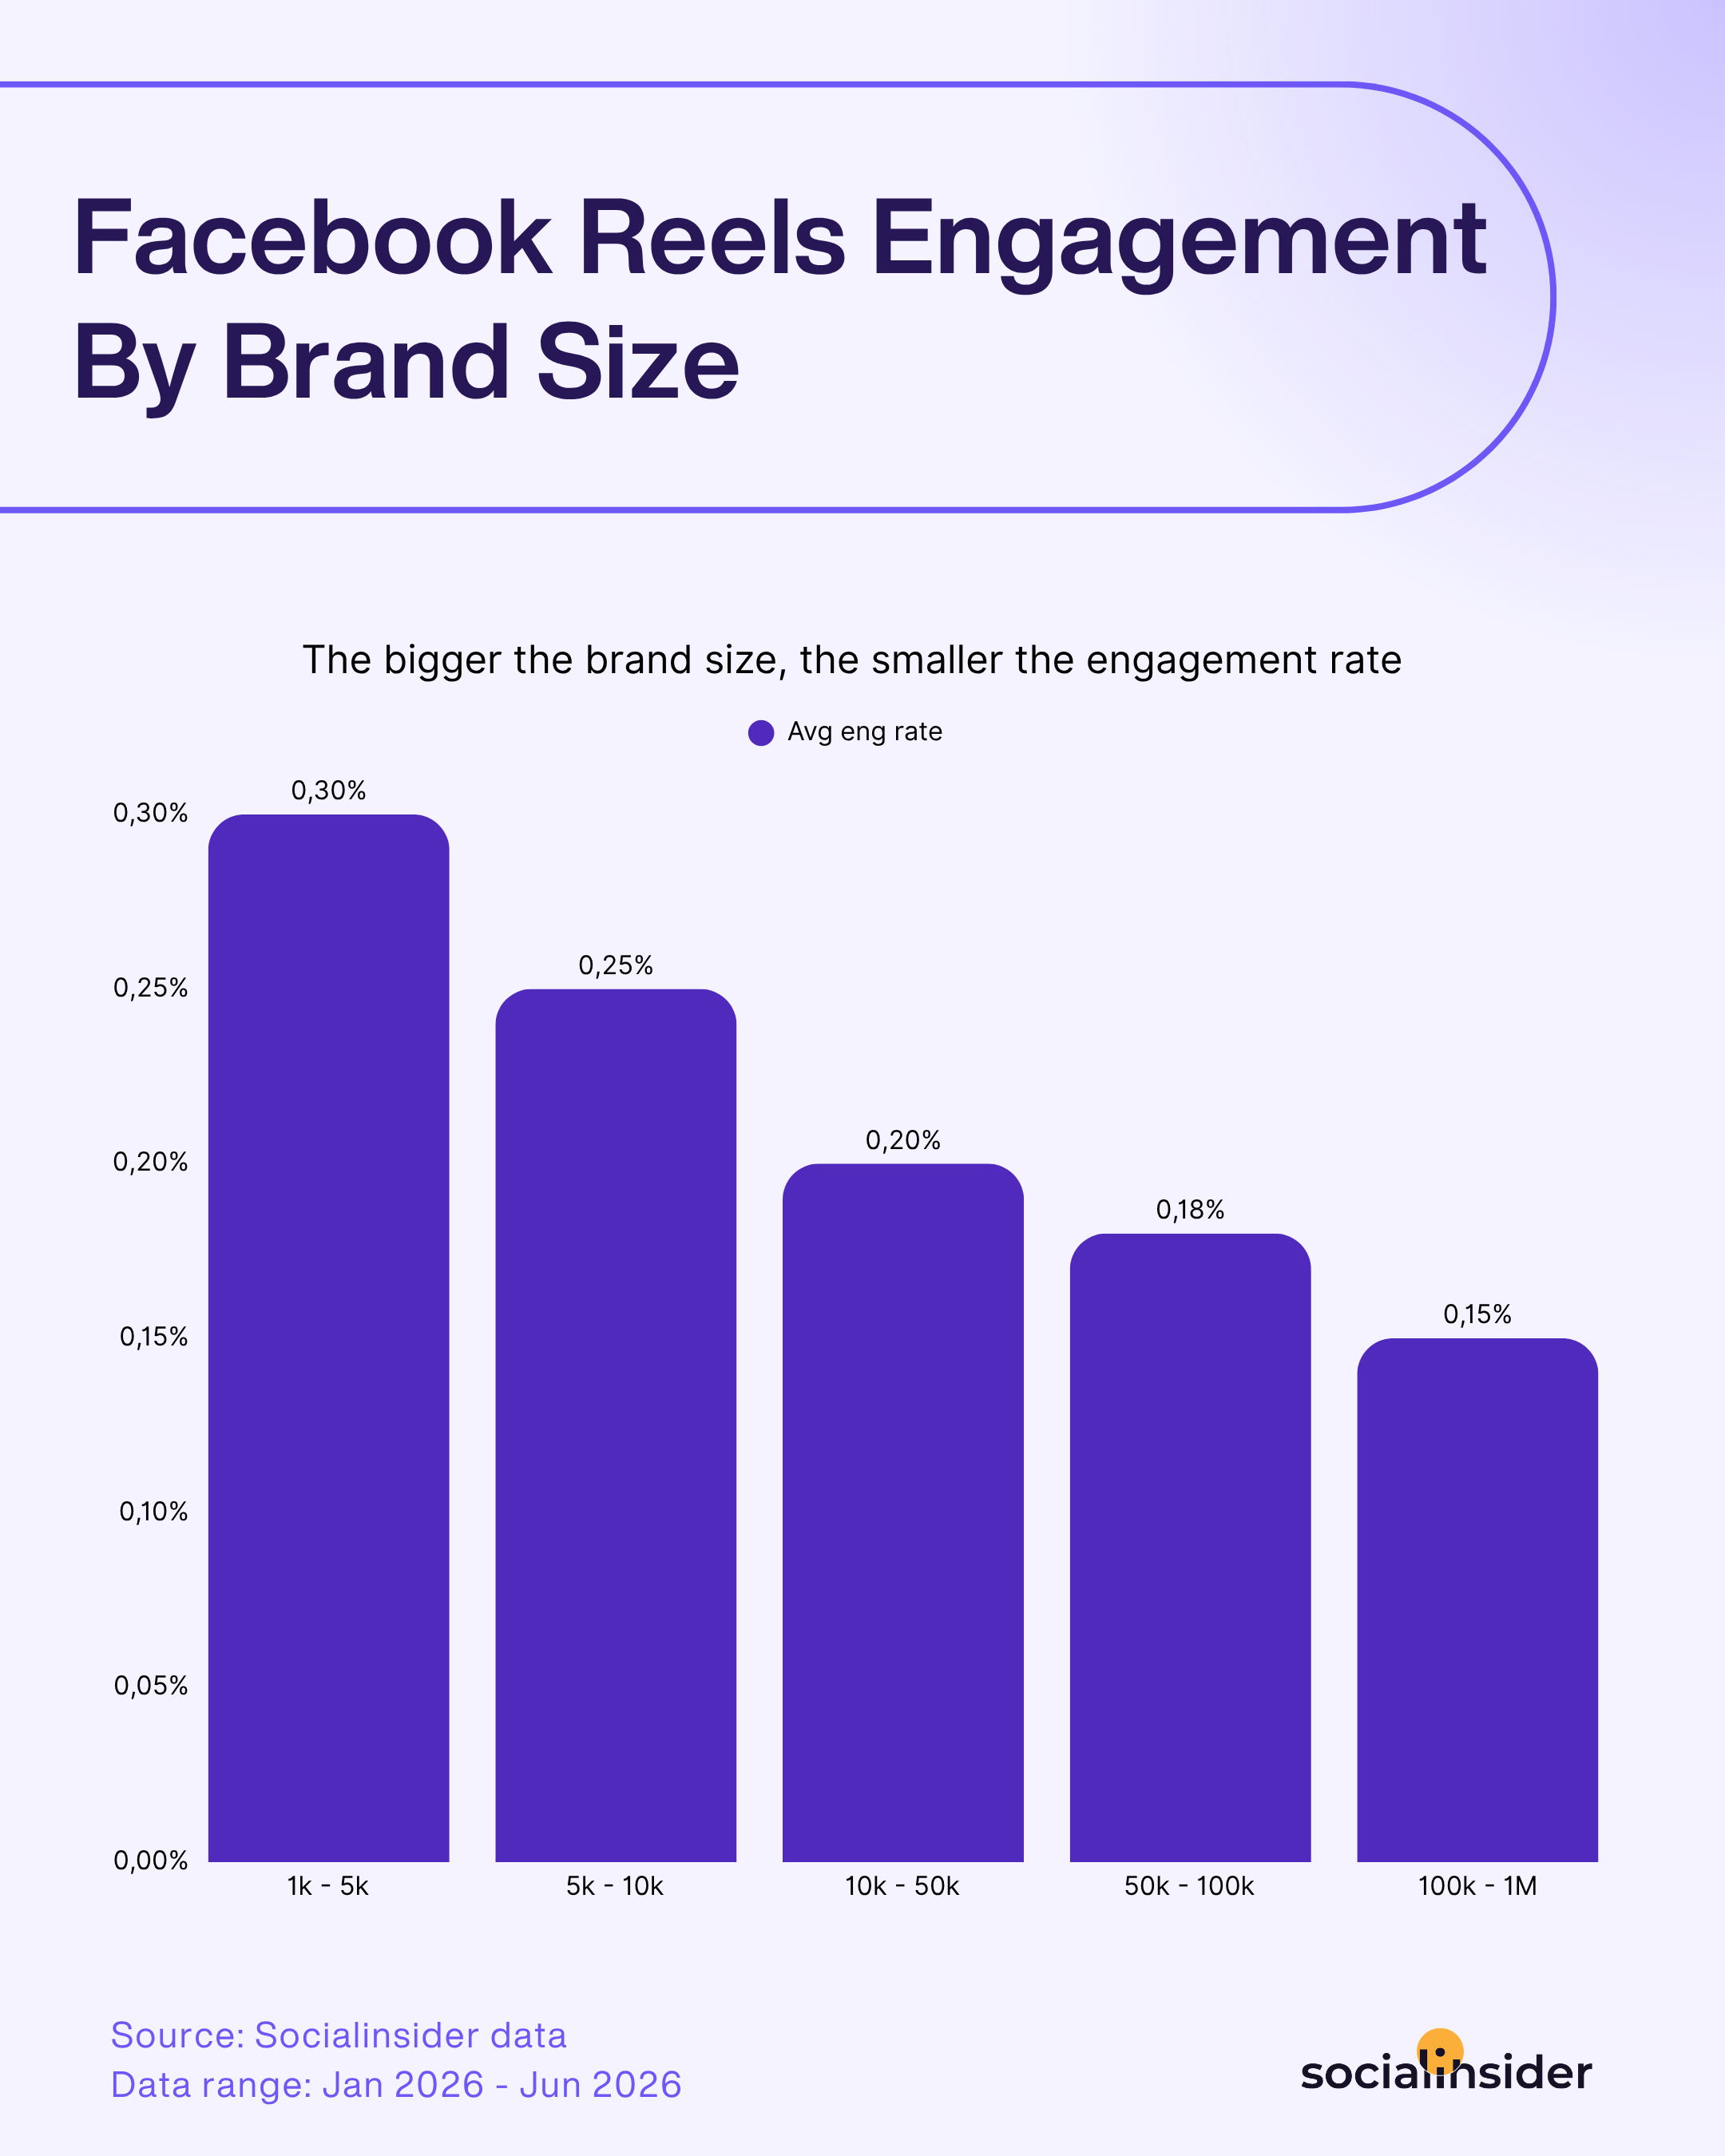
- Das Engagement bei Facebook Reels nimmt mit zunehmender Markengröße stetig ab. Es folgt demselben Trend wie auf Instagram, liegt insgesamt jedoch konstant niedriger.
- Reel-Engagement und Views steigen beide, je länger ein Video läuft, und erreichen im Bereich von 120–180 Sekunden ihren Höchststand, ohne nennenswerte Nachteile bei einer Länge von über drei Minuten.
- Views steigen erwartungsgemäß mit der Größe der Marke und verdoppeln sich ungefähr auf jeder Stufe, statt bei einem einzelnen Schwellenwert sprunghaft anzusteigen.
TikTok-Statistiken:
- Das Engagement bleibt abgesehen von der kleinsten Größenklasse nach Markengröße relativ konstant – anders als der stetige Rückgang bei Instagram und Facebook.
- Videos unter 30 Sekunden erzielen mehr Engagement. Die Views steigen jedoch mit zunehmender Länge stetig an. Der größte Sprung bei den Views zeigt sich bei Videos mit einer Länge von 120–180 Sekunden.
LinkedIn-Video-Statistiken:
- Engagement bleibt bei unterschiedlichen Markengrößen relativ stabil, mit nur einem leichten Rückgang im mittleren Bereich.
- Engagement und Views erreichen beide im Bereich von 120-180 Sekunden ihren Höchststand.
- Views erreichen bei etwa 50K-100K Followern ein Plateau, bevor sie stark ansteigen, sobald Marken den sechsstelligen Bereich erreichen.
Social media Video-Engagement-Statistiken
Du kennst das wahrscheinlich: Du postest ein Video, es funktioniert auf einer Plattform gut, und dann probierst du es auf einer anderen Plattform … und es kommt einfach nicht genauso an. Dann versuchst du zu verstehen, warum. Lag es an der Länge? An der Uhrzeit, zu der du es gepostet hast? An der Größe deiner Zielgruppe? Wenn du so im Blindflug unterwegs bist, fühlt sich jedes Video wie eine als Strategie verkleidete Vermutung an.
Genau diese Lücke sollen diese Video-Engagement-Statistiken schließen. Denn die Wahrheit ist: Instagram, Facebook, TikTok und LinkedIn haben nicht nur unterschiedliche Zielgruppen. Sie folgen auch völlig unterschiedlichen Regeln dafür, was als „ansprechend“ gilt. Sobald du das Muster erkennst, verschwindet das Rätselraten größtenteils.
Instagram Reels Engagement-Statistiken
Instagram ist der beste Ausgangspunkt, um das zu verstehen, denn hier zeigt sich das Muster besonders deutlich. Zwei Faktoren bestimmen fast vollständig, wie ein Reel performt: wie groß dein Konto ist und wie lang dein Video läuft. Beginnen wir mit der Markengröße und damit, was sie darüber verrät, wer tatsächlich zuschaut.
Instagram Reels-Performance-Statistiken nach Markengröße
Beginnen wir also mit der Größe deines Kontos. Es ist verlockend anzunehmen, dass Wachstum alles löst und sich das Engagement ab einer bestimmten Follower-Anzahl von selbst erledigt. Die folgenden Video-Content-Marketing-Statistiken zeigen jedoch das Gegenteil.
Beim Blick auf die Daten fiel mir zuerst der Rückgang auf: genau 50 % von den kleinsten bis zu den größten Marken. Wenn du Videos über mehrere Account-Stufen hinweg verwaltet hast, deckt sich das wahrscheinlich mit deinen Erfahrungen aus erster Hand. Ab etwa 50K wirkt es, als würde der Algorithmus die Lautstärke heimlich herunterdrehen. Kleinere Zielgruppen sehen deinen Content nicht nur, sie sind auch dafür da: Sie schauen ihn an, interessieren sich dafür und interagieren auf eine Weise, wie es größere, passivere Zielgruppen nur selten tun.
Instagram Reels-Performance-Statistiken nach Videolänge
Die Größe der Marke erzählt allerdings nur die halbe Geschichte. Der andere Hebel – und wohl der, den du stärker kontrollieren kannst – ist die Länge. Hier werden die Statistiken zum Videomarketing wirklich interessant, denn der alte Rat „Halte es kurz“ funktioniert nicht mehr wie früher.
Der optimale Bereich lässt sich diesmal nicht so eindeutig auf ein einziges Zeitfenster eingrenzen. Das Engagement erreicht tatsächlich bei 45–60 Sekunden seinen Höhepunkt, bevor es im Bereich von 60–120 Sekunden leicht zurückgeht und zwischen 120 und 180 Sekunden wieder ansteigt. Mit anderen Worten: Reels, die etwas ausführlicher als das „Schnellformat“ sind, belohnen dich tendenziell doppelt: einmal dafür, dass du effizient auf den Punkt kommst, und erneut, wenn du die zusätzliche Zeit nutzt, um etwas mit mehr Tiefe zu erstellen.
Unmissverständlich ist jedoch der starke Einbruch nach der Drei-Minuten-Marke. Sobald ein Reel die 180-Sekunden-Marke überschreitet, sinkt das Engagement stark und fällt auf weniger als die Hälfte seines Höchststands. Das ist weniger ein sanfter Rückgang als vielmehr eine klare Obergrenze: Instagram-Zielgruppen folgen dir auch bei einer längeren Story, aber nur bis zu einem gewissen Punkt.
Strategische Taktiken, um das Engagement deiner Instagram Reels zu steigern
- Setze 45–60 Sekunden als deine Standardlänge. Wenn du nicht sicher bist, wie lang ein Reel sein sollte, ist das die sicherste Wahl. Es ist lang genug, um einen Punkt auszuführen, aber kurz genug, um die Aufmerksamkeit von Anfang bis Ende zu halten – ohne unnötige Längen.
- Nutze das Zeitfenster von 120–180 Sekunden für Content mit echtem Mehrwert. Dieser Bereich eignet sich besonders für Tutorials, Mini-Fallstudien oder Storytelling, das Raum für seine Entwicklung braucht. Ziehe eine einfache Idee nicht künstlich in die Länge, sondern nutze dieses Format nur, wenn du wirklich so viel Mehrwert zu bieten hast.
- Nutze aufeinander aufbauenden Content, um Serienkonsum zu fördern. Veröffentliche nicht einfach zufällige Einzelbeiträge, sondern plane aufeinander aufbauenden Content wie „Teil 1“, „Teil 2“ oder ein wiederkehrendes Format wie einen täglichen Tipp. Zuschauer kommen eher zurück und klicken auf „Folgen“, wenn sie wissen, dass noch mehr kommt.
Facebook Reels Engagement-Statistiken
Facebook zeigt ein klares Muster. Doch es ist nicht die einzige Plattform, auf der die Markengröße die Performance beeinflusst. Facebook erzählt eine ähnliche Geschichte, allerdings mit einer deutlich steileren Kurve. Wenn du dich auf Facebook-Video-Statistiken verlässt, um deine Strategie zu steuern, zeigen die Zahlen deutlich, warum sich die Plattform für Engagement wie Treibsand anfühlen kann.
Facebook Reels Performance-Statistiken nach Markengröße
Bei Facebook setzt sich das Engagement-Muster dort fort, wo Instagram aufgehört hat – nur ausgeprägter. Auch hier wirkt sich das Wachstum gegen dich aus, und der Rückgang erfolgt schneller.
Sobald eine Marke den Bereich von 100K–1M erreicht, ist das Engagement auf etwa die Hälfte des Werts der kleinsten Größenklasse gesunken. Dieser Rückgang verläuft stetig und gleichmäßig, statt bei einer bestimmten Größenklasse plötzlich stark abzufallen. Dahinter steckt ein bekanntes Problem: passives Ansehen. Der Facebook-Feed ist nicht wie Reels auf Videoentdeckung ausgelegt. Deshalb gehen Inhalte in einem Stream aus Links, Shares und Memes unter. Wenn dein Video nicht fast sofort Interaktion auslöst, wird es schnell verdrängt. Eine größere, passivere Followerschaft verschärft dieses Problem noch weiter.
Facebook Reels Performance-Statistiken nach Videolänge
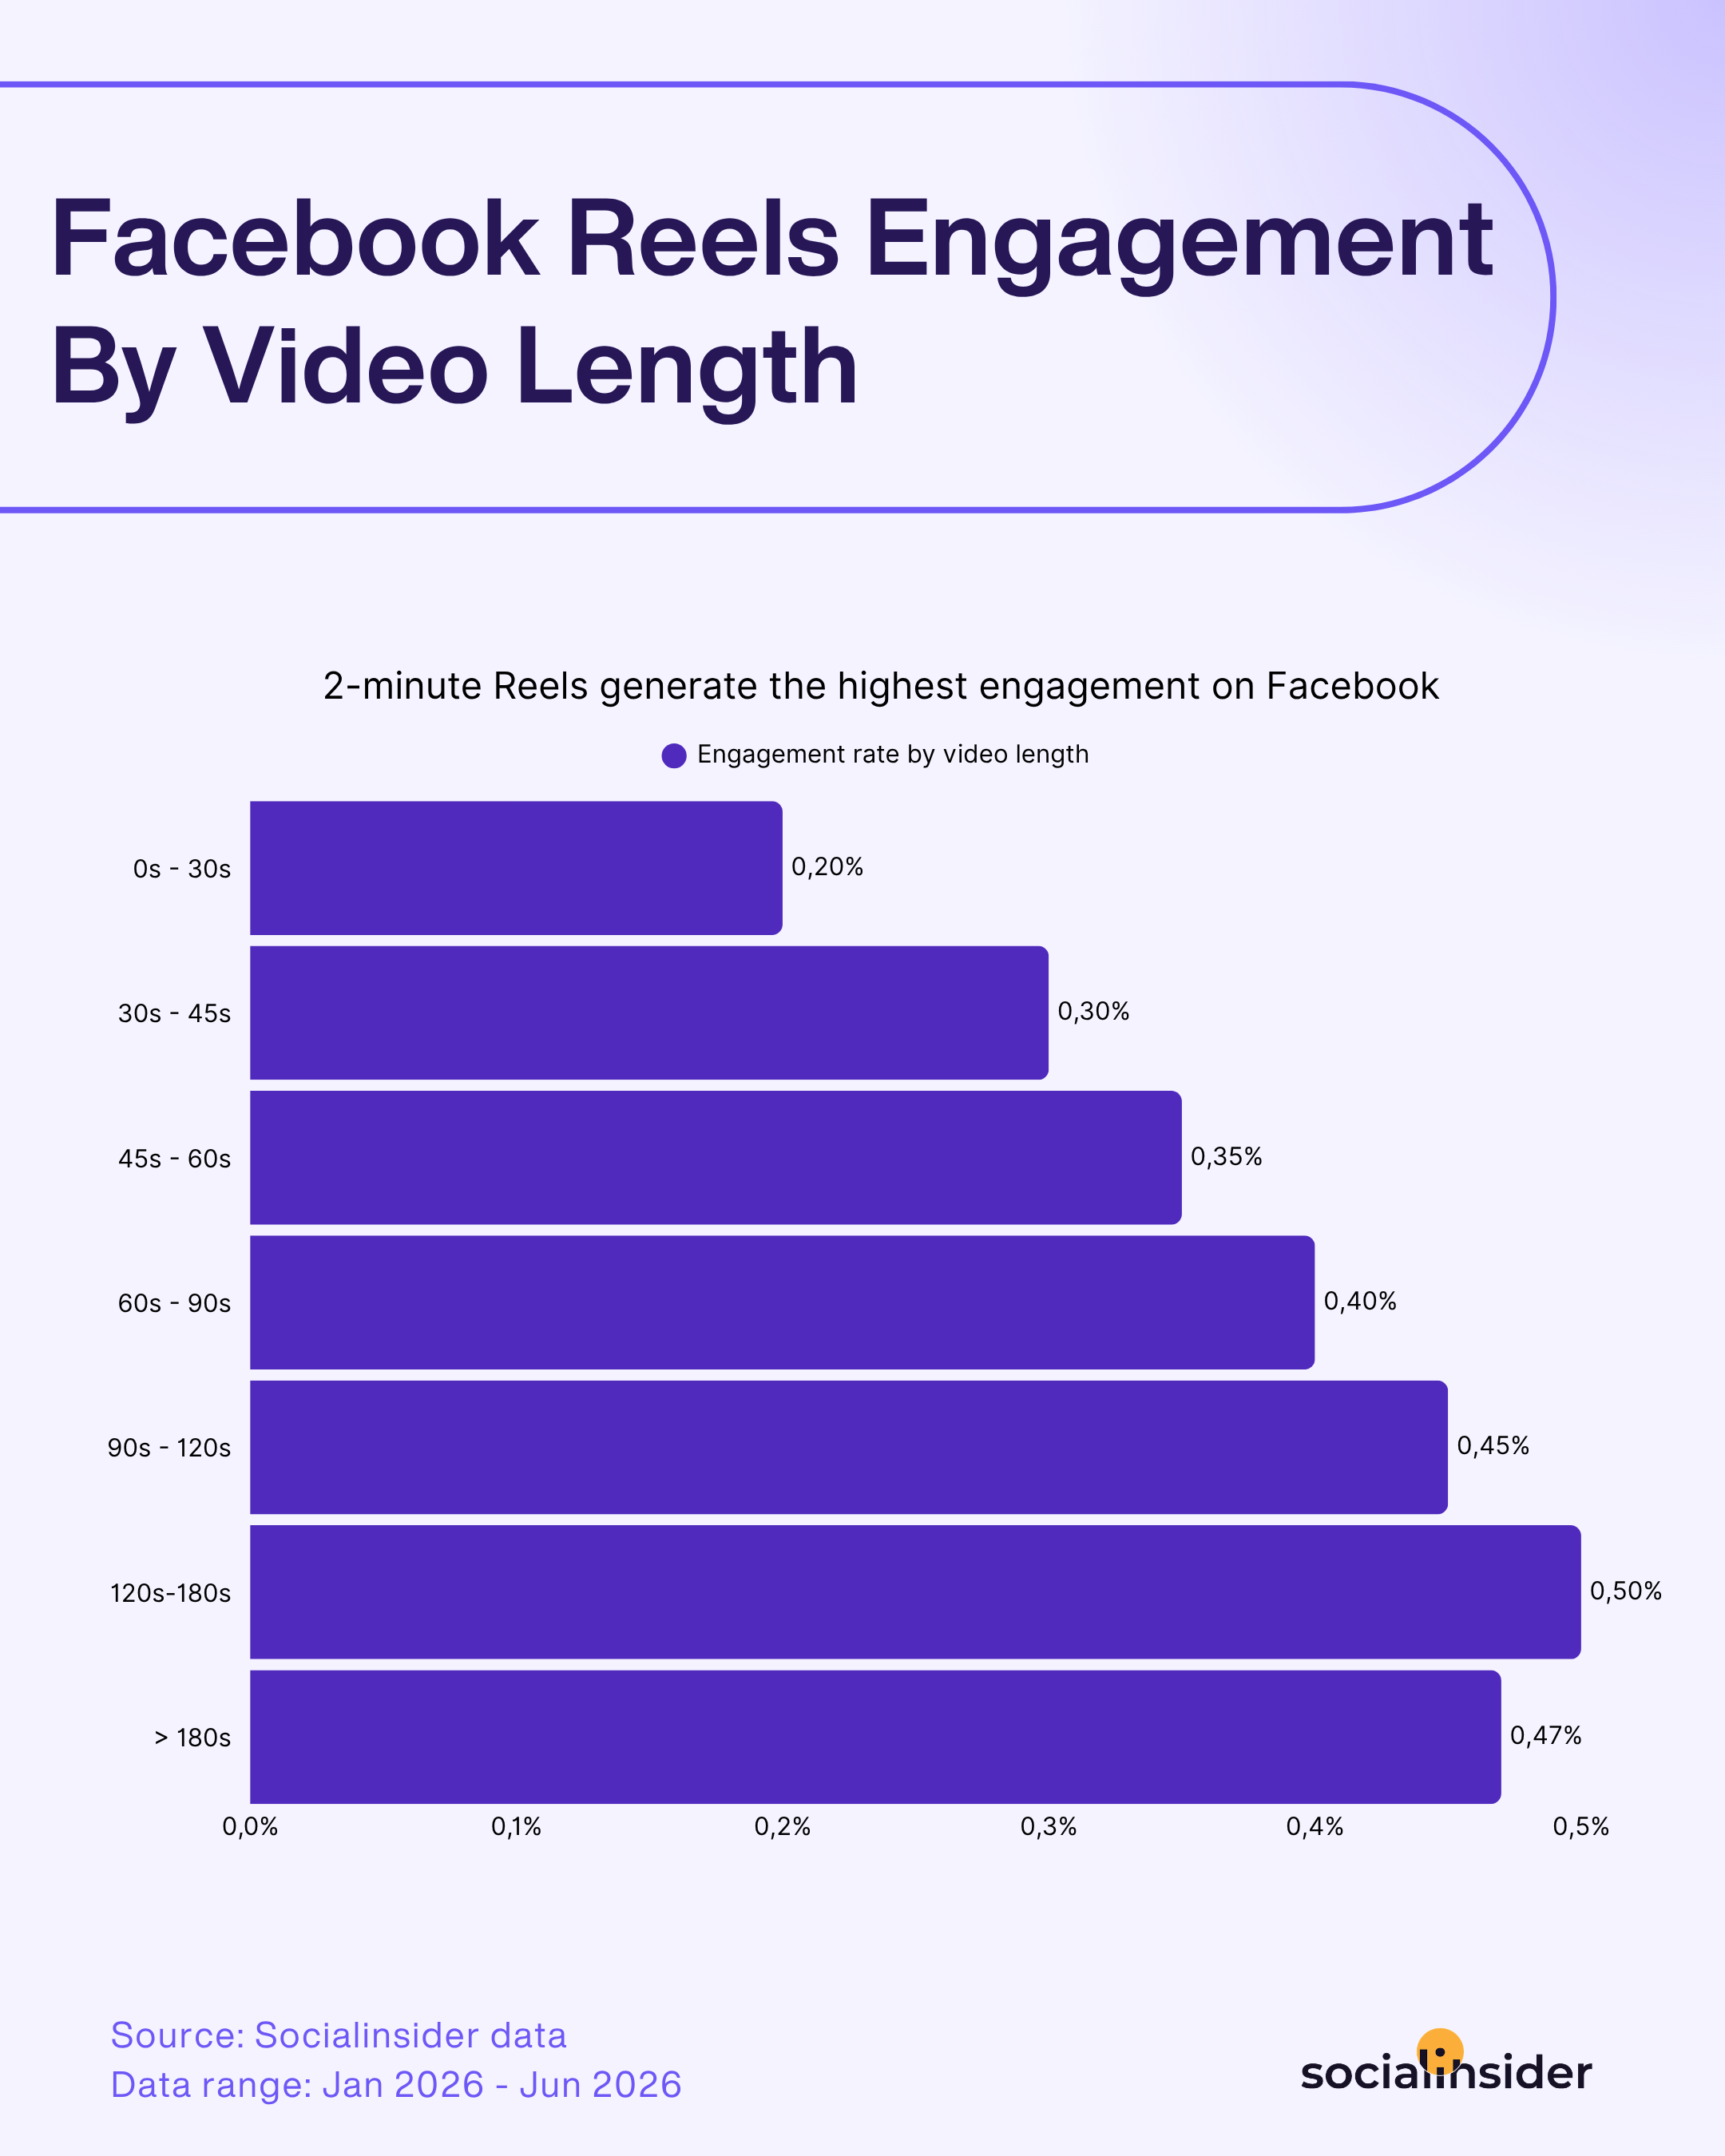
Die Videolänge erzählt auf Facebook allerdings eine ganz andere Geschichte. Und das sind vermutlich bessere Nachrichten als die Daten zur Markengröße. Während ein wachsendes Konto dir schadet, wirkt es sich fast durchgehend zu deinem Vorteil aus, wenn du deinem Video mehr Zeit gibst, sich zu entfalten.
Das Engagement steigt stetig von den kürzesten Videos bis zum Bereich von 120–180 Sekunden an, wo es seinen Höhepunkt erreicht. Anders als bei Instagram gibt es danach keinen starken Einbruch. Videos von über drei Minuten behalten fast ihr gesamtes maximales Engagement und gehen nur leicht zurück. Das ist ein deutlich anderes Muster als der starke Einbruch bei Instagram nach 180 Sekunden. Auf Facebook wird ein gut gemachtes längeres Video nicht dafür abgestraft, dass es länger ist.
Das entspricht unseren Erwartungen an die Facebook-Zielgruppe. Im Bereich ab 90 Sekunden bleibt genug Zeit, um eine Geschichte zu erzählen, Vertrauen aufzubauen oder etwas richtig zu erklären. Die Zuschauer scheinen hier bereit zu sein, dranzubleiben, statt abzuspringen, sobald ein Video über die Länge von „Short-Form“-Content hinausgeht.
Strategische Maßnahmen, um das Engagement deiner Facebook Reels zu steigern
- Setze nach Möglichkeit standardmäßig auf 120–180 Sekunden. Hier erreicht das Engagement seinen Höchststand. Anders als bei Instagram wird es dir hier nicht zum Nachteil, wenn du längere Videos veröffentlichst. Wenn du Facebook Reels bisher aus Gewohnheit auf 60 Sekunden begrenzt hast, ist das das deutlichste Signal, damit aufzuhören.
- Fordere im passenden Kontext zum Engagement auf, nicht in Bildunterschriften. Statt „Gefällt mir“ und „Teilen“ in den Beitragstext zu schreiben, baue die Aufforderung direkt ins Video ein. Eine Zeile in der Mitte wie „Markiere jemanden, der sich darin wiedererkennt“ oder eine Frage im Schlussbild kommt meist besser an, weil die Zuschauer zu diesem Zeitpunkt bereits dabei sind.
- Setze stärker auf Nostalgie, Erzählbögen oder klare Meinungen. Die Facebook-Nutzerbasis ist tendenziell älter. Videos, die Erinnerungen ansprechen, eine klare Haltung zeigen oder etwas Drama bieten, erzielen meist bessere Ergebnisse als trendbasierter Content, der für ein jüngeres Publikum mit schnellerem Scrollverhalten entwickelt wurde.
TikTok-Video-Engagement-Statistiken
Während das Engagement bei Instagram und Facebook abnimmt, wenn Konten wachsen, sprengt TikTok dieses Muster fast vollständig. Die Plattform folgt einer anderen Logik: Hier zählen Video-Engagement-Statistiken deutlich mehr als die Frage, wer sie veröffentlicht oder wie viele Followers hinter dem Konto stehen.
TikTok-Video-Performance-Statistiken nach Markengröße
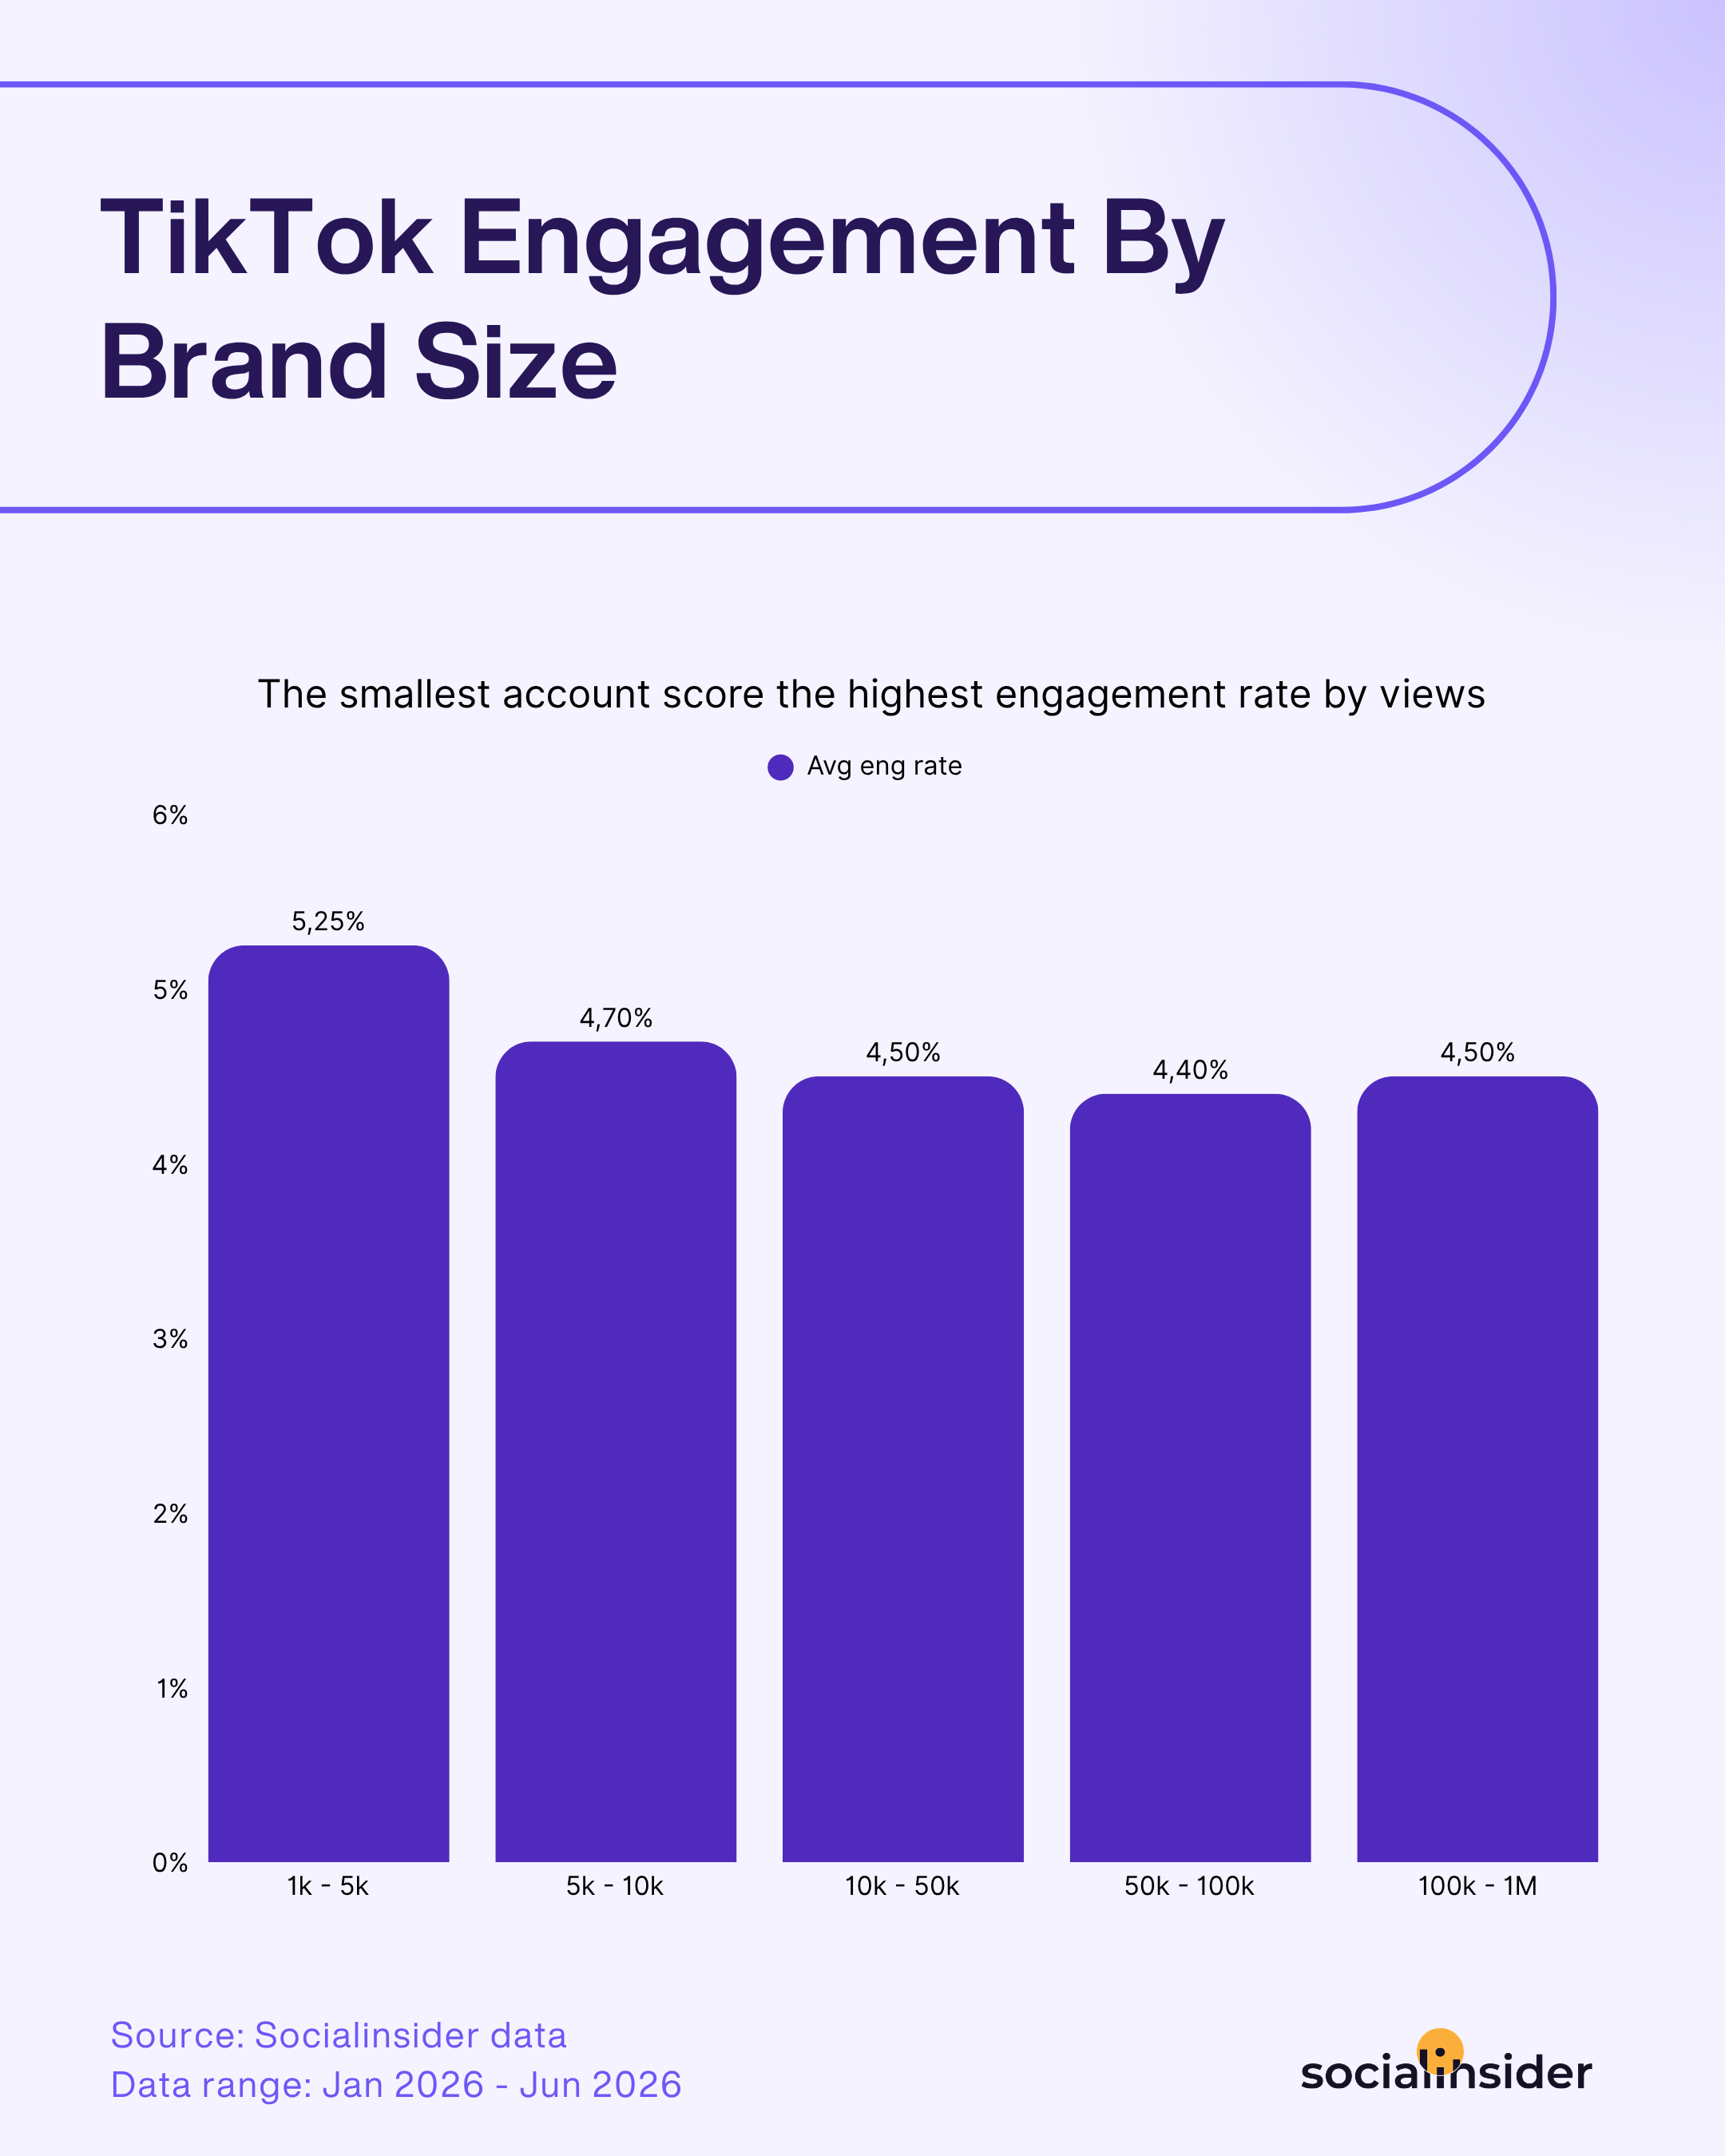
Bei TikTok sieht die Entwicklung nach Markengröße völlig anders aus als der stetige Rückgang bei Instagram oder Facebook.
Das Engagement sinkt zwar, wenn Accounts über die kleinste Größenklasse hinauswachsen, stabilisiert sich aber schnell und bleibt ab 10K Followern bemerkenswert konstant – im Bereich von 100K–1M steigt es sogar leicht wieder an. Das ist eine ganz andere Entwicklung als der klare, stetige Rückgang, den wir auf Instagram und Facebook gesehen haben. Das bestätigt etwas, das TikTok-Marketer vielleicht bereits vermutet haben: Wenn du hier deine Followerschaft vergrößerst, geht das nicht mit demselben Engagement-Nachteil einher. Dem Algorithmus ist die Größe deines Publikums weniger wichtig als die Frage, ob der Content selbst Aufmerksamkeit gewinnt. Deshalb kann ein viraler Treffer eines kleineren Accounts den durchschnittlichen Post eines deutlich größeren Accounts übertreffen.
TikTok-Video-Performance-Statistiken nach Videolänge
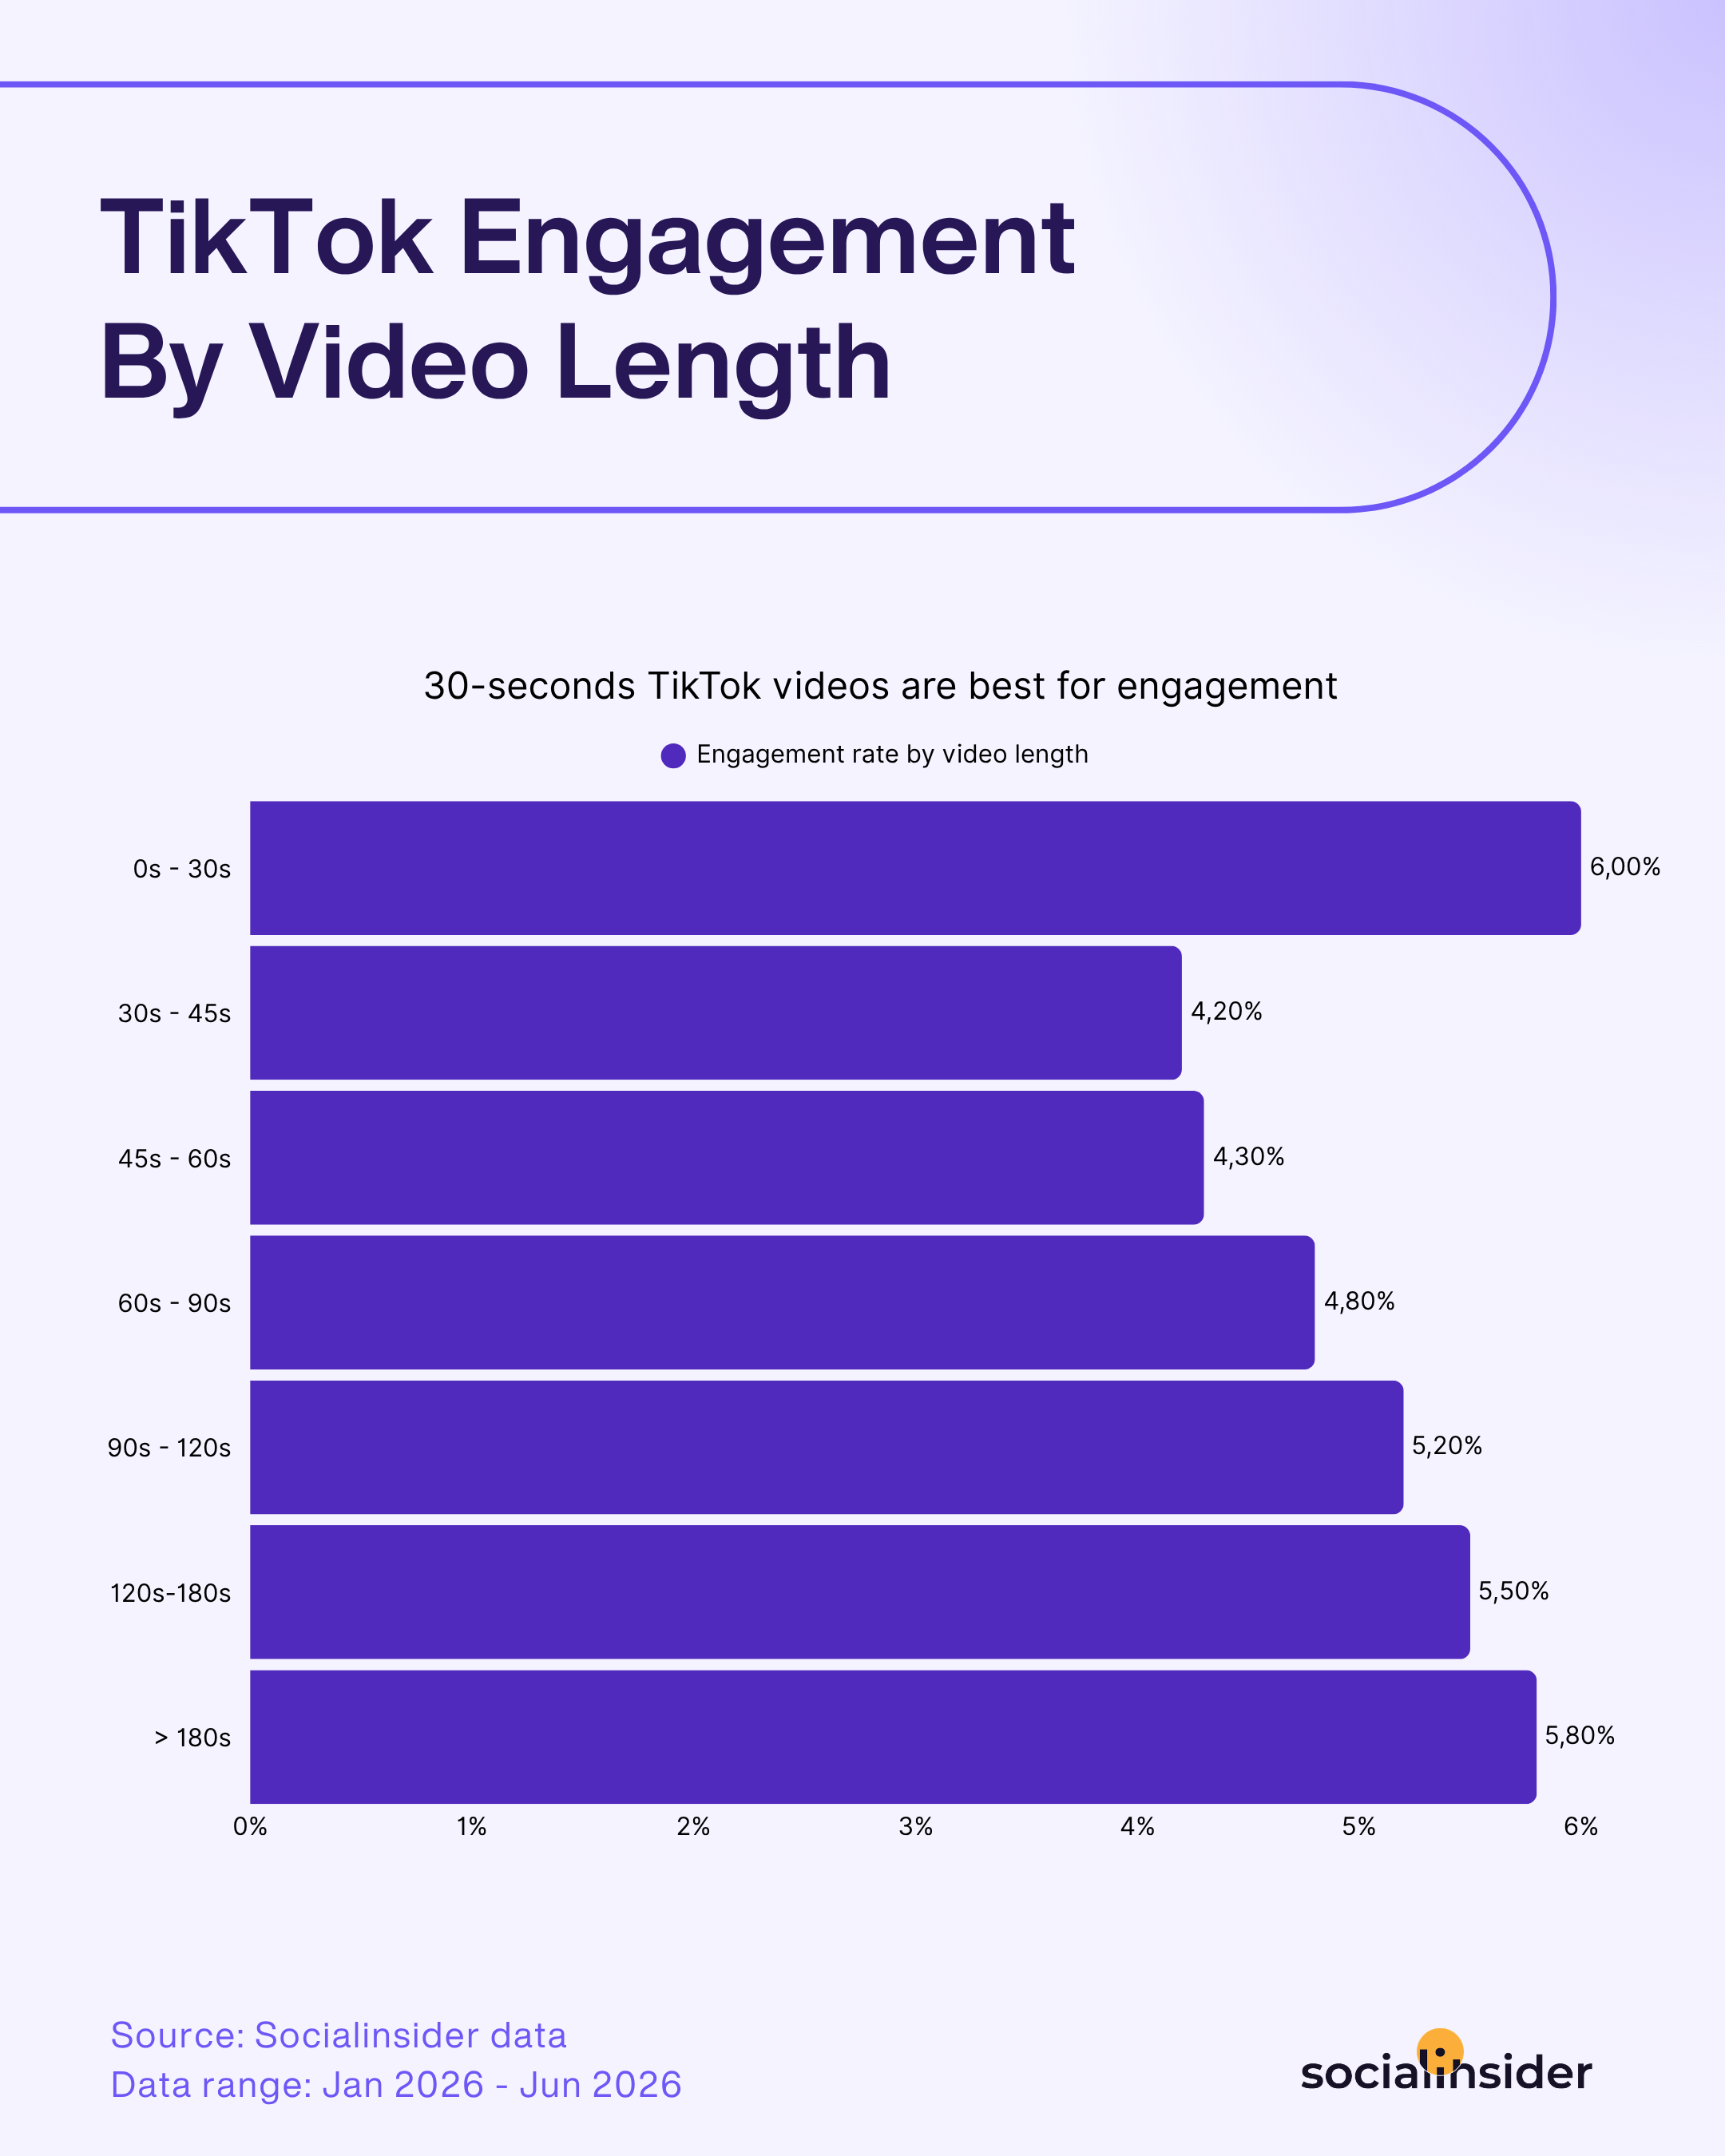
Bei der Länge wird TikTok wirklich kontraintuitiv. Genau hier stellen diese Statistiken zum Video-Marketing viele gängige Annahmen über die Plattform infrage.
Die Kurve verläuft in keine der beiden Richtungen geradlinig. Die kürzesten Videos mit weniger als 30 Sekunden erzielen die höchste Engagement-Rate aller Kategorien. Das passt zu TikToks ursprünglichem Ruf für schnelle, pointierte Inhalte. Im Bereich von 30 bis 60 Sekunden geht das Engagement jedoch deutlich zurück, bevor es kontinuierlich wieder über die Marke von 6 % steigt, sobald die Videos länger als drei Minuten sind.
Mit anderen Worten: TikTok scheint die beiden Extreme zu belohnen und den Mittelweg zu bestrafen. Ein knackiges, schnelles Video unter 30 Sekunden funktioniert. Das gilt auch für ein Video, das lang genug ist, um eine Geschichte, ein Tutorial oder eine Fallstudie über die 2- bis 3-Minuten-Marke hinaus wirklich zu entwickeln. Weniger gut funktioniert die Zwischenlänge. Sie ist zu lang, um dynamisch zu wirken, aber zu kurz, um echte Tiefe zu vermitteln. Genau in diesem Bereich landen viele Marken aus Gewohnheit.
Strategische Taktiken zur Steigerung deines TikTok-Engagements
- Richte die Länge nach dem Ziel, nicht nach dem Trend. Da hier beide Extreme funktionieren, entscheide vorher, ob ein Video ein schneller Einstieg oder eine vollständige Geschichte sein soll. Baue den Schnitt von Anfang an darauf auf, statt unentschlossen dazwischen zu landen.
- Baue ein zweigleisiges Content-System auf. Betrachte TikTok nicht als ein einziges Format. Nutze zwei parallele Content-Typen: eine rasante Serie mit weniger als 30 Sekunden für Reach und die Teilnahme an Trends sowie eine längere Serie mit 2–3 Minuten für Tiefe und Autorität. Beide erzielen auf ihre eigene Weise Engagement.
- Nutze längere Videos für Content, der die zusätzliche Zeit verdient. Sobald du die 90-Sekunden-Marke überschreitest, steigt das Engagement stetig und nimmt auch nach drei Minuten weiter zu. Diese Länge eignet sich für vollständige Tutorials, Fallstudien oder Produktverwandlungen – für Content, dessen Ergebnis wirklich Zeit braucht, um sich zu entwickeln.
LinkedIn-Video-Engagement-Statistiken
TikTok belohnt Extreme, aber LinkedIn folgt ganz anderen Regeln. Hier geht Wachstum nicht mit dem starken Nachteil einher, den du auf Instagram und Facebook siehst. Die Video-Engagement-Statistiken bleiben im Vergleich geradezu stabil.
LinkedIn-Video-Performance-Statistiken nach Markengröße
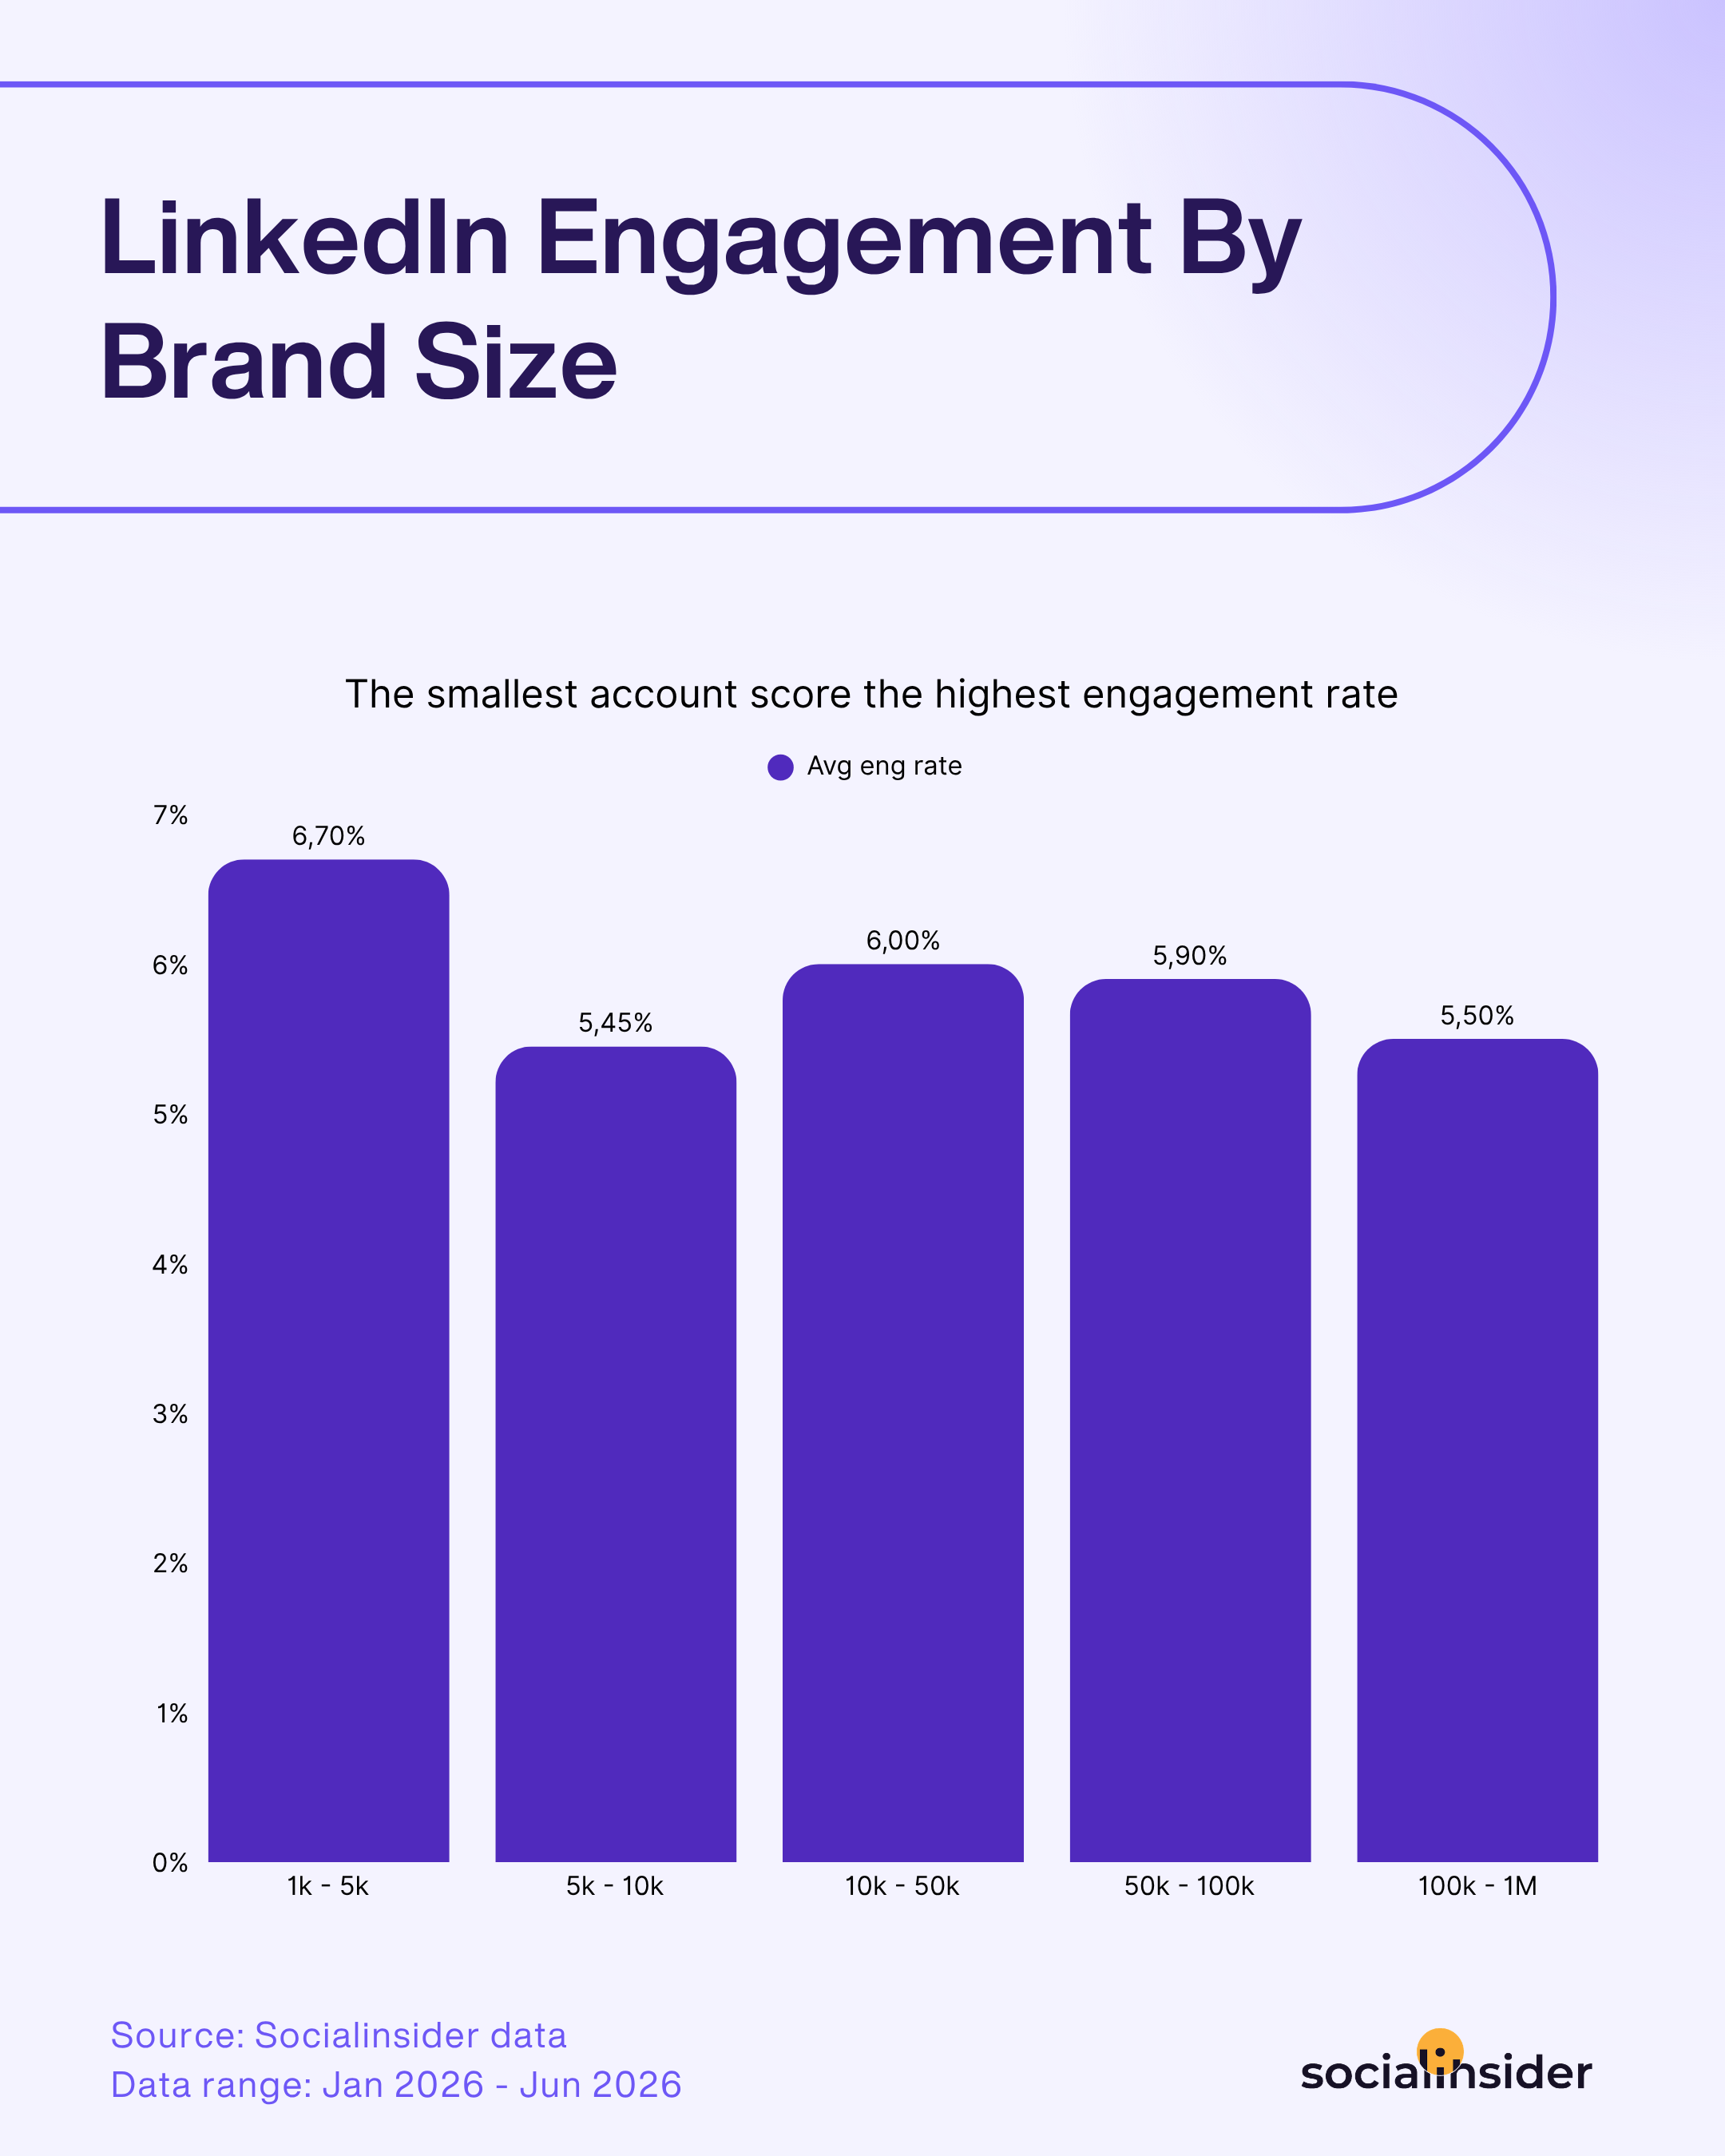
Während Instagram und Facebook bei wachsender Account-Größe einen klaren Rückgang zeigen, ist die Kurve bei LinkedIn deutlich flacher – und auf eine gute Art weniger vorhersehbar.
Der Rückgang bei 5K–10K sticht als einzige Schwachstelle hervor, bevor sich das Engagement in den Bereichen 10K–50K und 50K–100K erholt und erst beim Wechsel von Accounts in die Kategorie 100K–1M leicht abnimmt. Selbst in dieser obersten Kategorie bleibt das Engagement nahe an dem Niveau kleinerer Accounts – weit entfernt von dem Einbruch um etwa 50 %, den wir auf Instagram gesehen haben. Dieses Muster zeigt, wie sich LinkedIn-Zielgruppen tatsächlich verhalten: Hier scrollen die Menschen nicht zur Unterhaltung, sondern auf der Suche nach Mehrwert. Eine größere Followerschaft schwächt das Engagement nicht so stark ab wie anderswo.
LinkedIn-Video-Performance-Statistiken nach Videolänge
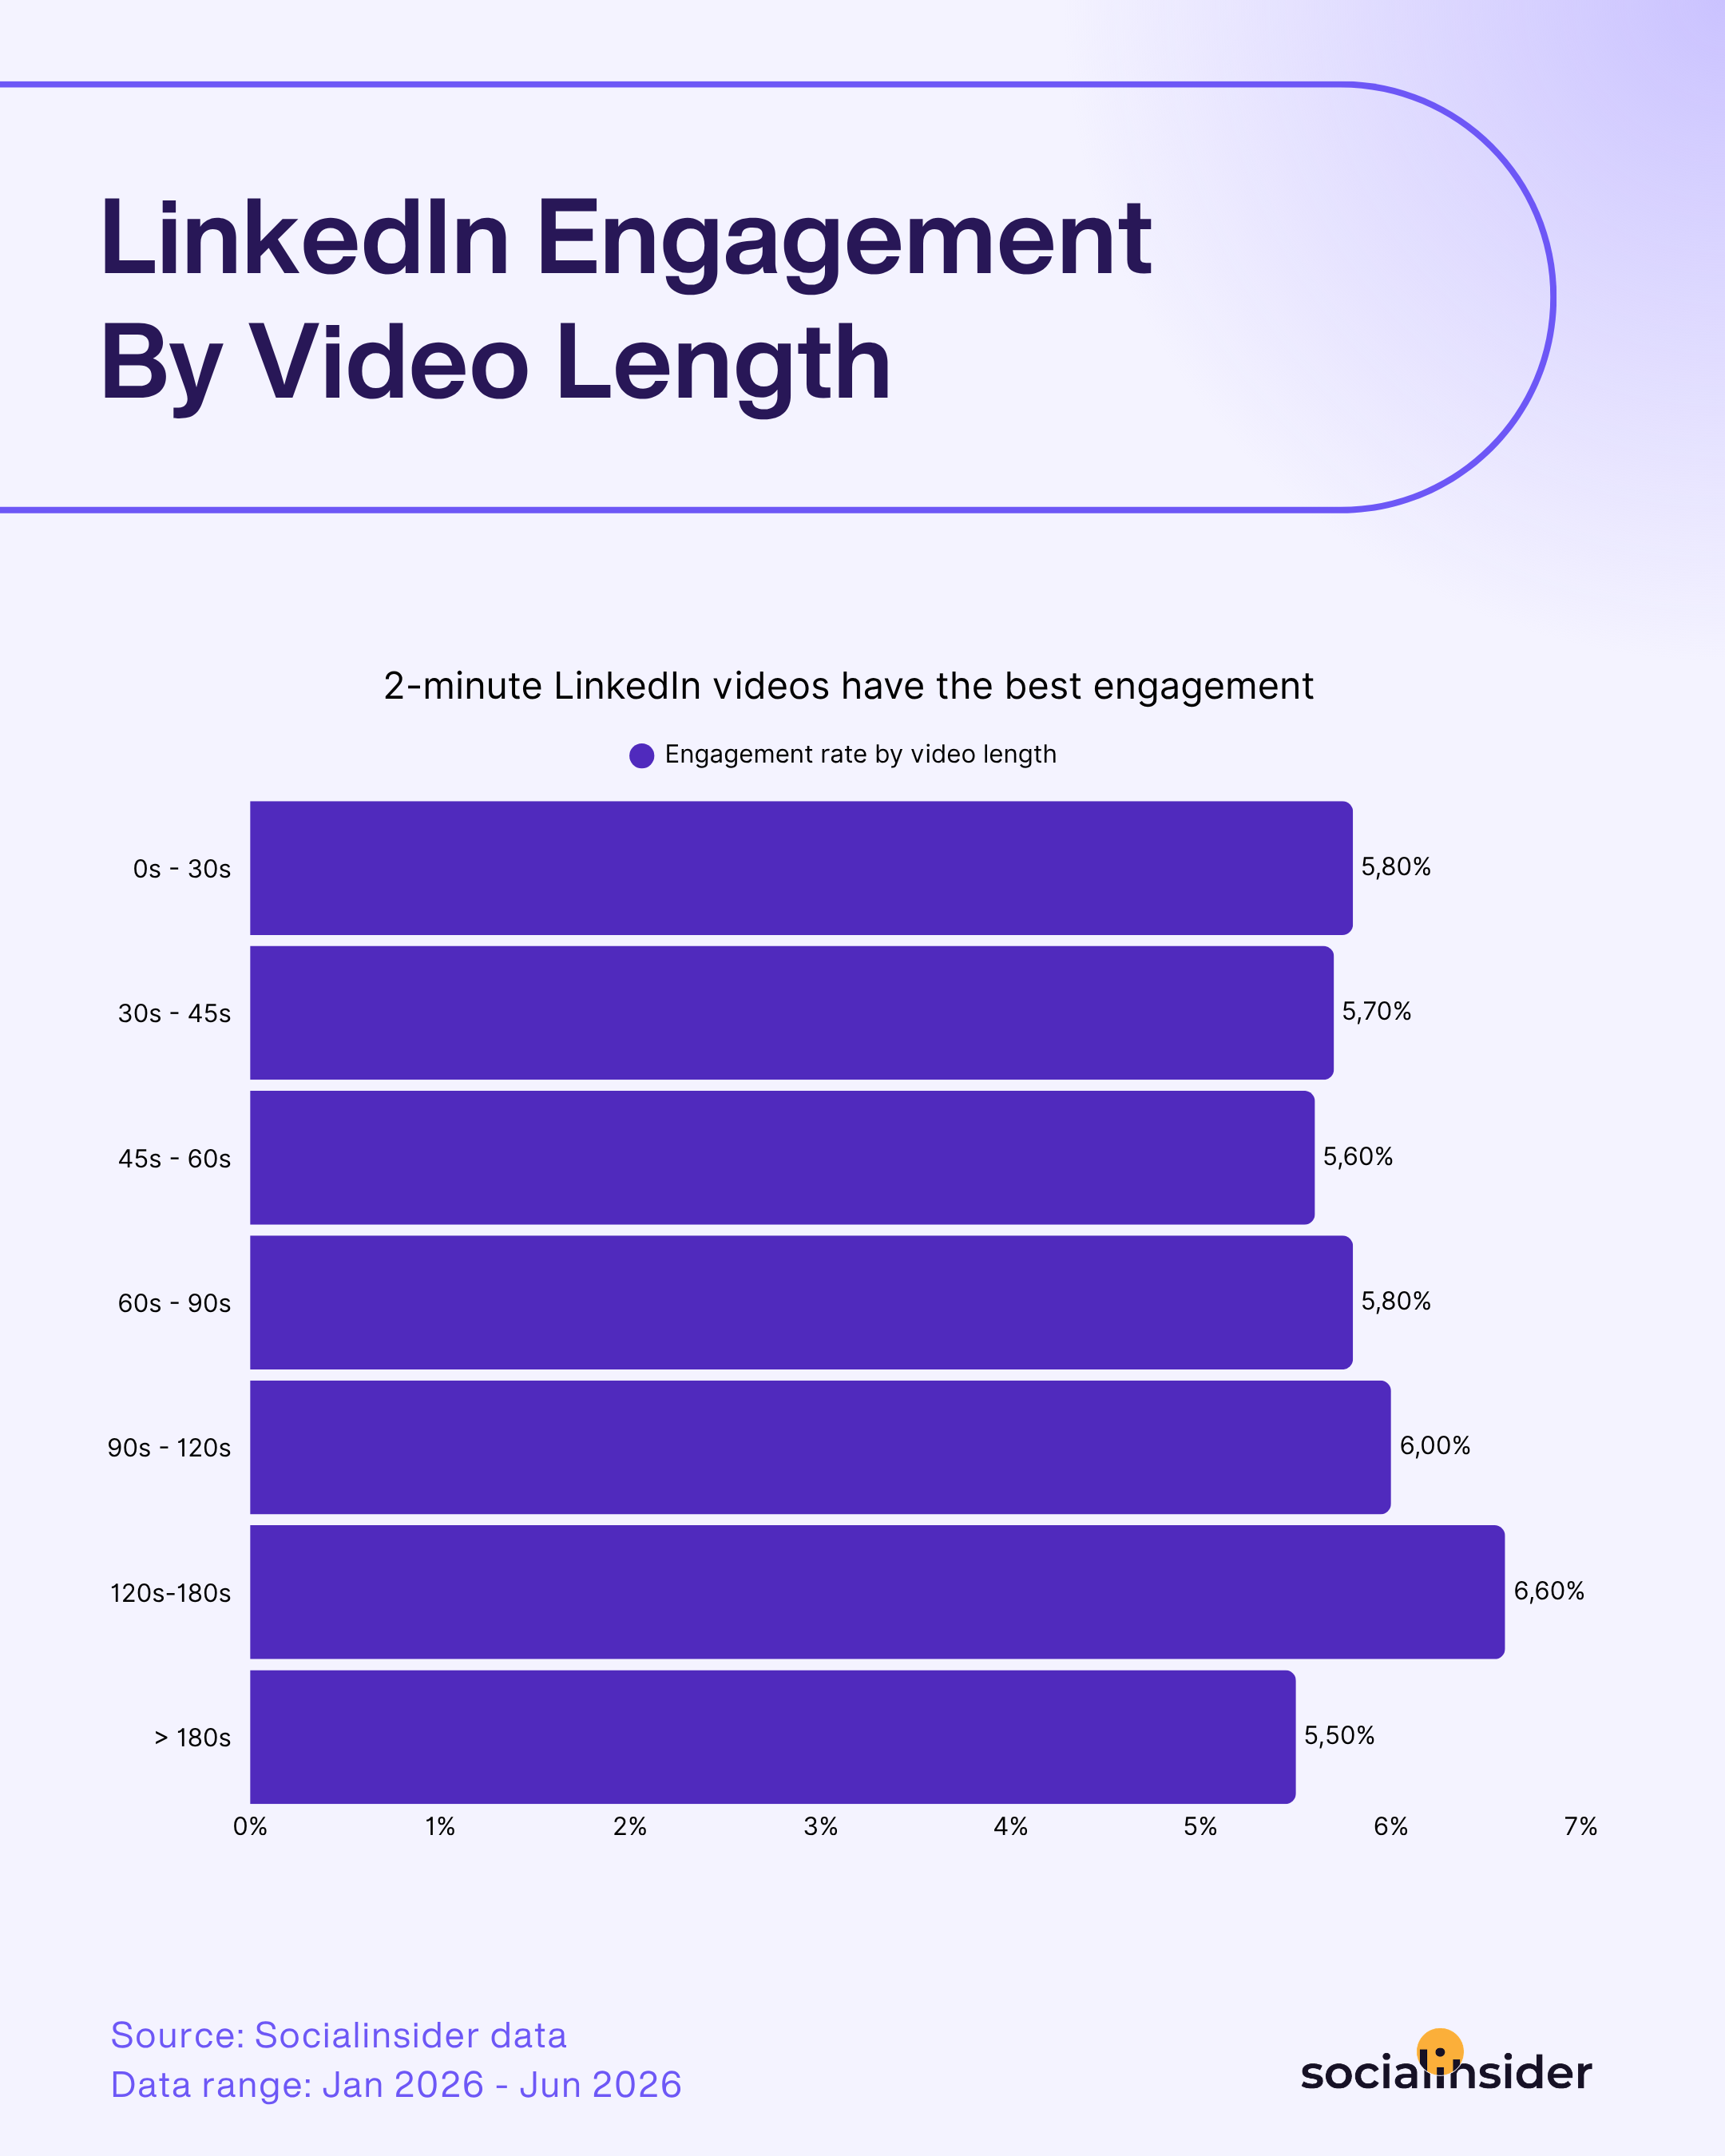
Die Länge verleiht dieser Stabilität eine weitere Ebene, und hier beginnen die Video-Content-Statistiken von LinkedIn ein wenig wie die von Facebook auszusehen, längere Inhalte werden bis zu einem bestimmten Punkt belohnt.
Das Engagement bleibt bei kürzeren Videos relativ konstant und bewegt sich um die mittleren 5 %, unabhängig davon, ob ein Video 30 Sekunden oder 90 Sekunden dauert. Entscheidend ist jedoch, was danach passiert: Das Engagement erreicht im Zeitraum von 120–180 Sekunden seinen klaren Höchststand, bevor es wieder sinkt, sobald Videos die Drei-Minuten-Marke überschreiten. Damit sind 2–3 Minuten der Sweet Spot auf LinkedIn: lang genug für einen vollständigen Gedanken, aber kurz genug, um die Geduld eines Publikums nicht zu strapazieren, das hier hauptsächlich zwischen Meetings einen Feed überfliegt.
Das Fazit ist klar: LinkedIn toleriert kürzere Videos, ohne sie abzustrafen, belohnt Videos, die den Zeitraum von 2–3 Minuten gut nutzen, und das Engagement beginnt zu sinken, sobald du um mehr als drei Minuten Aufmerksamkeit bittest.
Strategische Maßnahmen, um dein LinkedIn-Video-Engagement zu steigern
- Peile das Zeitfenster von 2–3 Minuten an, wenn du wirklich Substanz zu teilen hast. Hier erreicht das Engagement seinen Höhepunkt. Diese Dauer reicht aus, um einen vollständigen Gedanken, einen Insight oder eine Case Study zu entwickeln, ohne dein Publikum zu verlieren, wie es bei mehr als drei Minuten häufig passiert.
- Du musst kürzere Videos nicht künstlich verlängern. Alles zwischen 30 Sekunden und eineinhalb Minuten erzielt konstant gute Ergebnisse. Wenn deine Idee nach 45 Sekunden wirklich vollständig ist, musst du sie nicht nur für die vermeintlich „bessere“ Kategorie verlängern. Beständigkeit ist wichtiger als eine exakt vorgegebene Laufzeit.
- Konzentriere dich auf lehrreichen statt auf werblichen Content. Zuschauer bleiben selten stehen, um sich ein Werbevideo eines Unternehmens anzusehen. Was Aufmerksamkeit erregt, ist Content, der etwas Konkretes vermittelt, denn wenn der Fokus darauf liegt, zu helfen statt etwas anzupreisen, sehen sich Menschen das Video länger an und vertrauen der Marke mehr.
Statistiken zu Social Media Video Views
Engagement zeigt dir, wem etwas wichtig ist, aber Views zeigen dir, wer überhaupt zusieht, und das ist eine andere Frage mit eigenen Antworten. Die Video-Content-Statistiken hinter reach entwickeln sich nicht immer in dieselbe Richtung wie die Video-Content-Marketing-Statistiken hinter Engagement, und genau deshalb lohnt es sich, beide getrennt zu betrachten.
Performance-Statistiken zu Instagram Reels Views
Instagram ist ein guter Ausgangspunkt, da wir bereits gesehen haben, wie Markengröße und Videolänge das Engagement hier beeinflussen. Sehen wir uns nun an, ob die Views demselben Muster folgen oder eine ganz andere Geschichte erzählen.
Performance-Statistiken zu Instagram Reels Views nach Markengröße
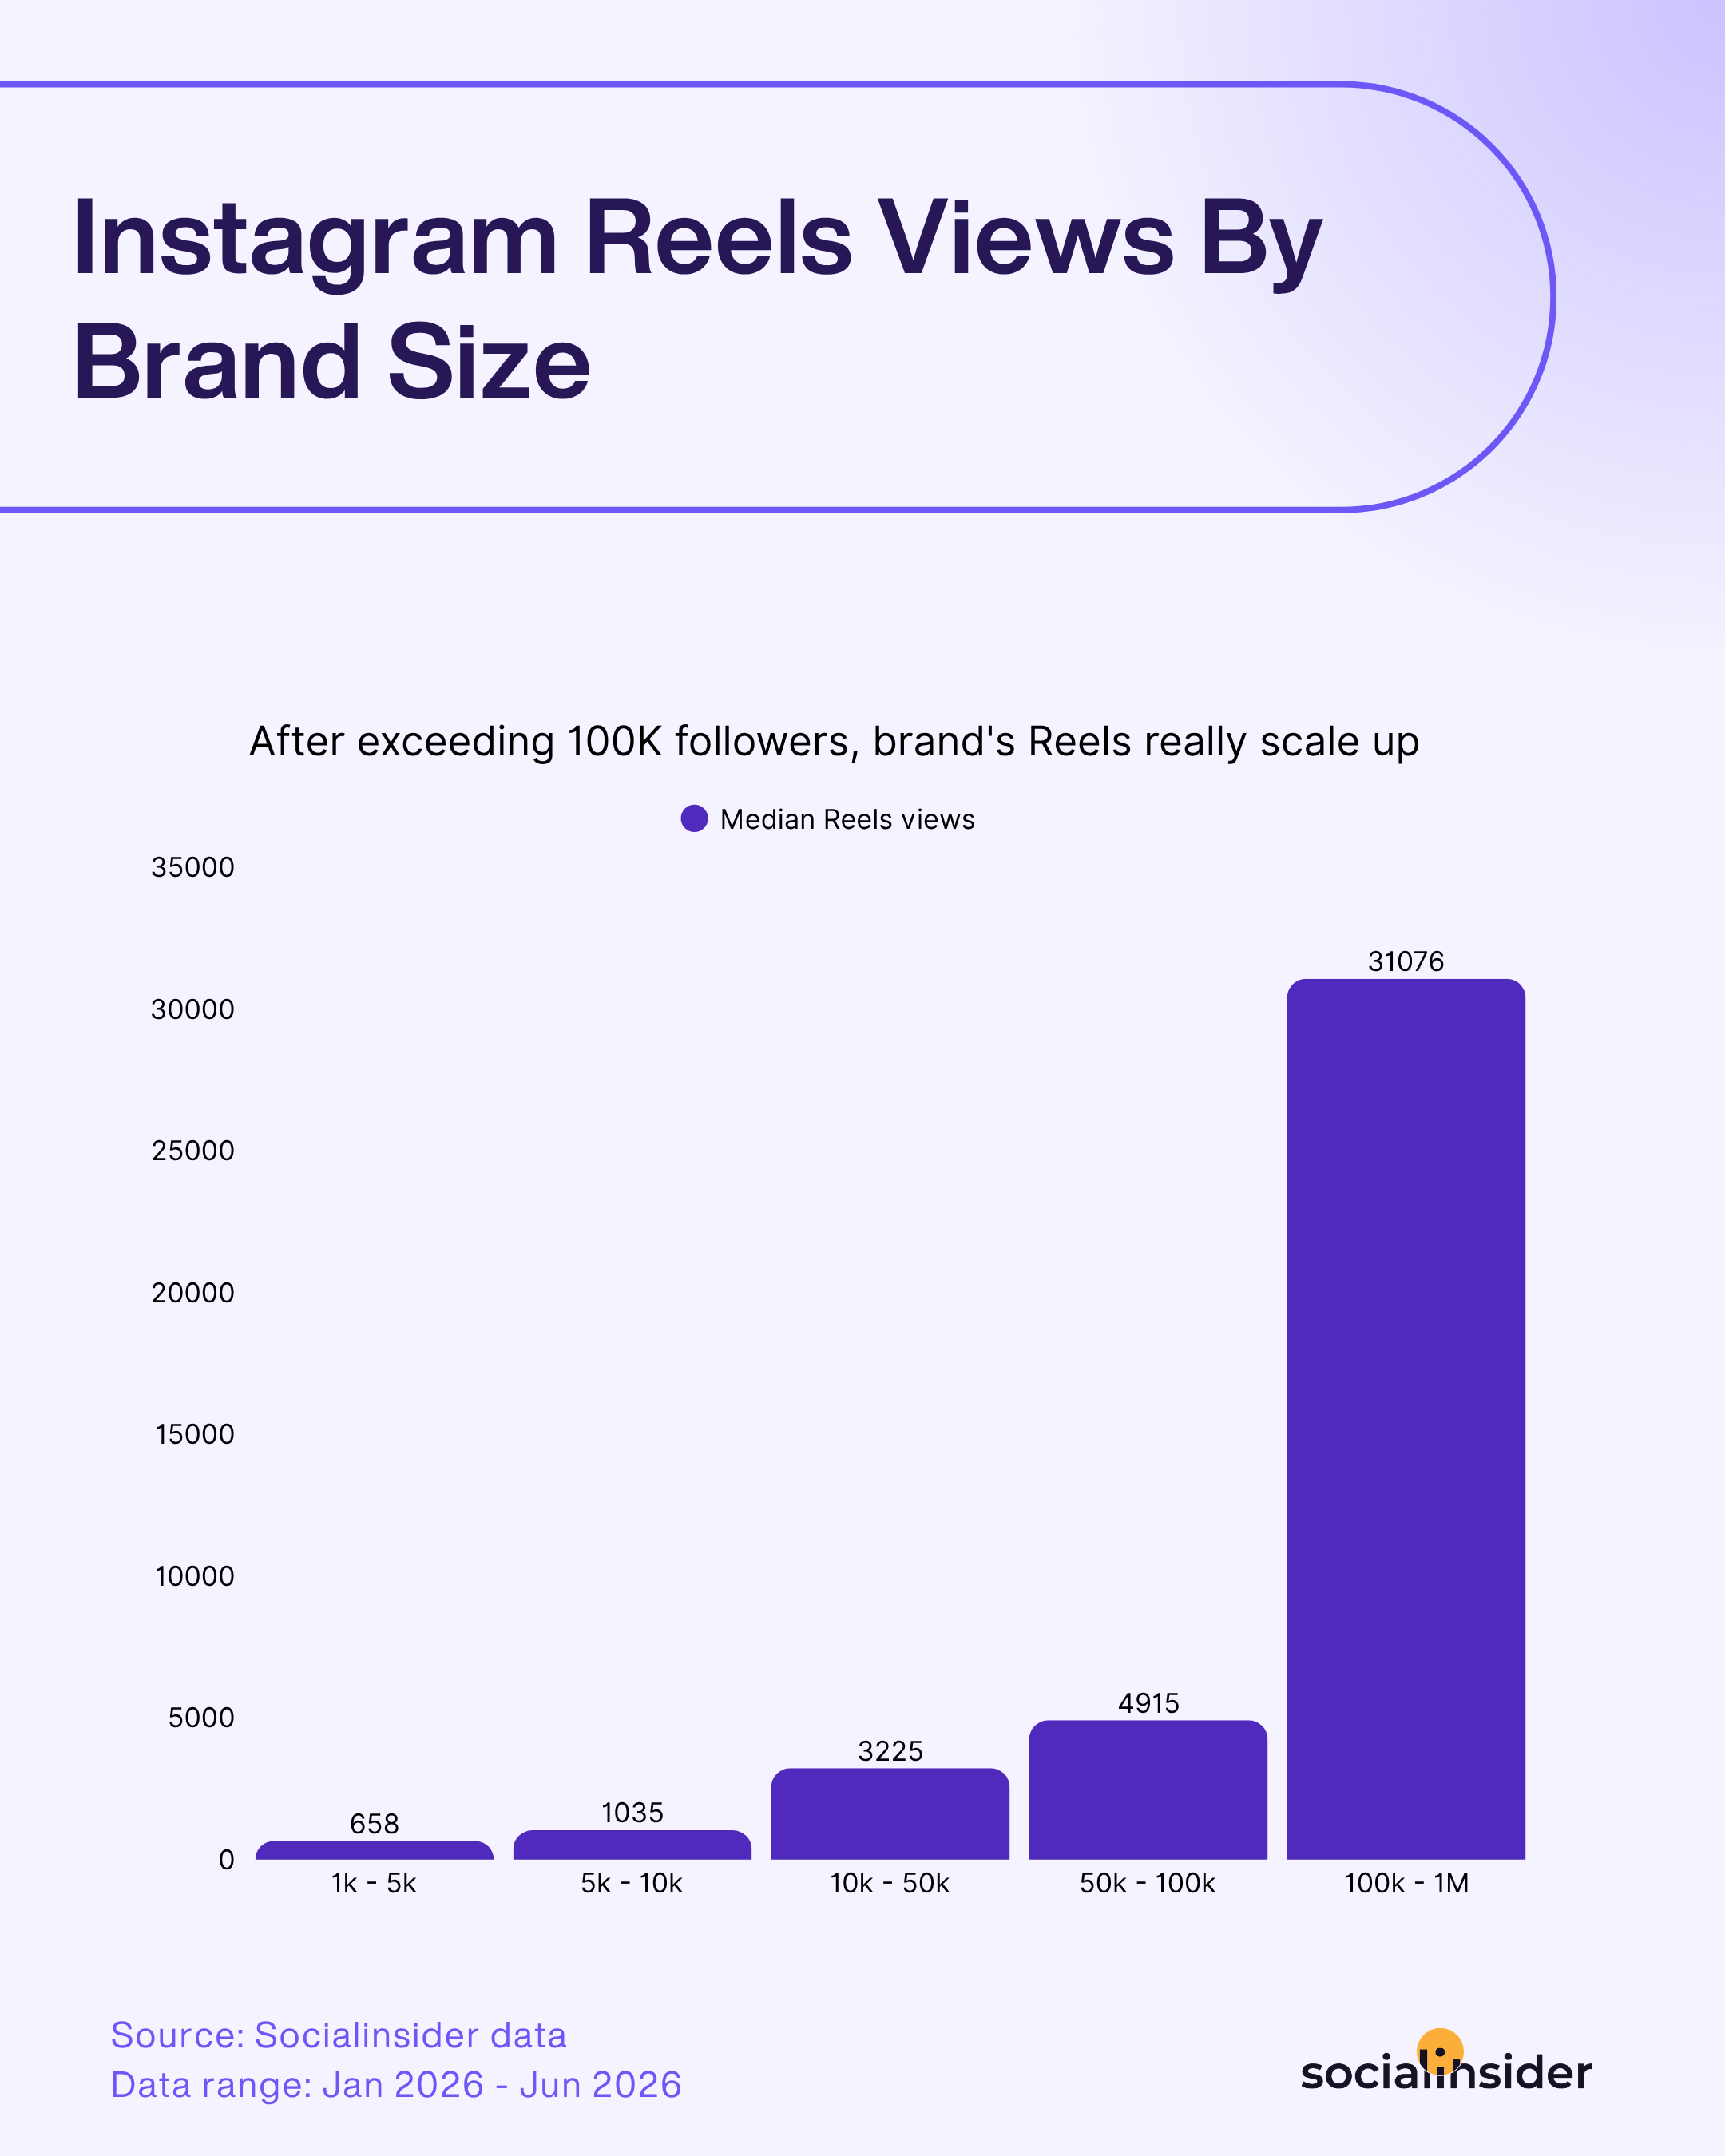
Im Gegensatz zum Engagement erzählen Views, die mit wachsender Kontogröße abnehmen, fast die umgekehrte Geschichte. Der Anstieg verläuft in den mittleren Größenklassen gleichmäßig und verdreifacht sich ungefähr von den kleinsten Marken bis zum Bereich von 50K–100K. Der eigentliche Sprung erfolgt jedoch, sobald ein Konto den Bereich von 100K–1M erreicht. Dort steigen die durchschnittlichen Views auf mehr als das Sechsfache des Werts, den Konten in der direkt darunterliegenden Größenklasse erzielen. Das ist eine deutlich stärkere Beschleunigung, als sie beim Engagement jemals zu beobachten ist. Und es weist auf etwas Wichtiges hin: Reach und Engagement sind nicht dieselbe Belohnung. Bei einem größeren Konto kann die Engagement-Rate zwar abkühlen. Gleichzeitig profitiert es von einem deutlich größeren Verbreitungsvorteil, sobald der Algorithmus genug Vertrauen fasst, um den Content weiter auszuspielen. Views skalieren mit der Größe. Das tut Engagement einfach nicht.
Performance-Statistiken zu Instagram Reels Views nach Videolänge
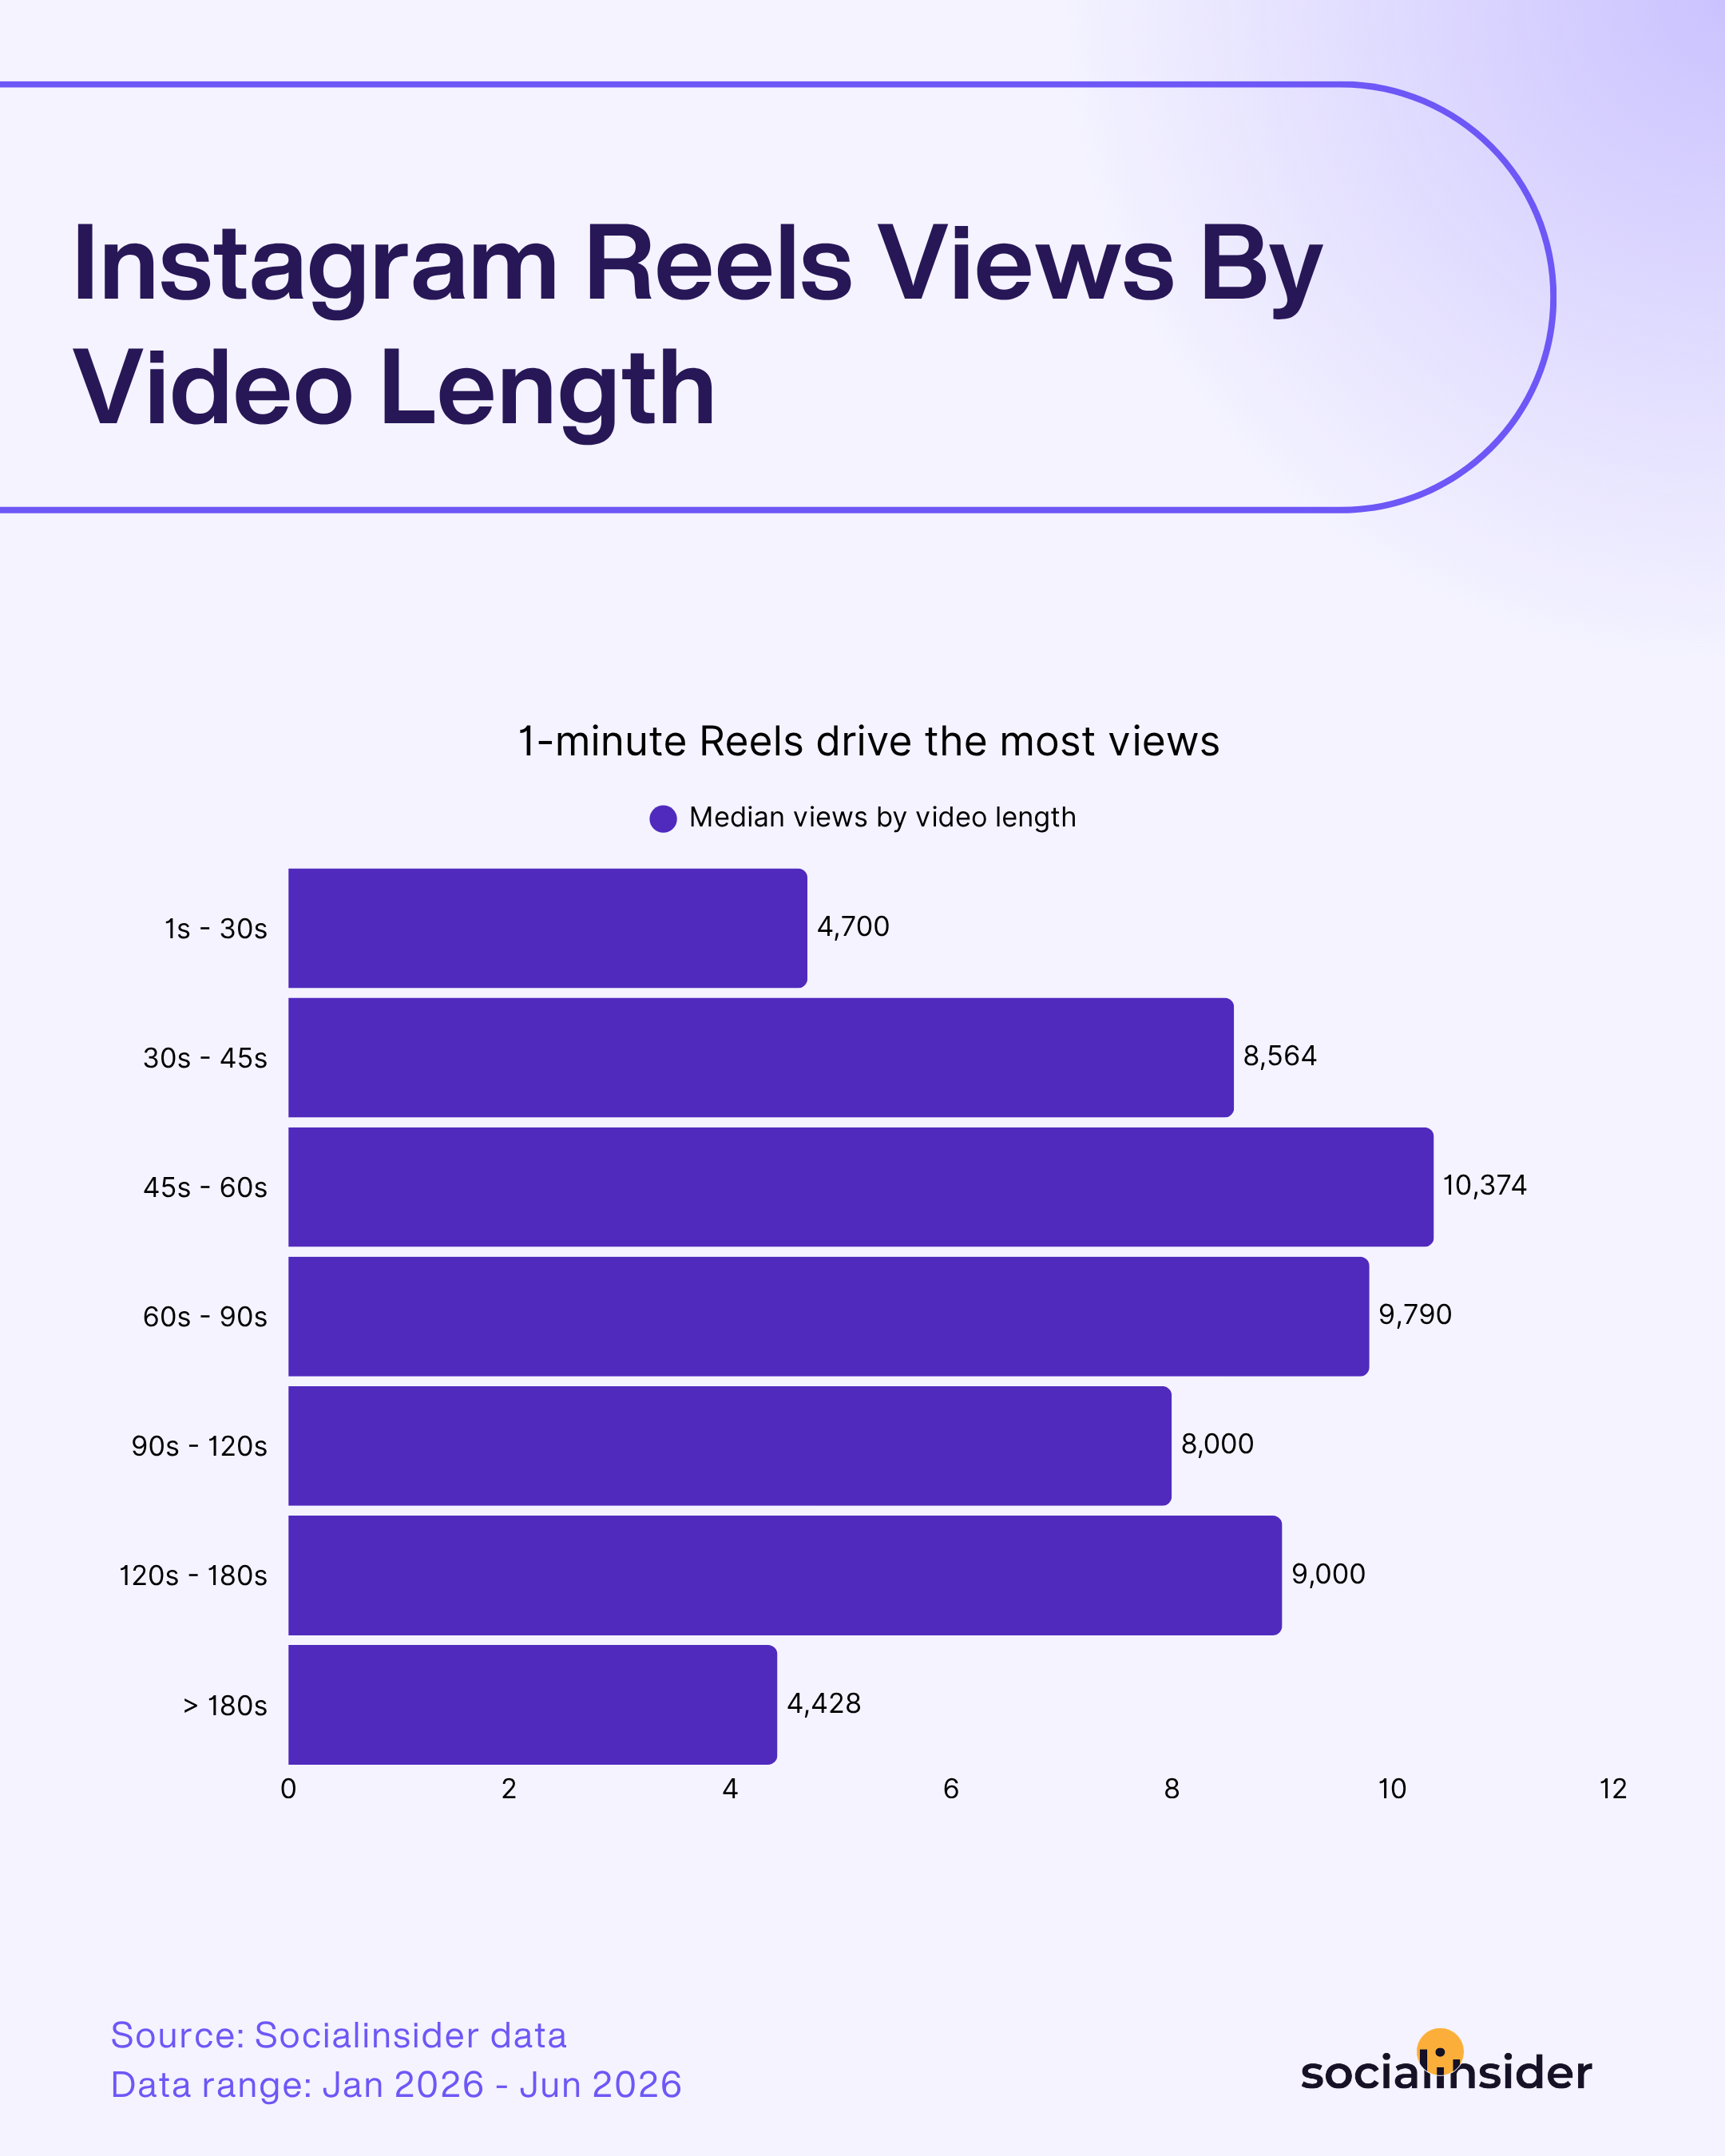
Das Muster hier entspricht weitgehend dem, was wir beim Engagement gesehen haben. Views steigen im kürzesten Zeitbereich schnell an und erreichen im Bereich von 45-60 Sekunden ihren Höchststand. Danach gehen sie im Bereich von 60-120 Sekunden leicht zurück, bevor sie im Zeitfenster von 120-180 Sekunden wieder ansteigen. Dann folgt dieselbe klare Obergrenze wie beim Engagement: Nach drei Minuten fallen die Views auf weniger als die Hälfte ihres Höchststands und liegen damit sogar unter den Werten der kürzesten Videos mit weniger als 30 Sekunden.
Das Muster bestätigt die frühere Erkenntnis: Zuschauer bleiben bei einem gut gemachten 45–60-Sekunden-Video oder einem ausführlicheren 2–3-Minuten-Video gern dabei. Sobald ein Reel die Drei-Minuten-Marke überschreitet, nimmt die Geduld jedoch deutlich ab. Wenn du entscheidest, ob du ein Video kürzt oder länger laufen lässt, zeigen diese Daten, dass eine Länge von mehr als 180 Sekunden kaum Vorteile bietet.
Strategische Taktiken, um deine Instagram Reels Views zu steigern
- Gestalte dein Vorschaubild so, dass es Aufmerksamkeit erregt und nicht nur markenkonform aussieht. Wähle ein auffälliges Bild mit hohem Kontrast und dem Gesicht einer echten Person – idealerweise mit direktem Blickkontakt. Kombiniere es mit einem kurzen, emotionalen Hook. Diese Cover stoppen das Scrollen und verschaffen deinem Video ab der ersten Sekunde bessere Chancen auf Engagement.
- Schneide deine Videos so, dass sie nahtlos ineinander übergehen. Hast du schon einmal ein Reel erneut gestartet, weil das Ende direkt wieder in den Anfang überging? Dieser Loop hält die Zuschauer länger bei der Stange. Mehr Watch Time erhöht die Wahrscheinlichkeit deutlich, dass der Algorithmus dein Video weiter ausspielt.
- Halte die Zuschauer mit dem Tempo bei der Stange, nicht mit der Länge. Ein Clip mit gutem Tempo kann unabhängig von seiner Laufzeit Aufmerksamkeit fesseln. Schneide Leerlauf heraus, halte die Energie hoch und ergänze Text, wechselnde Audioelemente oder schnelle Übergänge, die signalisieren, dass noch mehr kommt.
Facebook Reels Views Performance-Statistiken
Facebook Reels verzeichneten einen deutlich stärkeren Engagement-Rückgang als Instagram. Bei den Views haben die beiden Plattformen jedoch einiges gemeinsam: Größere Marken erzielen deutlich mehr Reach – nur auf Facebooks eigener Skala.
Facebook Reels Views Performance-Statistiken nach Markengröße
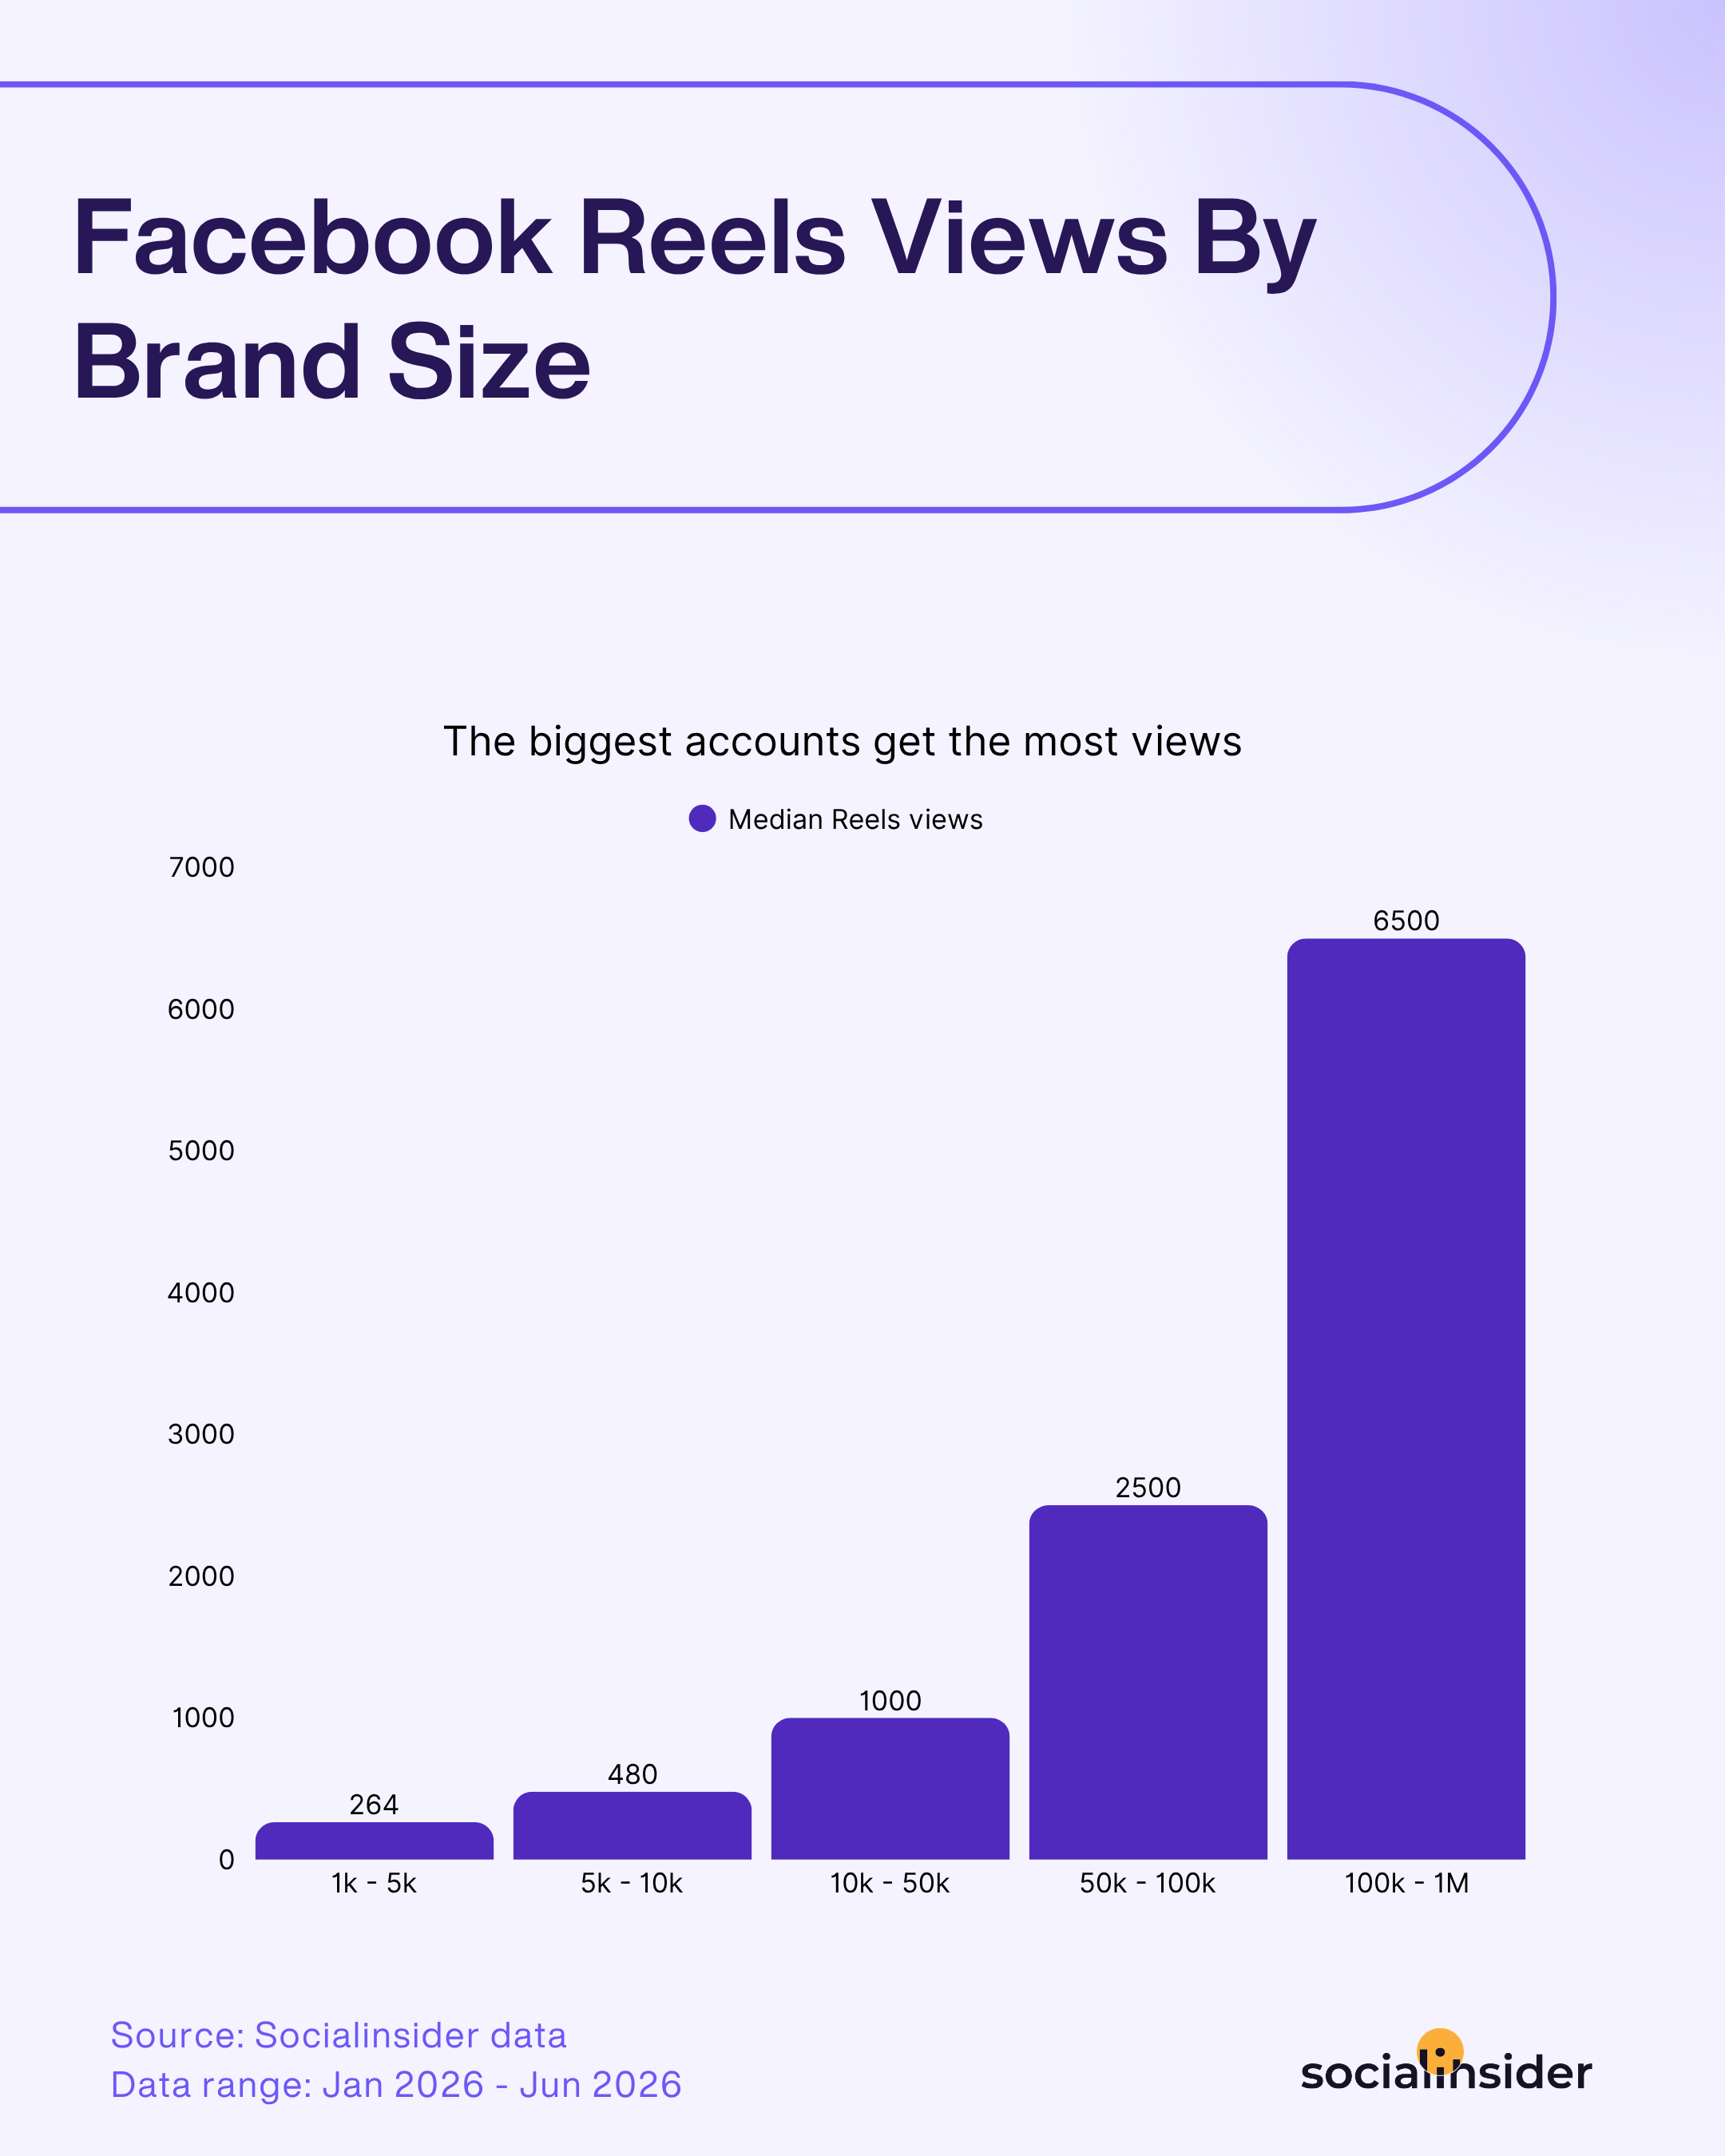
Das Wachstum ist hier stetig und konstant, ohne die plötzliche Beschleunigung, die Instagram am oberen Ende zeigt. Die Views verdoppeln sich in jeder Größenklasse ungefähr – von 264 bei den kleinsten Marken bis zu 6.500 bei den größten. Das ergibt einen klaren, kumulativen Anstieg statt eines einzigen dramatischen Sprungs. Diese Entwicklung unterscheidet sich deutlich von Instagram. Dort zeigte sich der eigentliche Anstieg erst, als Marken den Bereich mit sechsstelliger Followers-Zahl erreichten. Auf Facebook zahlt sich Wachstum in jeder Phase vorhersehbarer aus. Marken müssen also keine bestimmte Größe erreichen, bevor sich der reach zu ihren Gunsten entwickelt.
Performance-Statistiken der Facebook Reels Views nach Videolänge
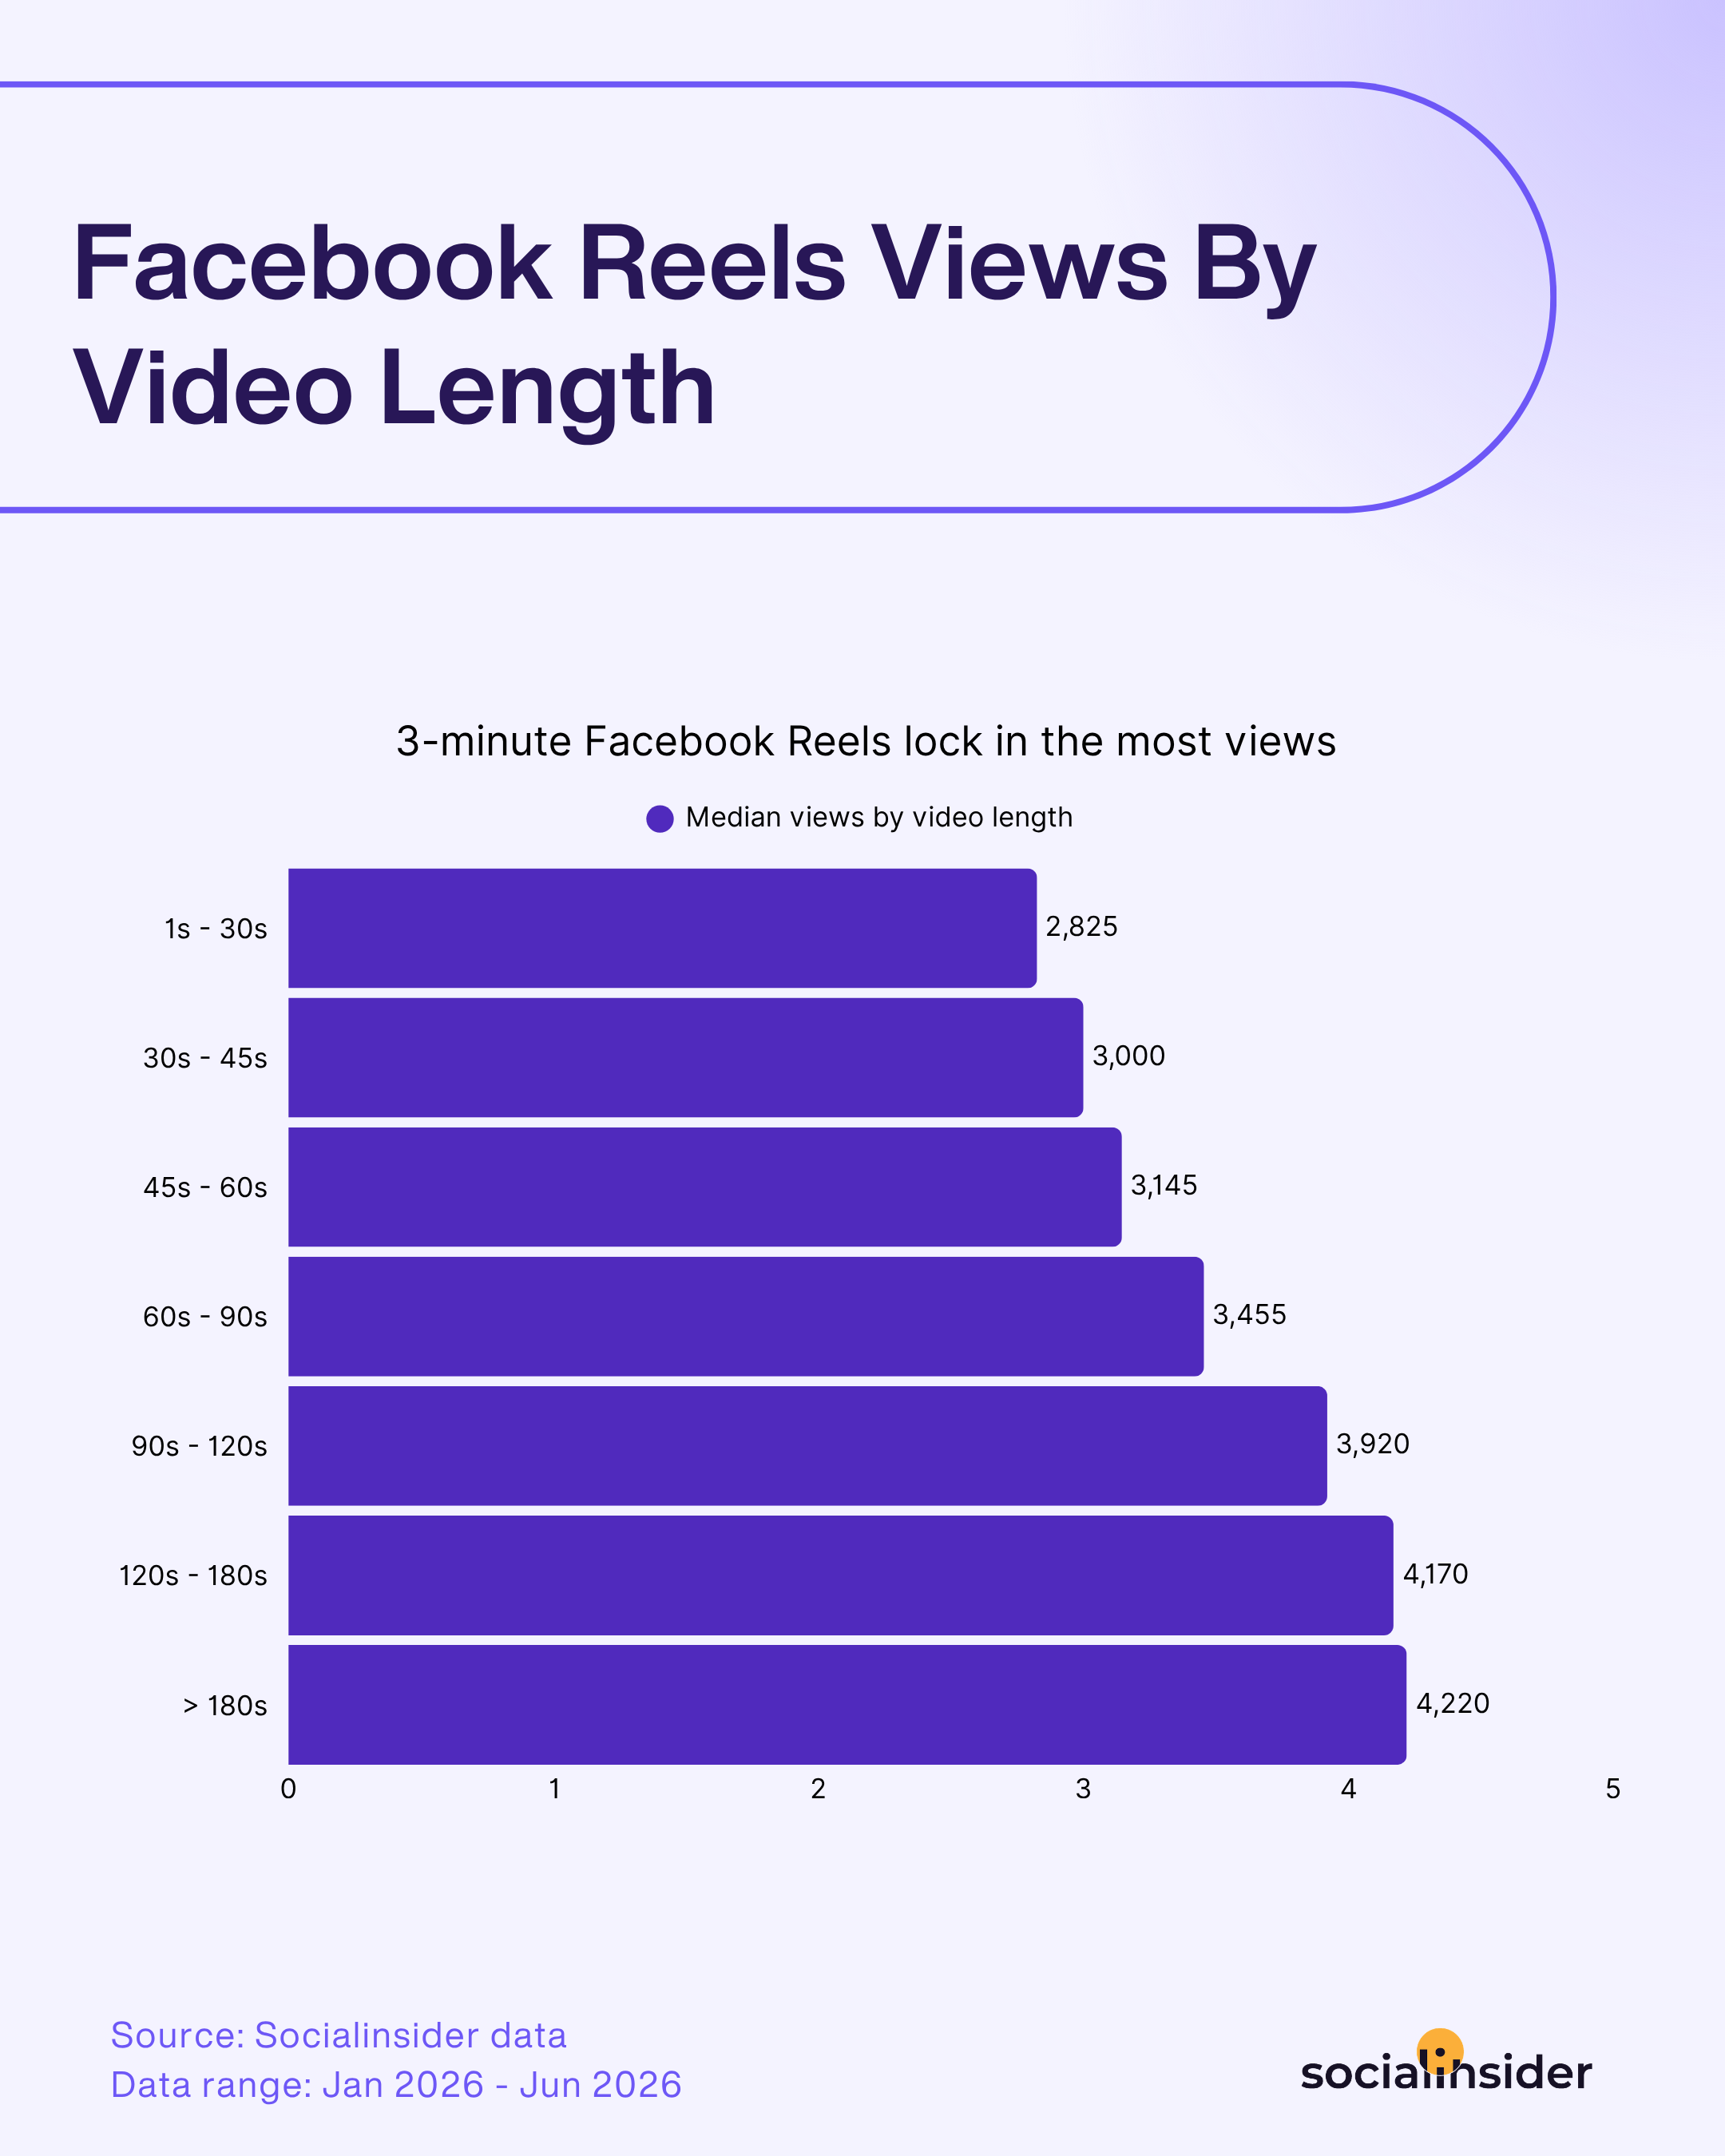
Anders als bei Instagram gibt es hier weder einen Einbruch noch einen Absturz, die Views steigen von den kürzesten Videos bis hin zur längsten Kategorie stetig und konstant an und erreichen bei Videos von über drei Minuten ihren Höchststand. Das entspricht dem gleichen Muster, das wir beim Engagement von Facebook Reels gesehen haben: Die Länge spielt fast durchgehend zu deinen Gunsten, ohne wirklichen Nachteil bei längeren Videos.
Diese Konstanz ist strategisch wichtig. Auf Instagram kostet dich zusätzliche Länge ab einem gewissen Punkt aktiv Views. Auf Facebook deuten die Daten auf das Gegenteil hin: Ein längeres, gut gemachtes Reel wird beim Reach allein sehr wahrscheinlich nicht schlechter abschneiden als ein kürzeres und könnte es sogar übertreffen.
Strategische Insights dazu, wie du deine Views auf Facebook Reels steigern kannst
- Setze selbstbewusst auf längere Videos. Views steigen konstant über die Drei-Minuten-Marke hinaus, ohne den Einbruch oder die Obergrenze, die Instagram zeigt. Wenn du eine längere Geschichte zu erzählen hast, ist Facebook die nachsichtigere Plattform dafür.
- Nutze die zusätzliche Länge für vollständige Geschichten, statt einfach nur dasselbe Tempo beizubehalten. Da längere Videos hier keine Views kosten, kannst du die zusätzliche Zeit für mehr Kontext, einen umfassenderen Spannungsbogen oder eine vollständigere Erklärung nutzen, statt eine Kurzvideo-Idee einfach in die Länge zu ziehen.
- Nutze längere Reels für Retention-Tests. Da die Länge hier kein Nachteil ist wie andernorts, kannst du mit diesem Format tiefere Geschichten, ausführlichere Bildungsinhalte oder ein Serienformat testen und herausfinden, auf welche längeren Formate deine Zielgruppe am besten reagiert.
Performance-Statistiken zu TikTok Views
TikToks Engagement-Daten durchbrachen das übliche Muster „größeres Konto, niedrigere Rate“, und auch bei den Views zeigt sich ein eigenes Muster, diesmal zugunsten der Größe und sogar sehr deutlich.
Performance-Statistiken zu TikTok Video Views nach Markengröße
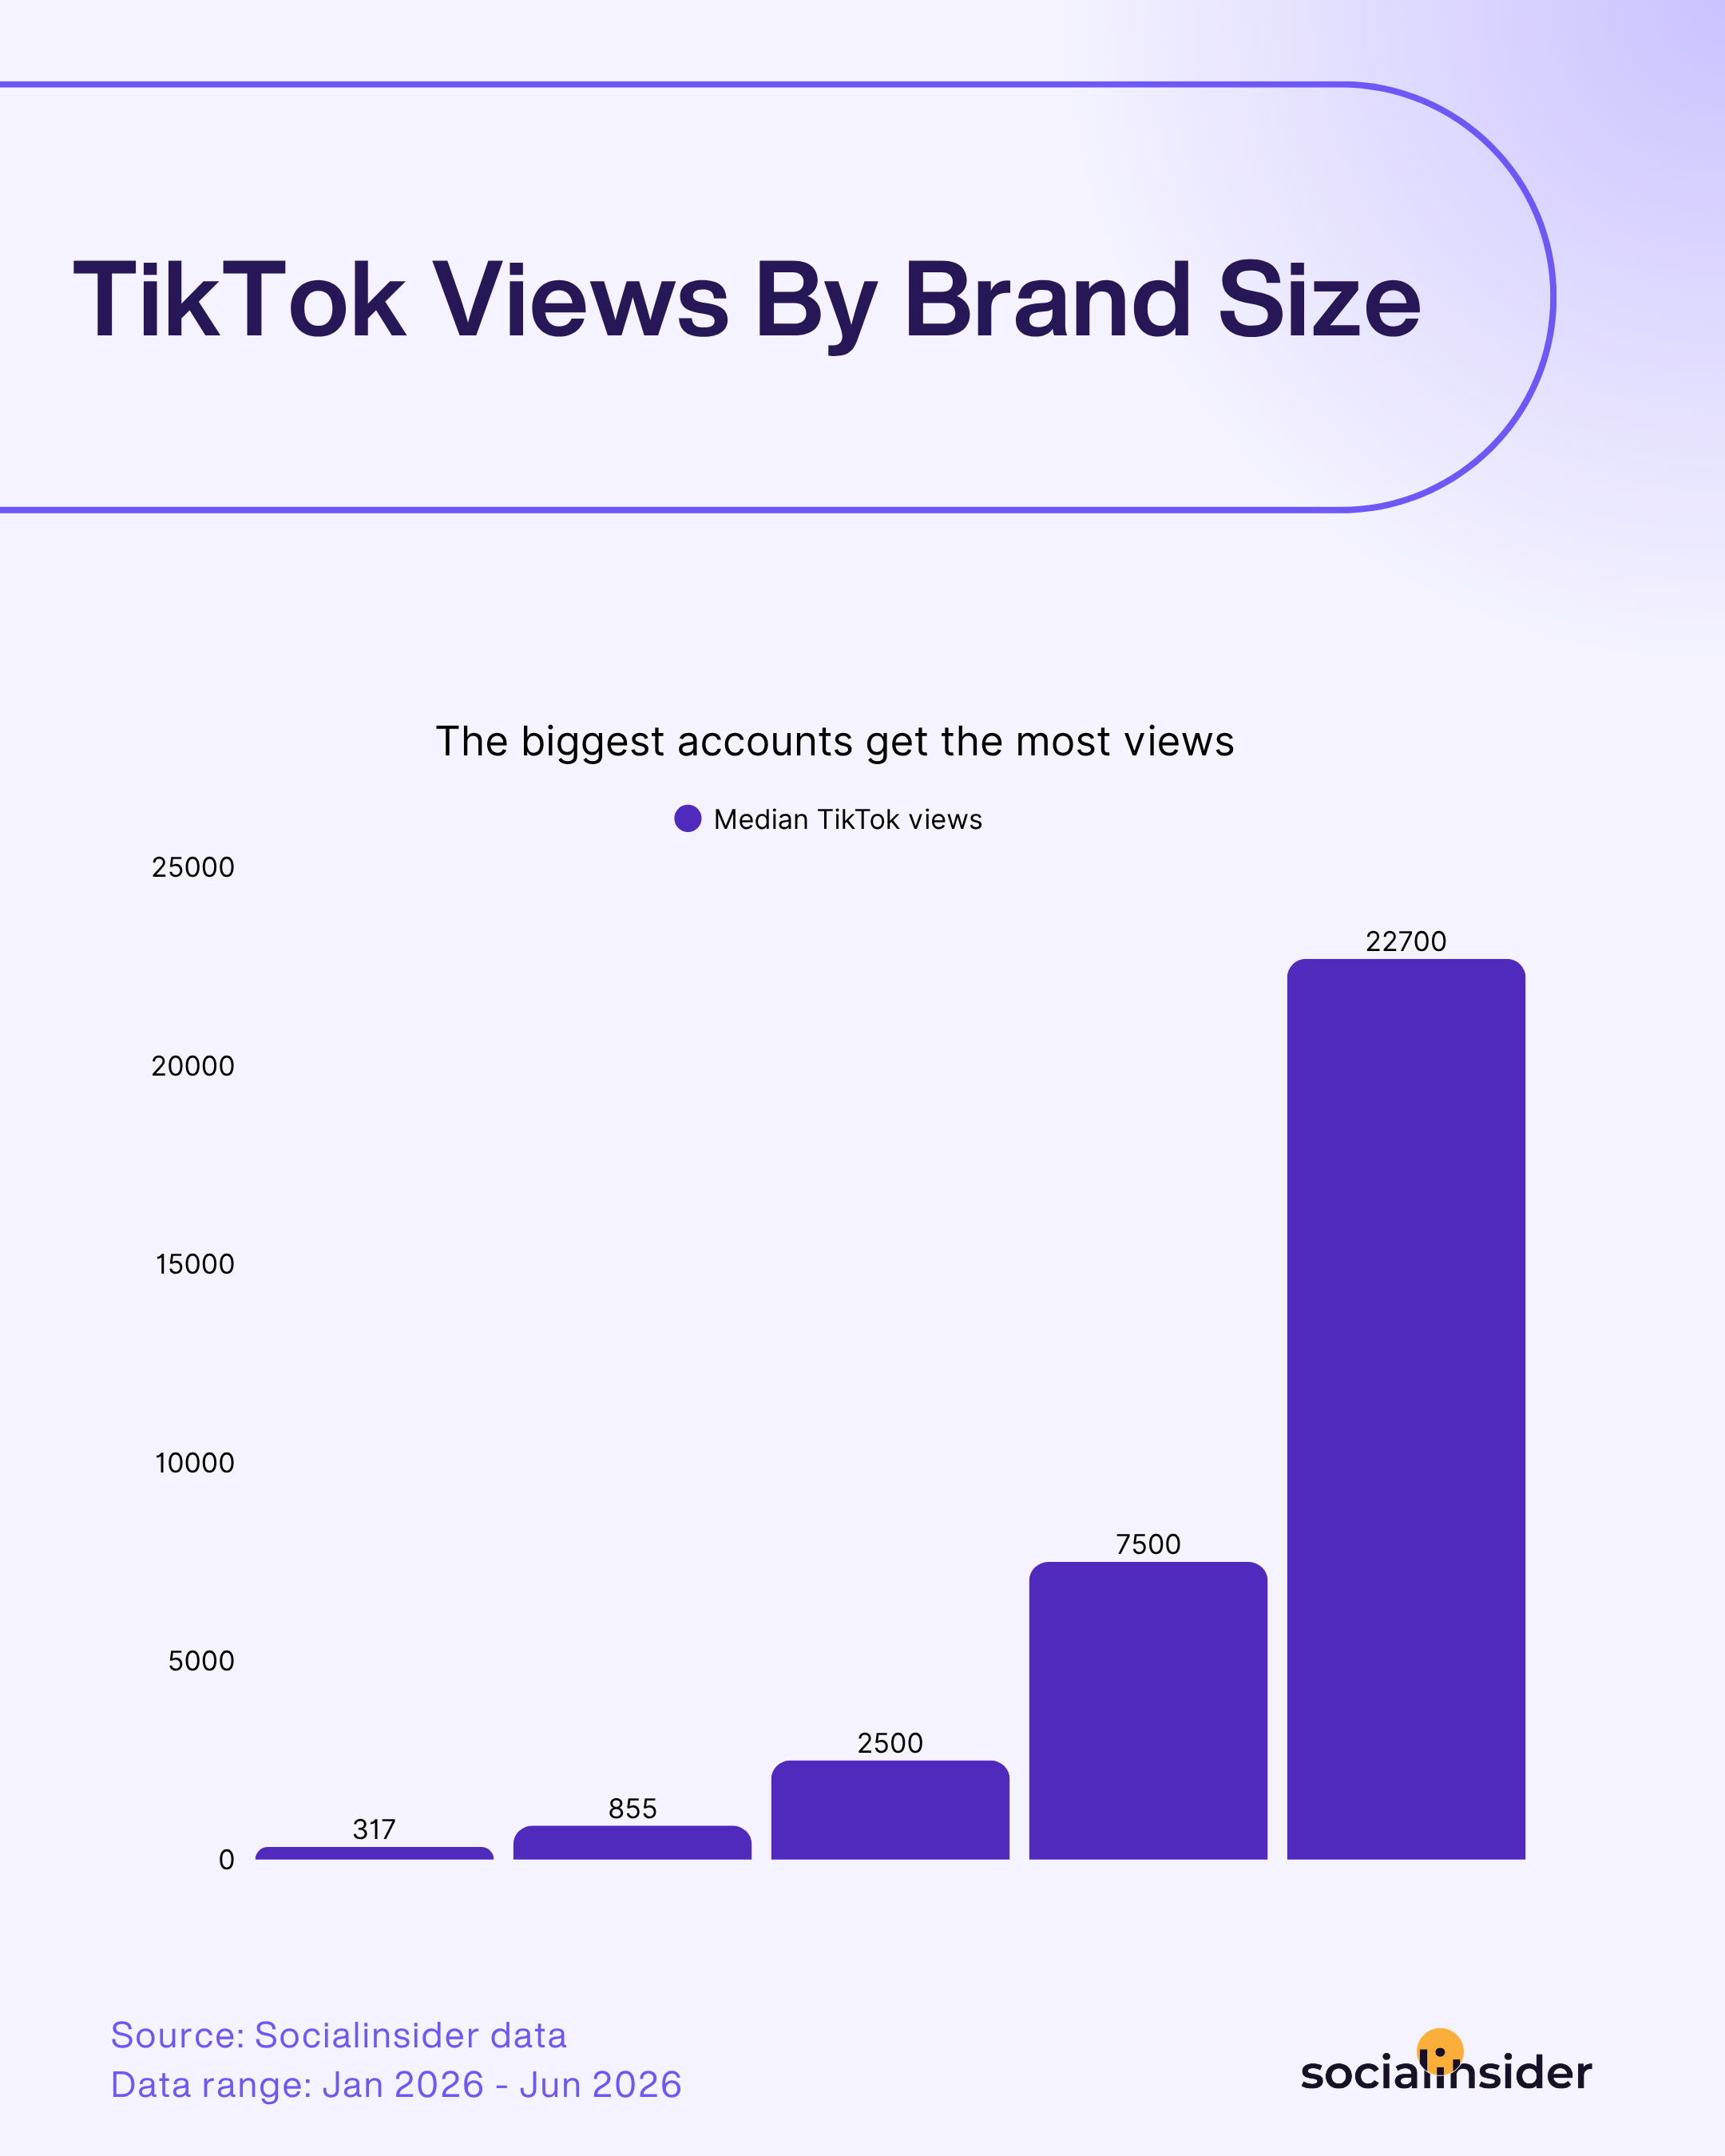
Die Beschleunigung ist hier so stark wie auf keiner anderen Plattform bisher. Die Views verdoppeln oder verdreifachen sich ungefähr auf jeder Stufe. Sie steigen von einigen Hundert bei den kleinsten Marken auf weit über 20.000, sobald ein Konto die Marke von 100.000 Followern überschreitet. Das ist kein allmählicher Anstieg, sondern kommt eher einem exponentiellen Wachstum gleich. Das passt dazu, wie die Distribution auf TikTok tatsächlich funktioniert: Der Algorithmus testet den Content zunächst mit einem kleinen Teil der Followers eines Kontos. Reagiert diese Gruppe gut, spielt er das Video einer viel größeren Gruppe aus. Größere Konten haben eine bewährte Erfolgsbilanz, der der Algorithmus bereits vertraut. Deshalb wird ihr Content schneller und zuverlässiger weiter ausgespielt als der Content neuerer oder kleinerer Konten.
Performance-Statistiken der TikTok Video Views nach Videolänge
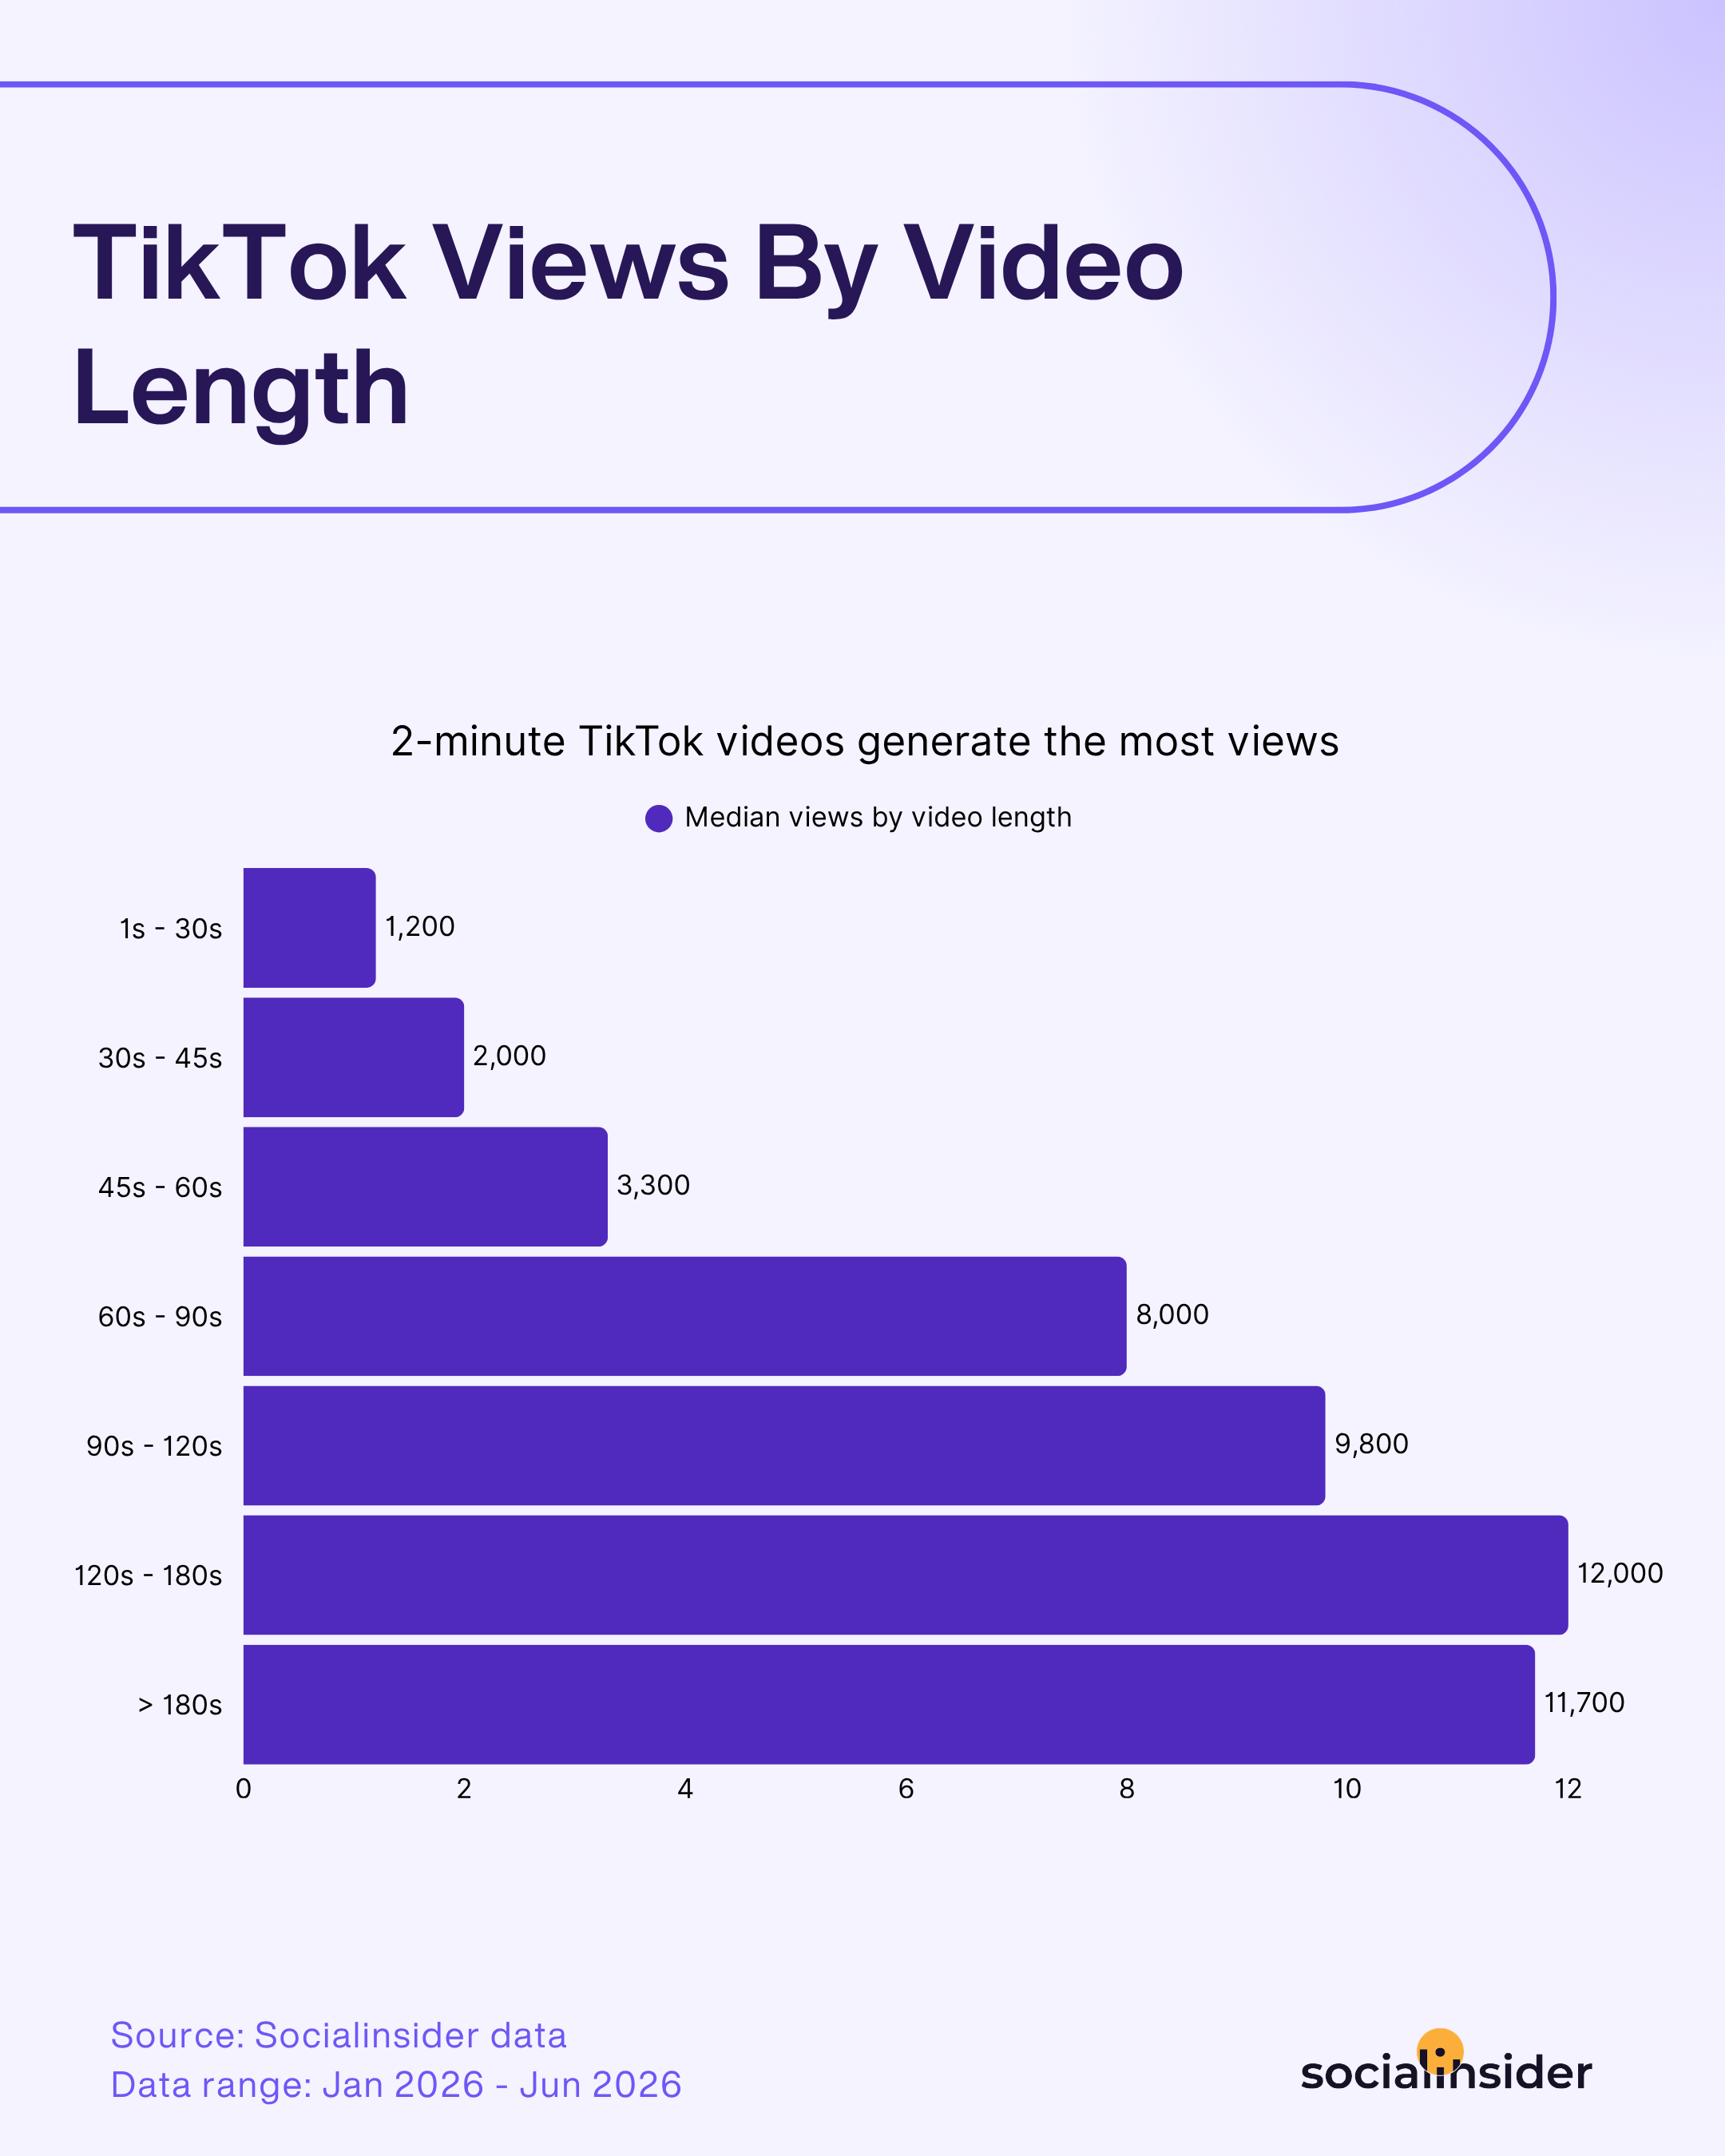
Views folgen hier einer klaren Aufwärtskurve. Der Anstieg ist deutlich, sobald Videos die Ein-Minuten-Marke überschreiten. Von der kürzesten Kategorie bis 60 Sekunden steigen die Views allmählich an. Zwischen den Kategorien 45–60 Sekunden und 60–90 Sekunden verdoppeln sie sich jedoch ungefähr. Dieser Anstieg setzt sich fort und erreicht im Bereich von 120–180 Sekunden seinen Höhepunkt, bevor er nach der Drei-Minuten-Marke leicht zurückgeht.
Das erzählt eine andere Geschichte als beim Engagement. Während das Engagement sowohl sehr kurze als auch sehr lange Videos belohnte und in der Mitte abfiel, bevorzugen Views fast durchgehend längere Videos. Die größten Zuwächse zeigen sich, sobald ein Video die Ein-Minuten-Marke überschreitet. Wenn reach Priorität hat, sprechen die Daten klar für längeren Content, auch wenn ein kurzes Video unter 30 Sekunden bei der engagement rate weiterhin gewinnen kann.
Strategische Maßnahmen, um deine Views auf TikTok zu steigern
- Nutze prozessorientierte oder zeitbasierte Formate, um längere Laufzeiten zu rechtfertigen. Formulierungen wie „Sieh dir an, wie das in 60 Sekunden passiert“ oder „Das hat sich in zwei Minuten verändert“ geben Zuschauern einen Grund, bis zum Ende dabeizubleiben. Das wird immer wichtiger, wenn du dich auf den Bereich ab 90 Sekunden konzentrierst, in dem die Views ihren Höchststand erreichen.
- Nutze Retention-Analysen, um den Erfolg deines Contents rückwärts zu analysieren. Wenn du unabhängig von der Gesamtlänge regelmäßig um die 3- bis 5-Sekunden-Marke Abbrüche siehst, sind deine Intros das Problem – nicht deine Laufzeit.
- Verwandle deine erfolgreichsten kurzen Videos in längere Versionen. Wenn ein 15- bis 30-sekündiges Video bereits gut lief, erweitere es zu einer über 90-sekündigen Version mit mehr Details oder einer ausführlicheren Handlung. Vergleiche anschließend die Views direkt, um den Einfluss der Länge auf dein eigenes Publikum zu sehen.
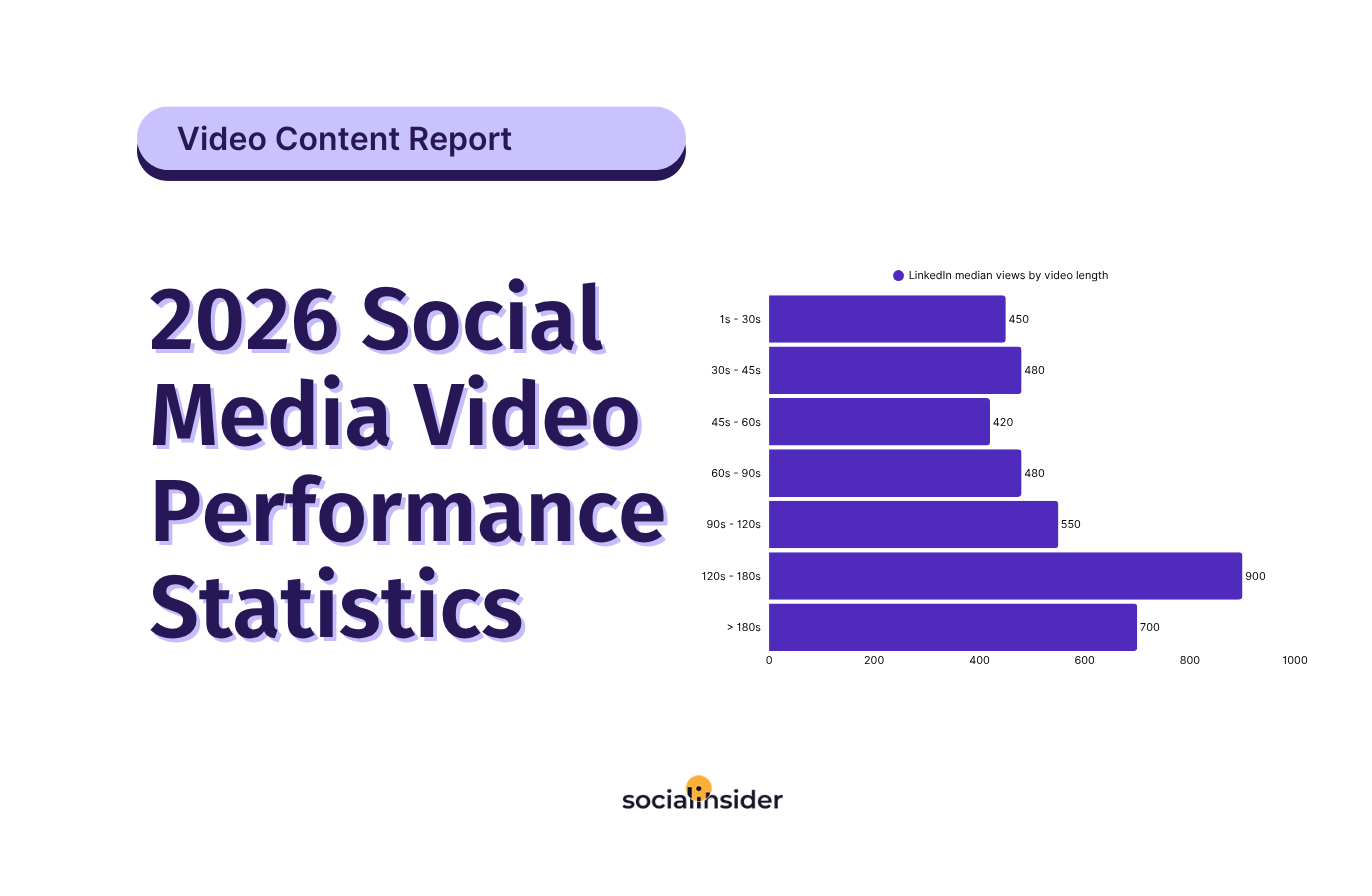
Performance-Statistiken für LinkedIn Video Views
LinkedIns Engagement-Kurve blieb bei zunehmender Markengröße relativ gleichmäßig. Die Views erzählen jedoch eine etwas weniger vorhersehbare Geschichte: mit einem Einbruch in der Mitte, bevor sie stark abschlossen.
Performance-Statistiken für LinkedIn Video Views nach Markengröße
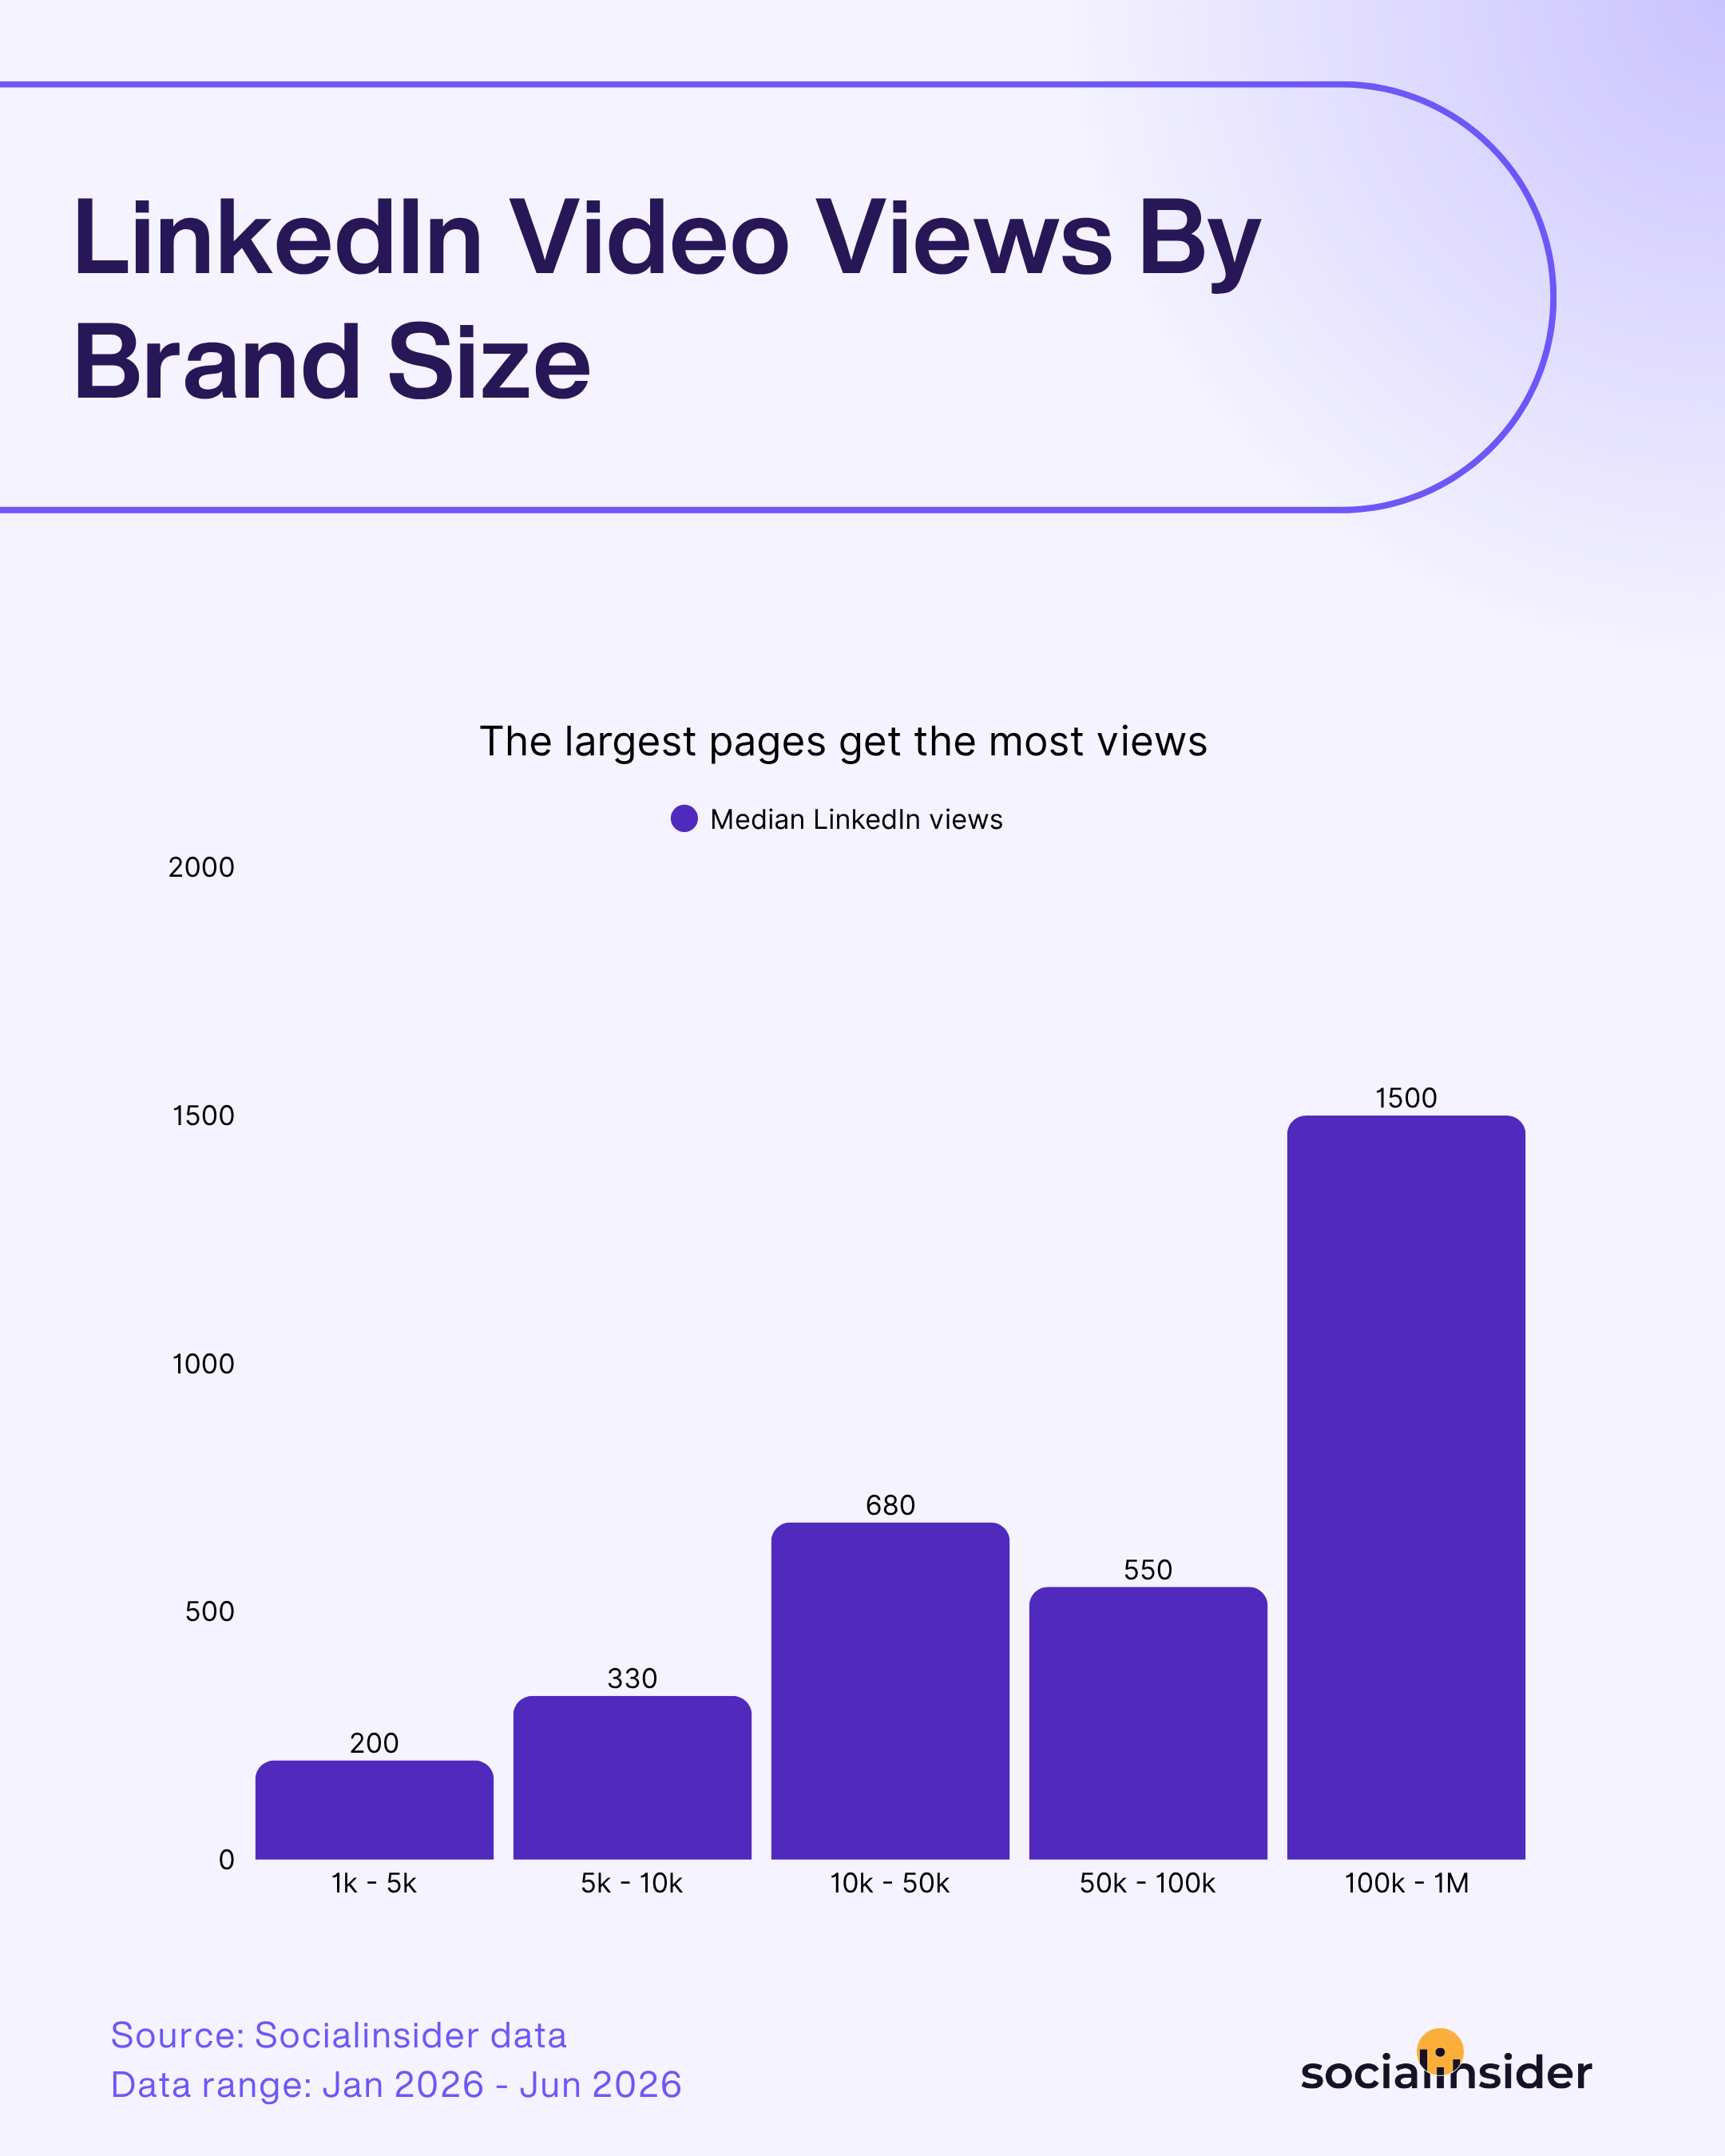
Die Views steigen von den kleinsten Marken bis zum Bereich von 10K–50K kontinuierlich an und verdreifachen sich dabei mehr als. Danach folgt jedoch ein unerwarteter Rückgang: Die Stufe von 50K–100K erzielt tatsächlich weniger Views als die direkt darunterliegende Stufe, bevor die Werte stark ansteigen, sobald Marken den sechsstelligen Follower-Bereich erreichen – auf mehr als das Doppelte des Werts im Bereich von 10K–50K. Dieser Rückgang deutet auf ein Sichtbarkeitsplateau im mittleren Bereich hin. An diesem Punkt scheint der LinkedIn-Algorithmus auf stärkere Signale für Beständigkeit oder Autorität zu warten, bevor er eine Marke mit einer größeren Ausspielung belohnt. Sobald diese Signale etabliert sind, steigen die Views so stark an, dass sie jede frühere Stufe übertreffen.
LinkedIn Video Views Performance-Statistiken nach Videolänge
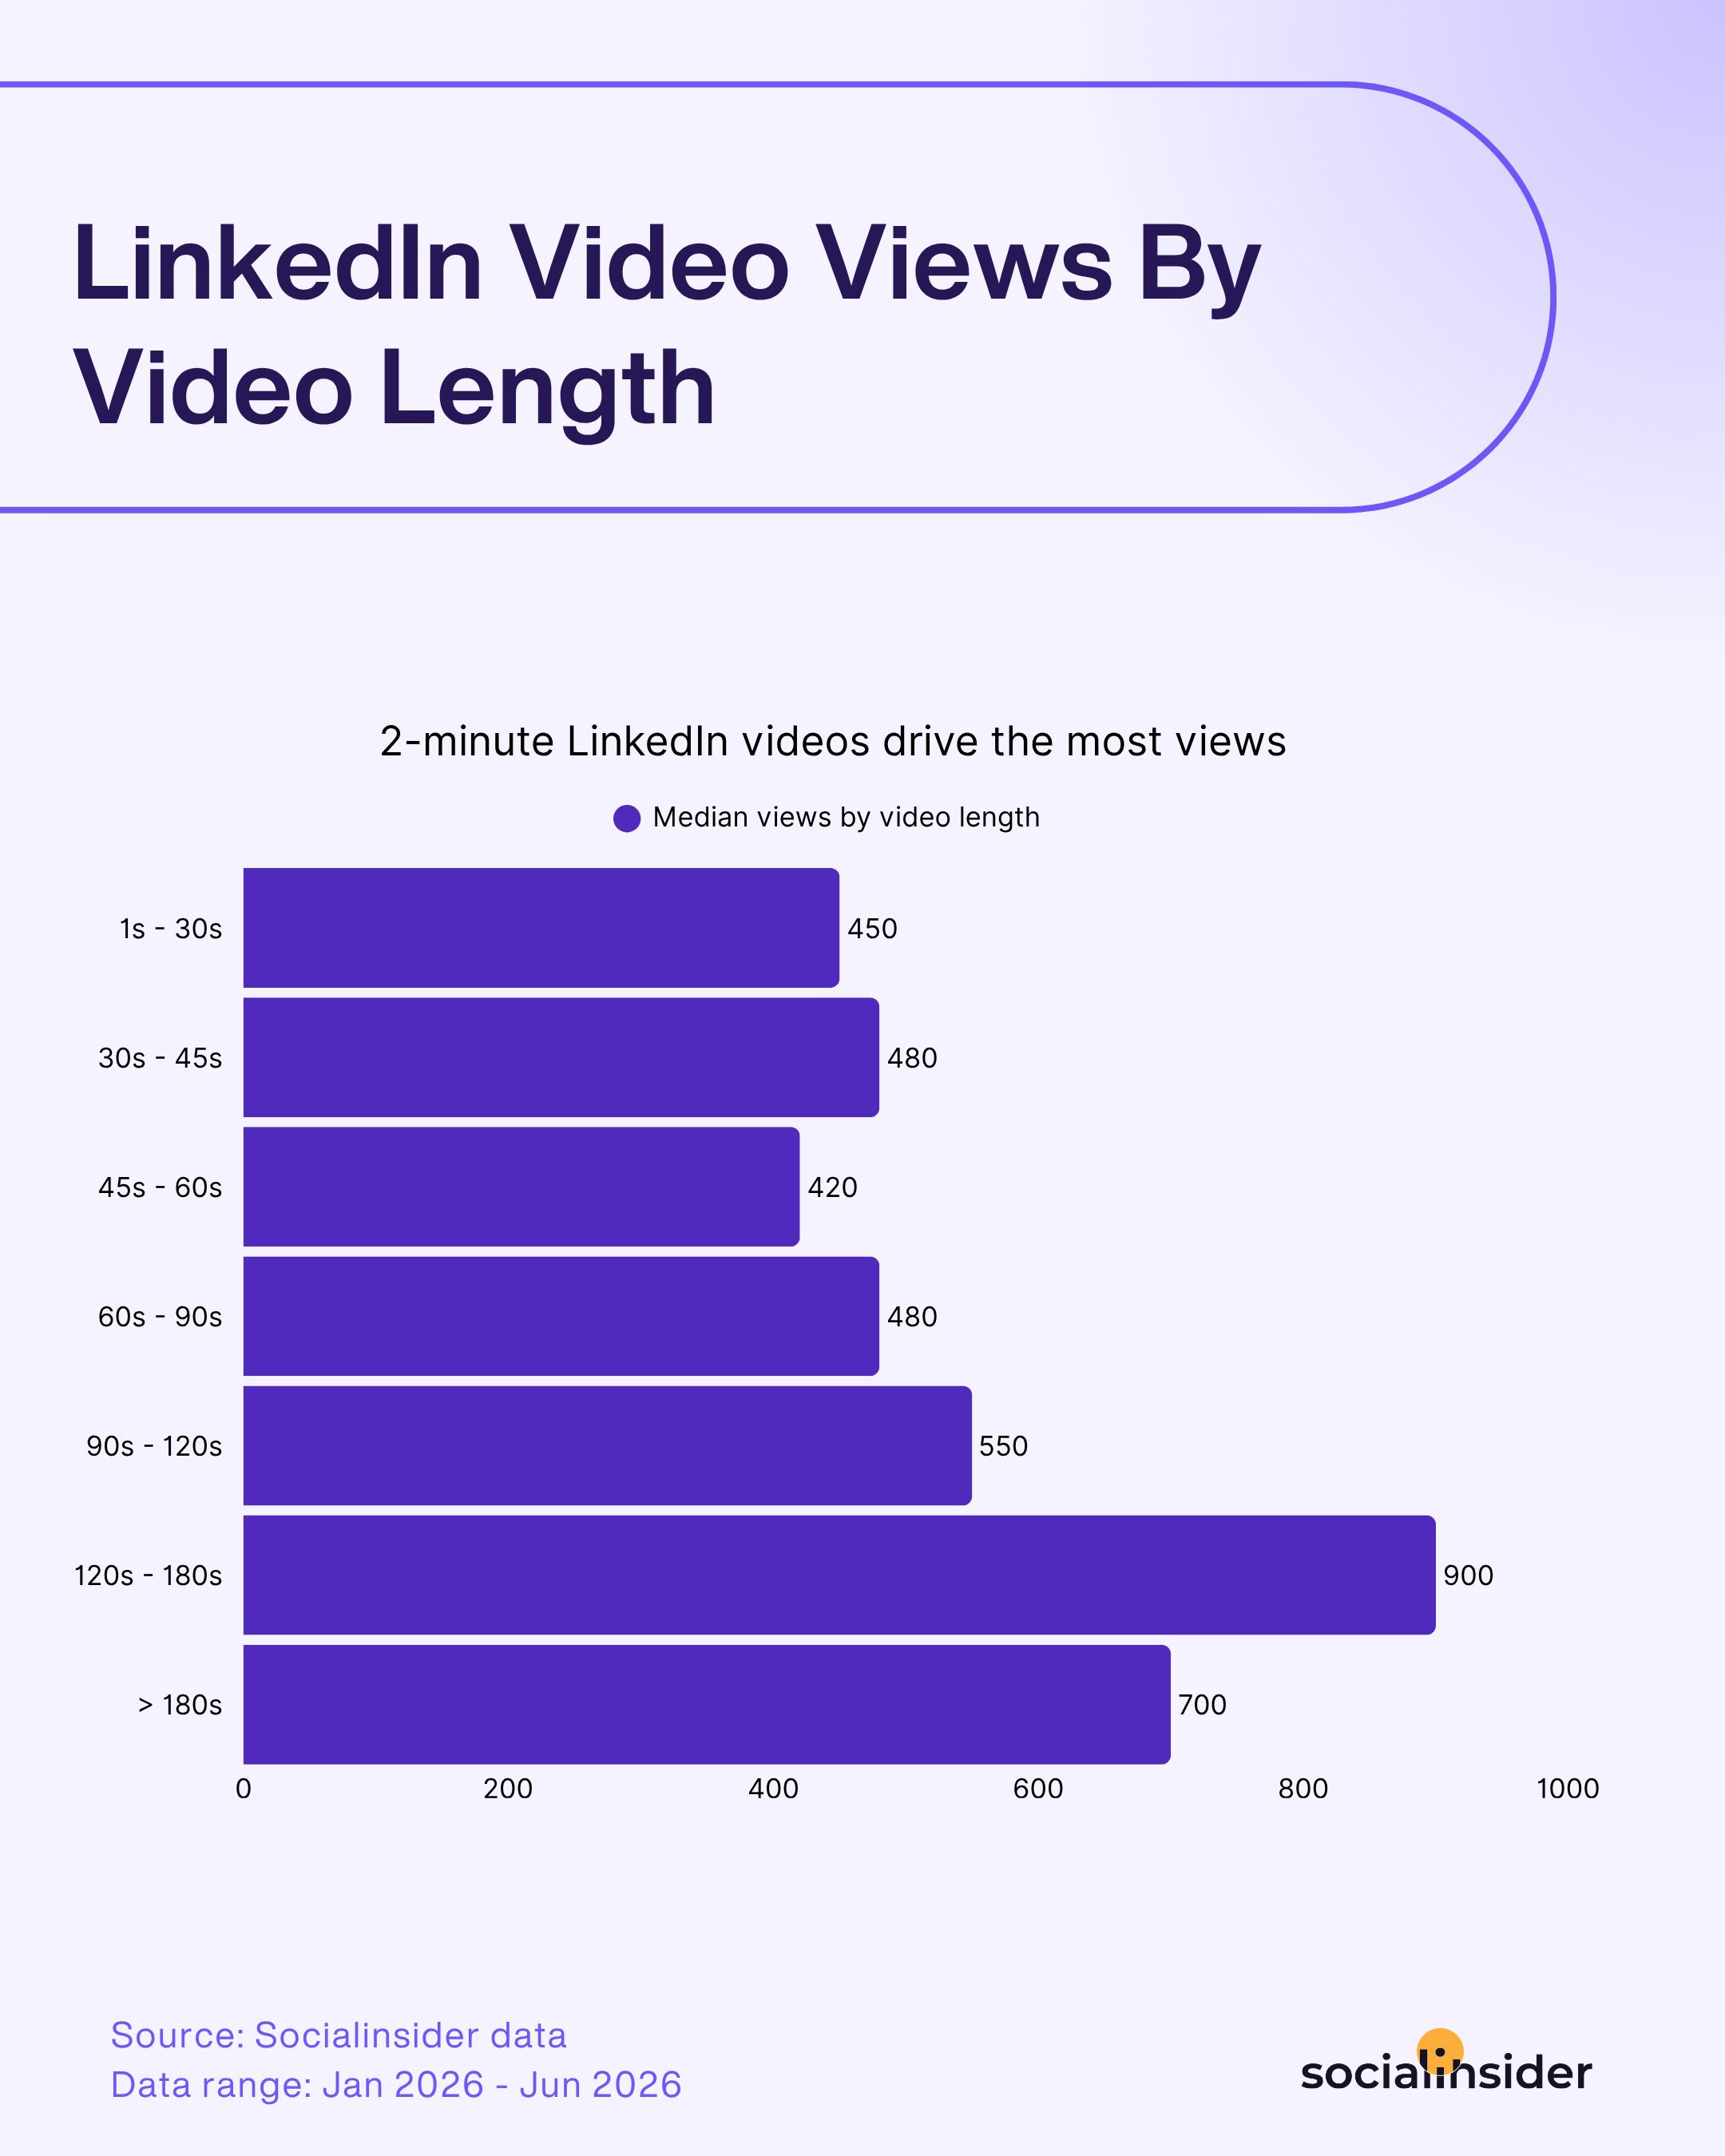
Views bleiben in den kürzeren Zeitspannen relativ konstant und bewegen sich unabhängig davon, ob ein Video 30 Sekunden oder eineinhalb Minuten dauert, in einem engen Bereich zwischen etwa 420 und 550. Die eigentliche Bewegung setzt später ein: Views steigen im Bereich von 120–180 Sekunden stark an und verdoppeln damit beinahe das Niveau der direkt darunterliegenden Zeitspanne, bevor sie nach der Drei-Minuten-Marke etwas zurückgehen.
Das entspricht weitgehend dem Engagement-Muster, das wir zuvor bei LinkedIn gesehen haben. Kürzere Videos werden nicht abgestraft, stechen aber auch nicht hervor. Im Zeitfenster von 2–3 Minuten erreichen sowohl die Views als auch das Engagement gemeinsam ihren Höchststand. Das bestätigt dieselbe Erkenntnis: Bei LinkedIn zahlt sich die Länge speziell im Bereich von 120–180 Sekunden aus – nicht davor und auch nicht deutlich darüber hinaus.
Strategische Taktiken, um deine Video Views auf LinkedIn zu steigern
- Plane gezielt auf das 2–3-Minuten-Format hin, statt zufällig dort zu landen. Wenn die meisten deiner Videos derzeit kürzer als eine Minute sind, betrachte den Bereich von 120–180 Sekunden als eigenes Format. Plane dafür eine eigene Struktur mit Intro, zentraler Erkenntnis und Fazit – statt einfach nur eine längere Version deines üblichen kurzen Videos zu erstellen.
- Setze auf lehrreichen Content, um deine Sichtbarkeit zu steigern. Die Plattform belohnt Content mit echtem Mehrwert statt oberflächlichem Inhalt. Ein Video, das eine einzelne Statistik, eine schnelle Struktur oder eine klare Idee erklärt, erzielt meist mehr Reichweite als Content, der in Eigenwerbung abgleitet.
- Vergleiche neue Videos mit der Größenklasse deines eigenen Kontos, nicht mit dem Plattformdurchschnitt. Da die Kurve der Markengröße sinkt und sprunghaft steigt, statt gleichmäßig nach oben zu verlaufen, solltest du die Views eines Videos daran messen, was für deinen spezifischen Followers-Bereich typisch ist – nicht an einem pauschalen plattformweiten Wert. Andernfalls hältst du ein normales Plateau fälschlicherweise für eine schwache Performance.
Methodik
Die Ergebnisse der Studie basieren auf der Analyse von 111K Videos, die auf Facebook, Instagram, TikTok und LinkedIn veröffentlicht wurden und zu Unternehmensseiten gehören, die zwischen Januar - Juni 2026 auf diesen Plattformen aktiv waren.
Für Instagram und Facebook wird die durchschnittliche Video-Engagement-Rate anhand der Followers berechnet.
Für TikTok wird die durchschnittliche Video-Engagement-Rate anhand der Views berechnet.
Für LinkedIn wird die durchschnittliche Video-Engagement-Rate anhand der Impressions berechnet.
Erhalte aussagekräftige Video-Performance-Metriken
Führe eine leistungsstarke Video-Content-Analyse durch und entdecke bewährte Vorgehensweisen zur Optimierung deiner Strategie!
Bereit, deine social media strategy mit Echtzeit-insights zu verbessern?
Erhalte strategische insights, analysiere die social media-Performance über alle Kanäle, vergleiche Metriken aus verschiedenen Zeiträumen und lade Berichte in Sekundenschnelle herunter.